Top Features
- New Graph Type: Parallel Plot
- Better Backup System for Each Project
- Data Visualization Improvements in Graph: Tooltip, Faceaway of unselected plot
- Matrix in Workbook
- Common Display Across Layers
- Fit Layers to Page to place layers nicely within graph page.
- Preview of Worksheet
Ease of Use
Projects and Windows
| JIRA | SUMMARY | DETAILS | |||||
|---|---|---|---|---|---|---|---|
| ORG-17633 | Workbook Preview and Thumbnail |
| |||||
| ORG-17631 | New Workbook DialogWhen user launches | Newly designed workbook dialog
| ORG-17477 |
| |||
| ORG-17477 | Sheet Copy Paste across Origin sessions | Right-click on the sheet tab, two new context menu items are available.
Use Copy Sheet to copy current sheet with all information(including the header lines and structure) into the clipboard, and then use Paste as New Sheet to paste it as a new sheet from the clipboard into a new layer or new window. LabTalk command is also provided,
| |||||
| ORG-17653 | Active Window Indicator | When there are many child windows, it's hard to tell which window is active. A magenta frame is added around active window title bar System Variables @AWI = bits as follows @AWF=0 (default), no flashing @AWF=100, in milliseconds, the flashing time | |||||
| ORG-17409 | Hide folder in bottom panel of Project Explorer | We are working on supporting moving windows in bottom panel to reorder them. If there are folders in subfolder, it's hard to reorder windows. So we hide folder in bottom panel.
| |||||
| ORG-9615 | Easier way to create Master page |
| |||||
| ORG- | 17647Better backup system for Origin projects | 17567 | Show Master Items on Screen should be default and convert existing |
| |||
Better backup system for Origin projects |
| ||||||
| Support naming custom color | In Colors dialog which is used to create custom color, a Name box is added to allow user to give the color a name.
| ||||||
| ORG-17078 | Using English date format in C/J version | This will be useful for user who want to keep using English date format in C/J version
| |||||
| ORG-4006 | Show Tooltip for Data Point when Mouseover |
| ORG-16691 | Right click Data Point Tooltip to show context menu | The context menu include five sub menu14614 | Add View in Order of Appearance in Object Manager | Right click below all listed items in Object Manager or Right click the Graph Level to toggle view option |


Graphing
Data Visualization Improvements
| JIRA | SUMMARY | DETAILS |
|---|---|---|
When selecting plot in graph, fadeaway effect on unselected data. | 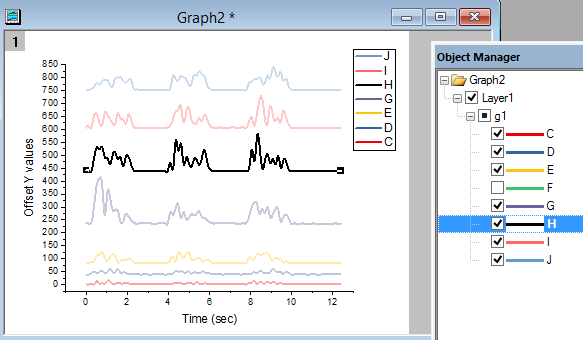 | |
ORG-4006 ORG-16440 ORG-16691 | Tooltip of data points when mousing over data point in graph and the tooltip is customizable. Useful context menu for extra options:
|
Default Tooltip
|

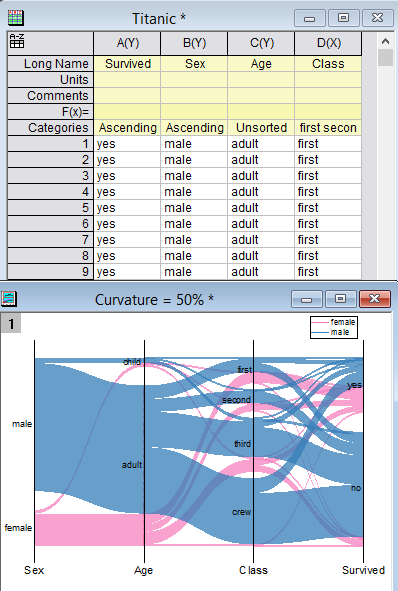
| ORG-17587 | Data Tooltip for Parallel Plot graph |
If click the Go to sheet in the context menu of Data Tooltip, |
all related rows |

...
will be selected |
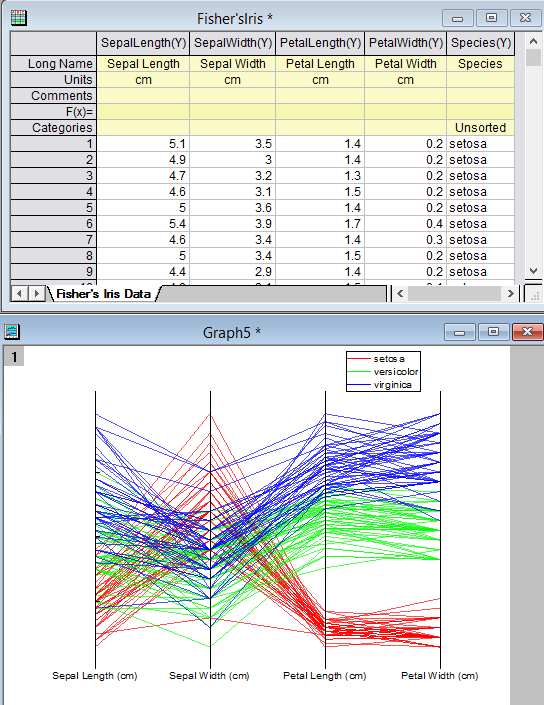
New Graph Types
Parallel Plot
support| JIRA | SUMMARY | DETAILS |
|---|
Data Visualization Improvements:
- When selecting plot in graph, fadeaway effect on unselected data.
- When mousing over data points, data coordinates show and customizable.
Parallel Plot
|   |
ORG-15328
ORG-17656
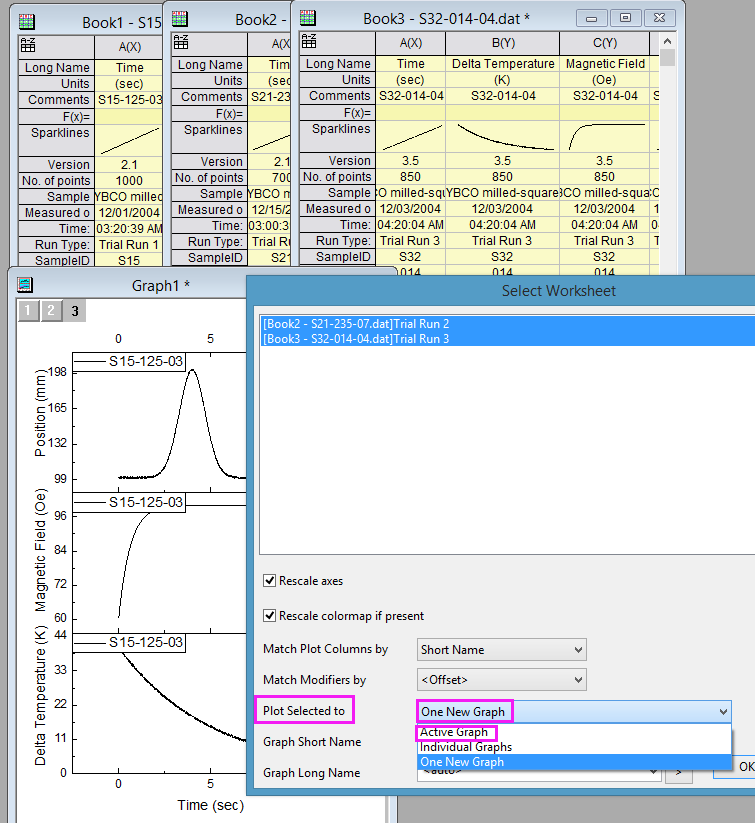
Batch Plot Improvements
- Add data from many different sheets/books into an existing graph
- E.g. After plotting a multiple panel graph with data in one worksheet/book, user wants to add data from other sheet/book to same graph.
- Add data from many sheets/books into a combined graph.
- After plotting a complicated graph with data in one book with several sheets, user wants to create a similar new graph with all data in another book with different number of sheets.
GUI Improvements
- Combine Batch Plot with Book, Sheet and Column into one dialog. There is Batch Plot with dropdown list on the top of the dialog.
- Matching conditions to filter book/sheet are moved on top of the book/sheet list.
- Batch plotting menus and toolbar buttons also combine into single button and menu.

For example, code
\L(1, PatternScale:p200) means set both X scale and Y scale of pattern to 2.
- Allow any object to be skipped as master items
- Apply page size to all
- Allow rotate from landscape to portrait
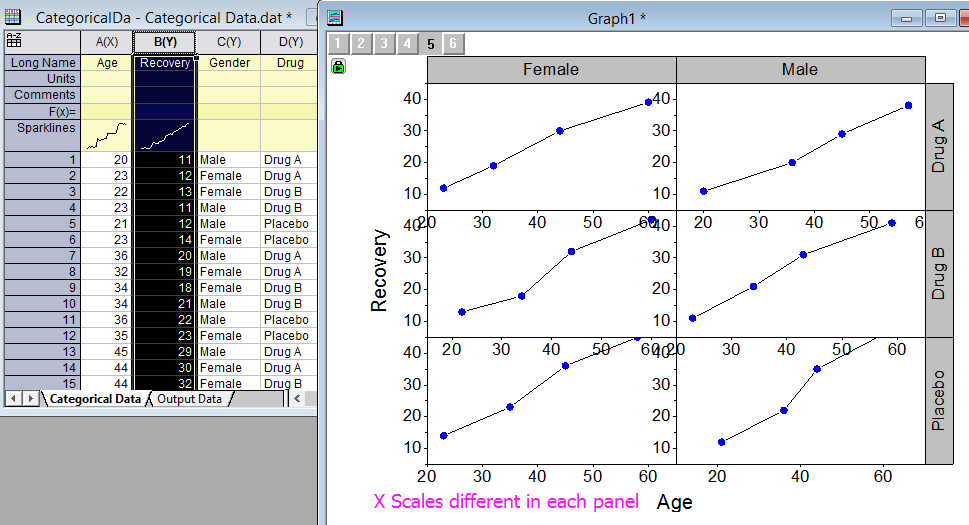
| Cluster Plot: Plot data with grouping column into multiple panel graphs with different XY scale | | |
| Rowwise plot with error bars |
Labels, Legend and Color Scale
| JIRA | SUMMARY | DETAILS |
|---|---|---|
| ORG-17379 | Support scale factor for legend of fill pattern | For example, code \L(1, PatternScale:p200) means set both X scale and Y scale of pattern to 2. |
| More flexible and independent color scale |
|
3D
| JIRA | SUMMARY | DETAILS |
|---|---|---|
| ORG-16558 | Support total label for 3d stacked column/bar | |
| ORG-15881 | Support more arrow shape like 2D in 3D OGL graph | |
| ORG-17067 | Support 2D annotation for 3D scatter plot. | |
| ORG-17060 | Customize a single bar in 3D XYZ bar graph | Customize pattern, color and labels |
| ORG-17466 | Improve preview of 3D OpenGL graphs in XF dialogs | Better preview in our export graph dialog |
Axis
| JIRA | SUMMARY | DETAILS |
|---|---|---|
| ORG-17623 | Extend axis arrow so it can show outside axis ends | User can set offset of axis arrow so the arrow head is longer than original axis. |
Batch Plotting
| JIRA | SUMMARY | DETAILS |
|---|---|---|
| ORG-15328 |
| |
| ORG-17656 | GUI Improvements
| |
Analysis
| JIRA | SUMMARY | DETAILS |
|---|---|---|
| ORG-17639 | Support Add Matrix as Sheet in Workbook | To support an analysis template which contains both workbook and matrix, everything must be in one workbook. So in Origin 2018b, we allow user to right click a workbook tab and choose Add Matrix as Sheet context menu. This actually adds the whole matrix book as a sheet in workbook. You can double click the matrix to open the matrix again. |
| SE of derived parameter should also be included in Summary table | Output the SE of derived parameter and in the Summary table. | |
| Change code to calculate P value for tcdf and fcdf in fitting tools for significance | Calculate the P value more accurately in the Nonlinear Fitting Tools. | |
| ORG-16680 | Add two built-in implicit functions for diode and solar cell | The SolarCellIV and ModDiode fitting functions are added in the Implicit Category. |
| ORG-16540 | Support define Implicit Function with integral | Support define Implicit Function with integral in the Fitting Function Organizer and Fitting Function Builder |
| ORG-12869 | PCA Wants Loading plot and BiPlot support Plot Label | Principal Component Analysis: Loading plot and BiPlot use the latest design: plot label tab in Plot details dialog, and update Axis Labels "Principal Component 1" to be "PC1", add the value of "Percentage of Variance" to the Units label |
| ORG-10828 | Frequency Count/Binning should support output format such as: 0-10, 10-20, etc. | 2D Frequency Count/Binning output sheet creates 4 type columns ahead with following LongName: Bins of A, Bin Beginnings of A, Bin Centers of A, Bin Ends of A and create 3 label row : Bin Beginnings of B, Bin Centers of B, Bin Ends of B. Frequency Counts output sheet creates 4 type columns ahead with following LongName: Bins, Bin Begin, Bin Centers , Bin Ends. |
| ORG-14736 | Add Fourier Self-Deconvolution (Pro Only) method for Find Peaks |
|

...
| JIRA | SUMMARY | DETAILS |
|---|---|---|
| Command to turn on general Audit Log | new LT command doc -log1; //turns on for current project with empty password doc -log1 test;//turns on for current project with password = "test" doc -log0 test;//turns off for current project In Script Window, run HKEY_CURRENT_USER\Software\OriginLab\Origin 9.5b\International\SysV\ALOG with a DWORD value of 1 | |
| ORG-16968 | LabTalk LT to better support install uninstall of Origin files that D&D can install | Add the nlsf_install_fdf and nlsf_uninstall_fdf OC functions to install and uninstall fitting functions. LabTalk Access is supported: run.section(dofile.ogs, OnInstallFDF, "%Yfitfunc\MyGauss.fdf") run.section(dofile.ogs, OnUnInstallFDF, "%Yfitfunc\MyGauss.fdf") LabTalk Access is supported: run.section(dofile.ogs, OnInstallTemplate, "%YMyGraph.otpu") run.section(dofile.ogs, OnUnInstallTemplate, "%YMyGraph.otpu") |
| Better default set index for GetParameterResults | The default value of second parameter of OC function GetParameterResults() was changed to 0. | |
| OC to provide access to LabTalk LT properties on OriginObject | S2: Support accessing page properties by OC functions:Pagebase::SetProp() and Pagebase::GetProp(), for example: void test_Graph_Set_and_Get_Properties()
{
GraphPage gp;
gp.Create("origin");
gp.AddLayer("Test");
double vv;
gp.SetProp("active", 2);
gp.GetProp("active", &vv);
return;
} | |
| Support programming way to control Master Item display | S2: Programming way to view Master Items on Screen LT page.master = 0, not export the Master item. However, if page.master = 1, can use LT script "Menu -e 33096" to toggle viewing Master items on screen, but cannot control it. | |
| ORG-17687 | LT command to remove dividers | Labtalk command to remove divider: page -ADX -<opt> dividerindex;
page -ADGR; |
| ORG-16425 | findFiles x-function should support recursive folder | New variable "recursive" is provided, can set value to 1 to find the files in the recursive folders. |
| ORG-17295 | Problems Saving to or Opening from Google Drive | Origin 2018b supports the remote My Document case (My Document is set up on a network drive. ) |
| ORG-17471 | Give user the option to default to use OPJ format | A new system variable:@OPJ= 0 Project to use new format and Copy Paste also new format 1 Project to use old format but Copy Page to use new format 2 Project to use new format, but Copy page to use Old format 3 Both will use old format |
| ORG-17263 | Autosave Untitled.opj | Origin 2018b supports to autosave for Untitled.opj |
...