| Table of Contents |
|---|
...
| JIRA | Summary | Details | |||
|---|---|---|---|---|---|
| Show Object Manager by default | Many user may not know we have a tool to easily manipulate plots, layers in graph. It's docked on top of Apps Gallery on the right side of Origin workspace. | ||||
| Make it easy to Add User Parameter row or move contents to it | In worksheetUser may not know they can they can right click on column label row header to add user parameters. In Origin 2017 SR1,
| ||||
| Add hot keys to easily do rotation and resize in 3D graphs instead of using control buttons with layer frame selected | Click anywhere inside layer frame to select the layer. Then 1. "tab" to switch among the operation buttons (the last fix position button is not operation type) . | ||||
| Add a built-in Graph theme All Axes On | User can use it to easily turn all axes on in 2D Cartesian coordinate graphs. | ||||
| Graph: Add Function Graph... is renamed as Add Function Plot... | So user understands this is to add function plot in current graph window. | ||||
| Plot: Double Y: Double Y Column menu added | User can directly select two Y columns and plot as Double Y column plots. | ||||
Help: Programming submenus are brought back
| We hide them in Origin 2017 SR0 but user felt it's hard to find only LabTalk Helps, etc. So we bring the submenus back. | ||||
| Help: Live Support Chat... menu is added | User can choose to get help from Tech support online | ||||
Help: Contact Support... menu is updated | User will bring to our webpage with many info. prefilled to submit the contact support form easier. | ||||
More Import data types are added to File: Import collapsible menu by default | CSV, Matlab, OPJ, Image to Matrix show by default under File: Import menu. | ||||
| App Gallery Improvements. |
| ||||
| Improvements on Origin Central |
| Easier way to create and modify User-Defined Parameter rows in worksheet | User may not know they can they can right click on column label row header to add user parameters. In Origin 2017 SR1,
| ||
| Show Preview to the right of Image Analysis dialogs | Before Origin 2017 SR1, the image preview for many XFs related to image processing is at the bottom of the dialog. This makes it awkward to use:
|
...
| JIRA | Summary | Details |
|---|---|---|
| Added system variable @DPPM=1 to disable Plot Popup Menu | Choose Tools: System Variables. Enter DPPM and set it to 1 to turn off the Plot Popup menu. Then the plot menu will be in old way | |
New Plot Types added: 100% Stacked Area Plot 3D Stacked Wall and 3D 100% Stacked Wall | ||
| Set Color Fill Transparency for Text Object | When Text object has Frame turned on, user can set fill color transparency to get this effect:
| |
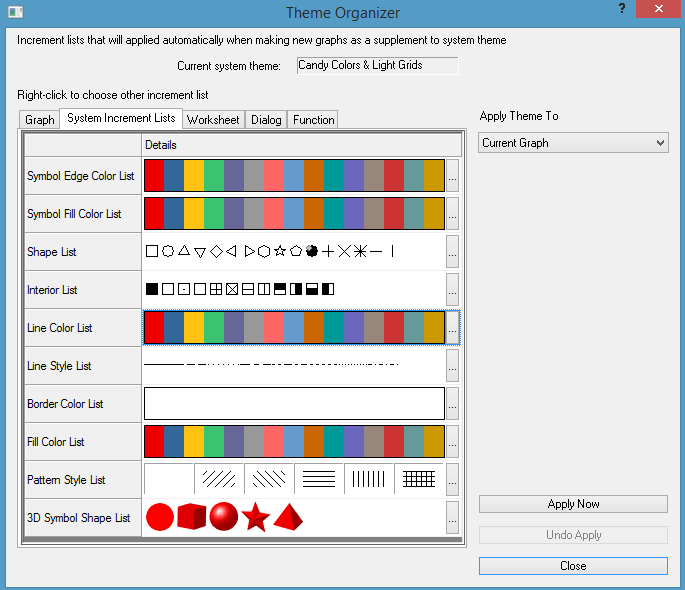
| Improved color increment lists and palettes | Some color lists and palettes such as HeatmapBio, Rainbow Isoluminant, Topography, Weather Temperature, etc. are added. The default list for the line colors has been updated to improve the distinguishability even when lines are thin in the line plot. | |
Better Increment List control of different plot types when plotting multiple data together. When selecting multiple datasets and plot together, Origin will group them and use increment list of color, shape, etc. to distinguish them. In the past, user can set e.g. color list in Graph system theme so all graphs will have same color list. The disadvantage of this is that for different plot types, this may be not appropriate. E.g. for line plot, it's better to use some dark color list, while for column or area plot, it's better to use some light color lists. In Origin 2017 Sr1,
|
| |
| White Out support for Tick Labels | White Out checkbox is added on Format subtab of Tick Labels tab in Axis dialog. | |
| Improve hit test speed when selecting 3D OpenGL Scatter or Vector plots | Click to select (or de-select) the plot itself in 3D Scatter or Vector graph. The problem exists since 9.0 when OpenGL is introduced. | |
| ALT+dragging annotation in Contour graph | Alt+Drag annotation to new location is supported in Contour graph now. | |
Allows half-point font size such as 10.5, etc. | In the past, font size in graph could only be set as integer. | |
| Better default for square ended line and rectangle objects | Default values of the following system variables are changed in Origin 2017 SR1
New system variable @lcr (default is 1) to set the cap of rectangle or legend or text frame | |
| Add match modifiers by option to Batch plotting dialog | This option will affect the Match Modifiers by option of new created clone graph. But it should not affect the option of source graph. | |
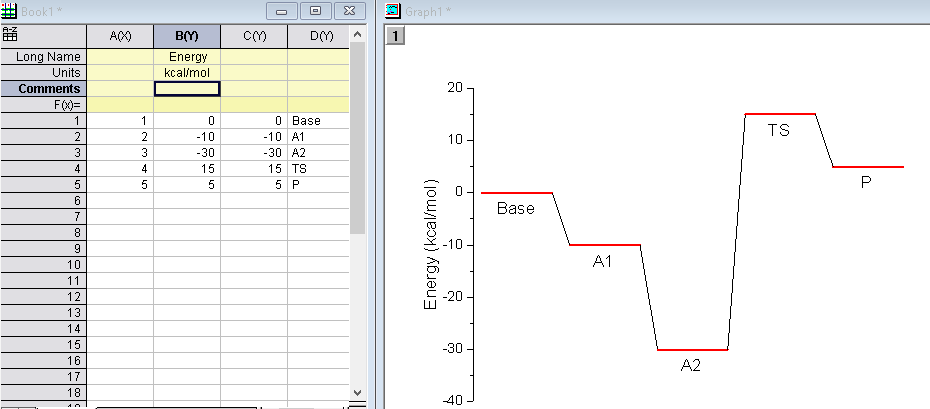
Improvements in Floating bar to better make plotting the following kind of Energy Diagram easier.
| See more http://originlab.com/forum/topic.asp?TOPIC_ID=26067 User has X, Y and Label Data and wants to plot line+symbol graph but show each symbol as a horizontal bar and the lines should connect edges of the bars. It's hard to implement for Line+symbol graph since the line always connect to center of the points, plus even if implemented, horizontal bar width isn't adjustable. We made the following improvements in Origin 2017 Sr1 so that user can achieve this by floating column graph. Add Bar Graph show Zero Values checkbox on Graph tab of Tools: Options dialog to show an horizontal line if floating bar from and to values are the same. page.BarShowZero=-1 (follow Tools: Options settings) , 0 (do not show), 1 (show) Support connect lines between floating column/bars. Open Plot Details dialog. Select Layer on left panel. Go to Stack tab. Check Show Connect Line on Stacked/Floating Column/Bar checkbox. This checkbox was only working for stacked column/bars and was called Show Connect Line on Stacked Column/Bar in the past. User can go to Spacing tab to and set Gap Between Bars to adjust bar width. | |
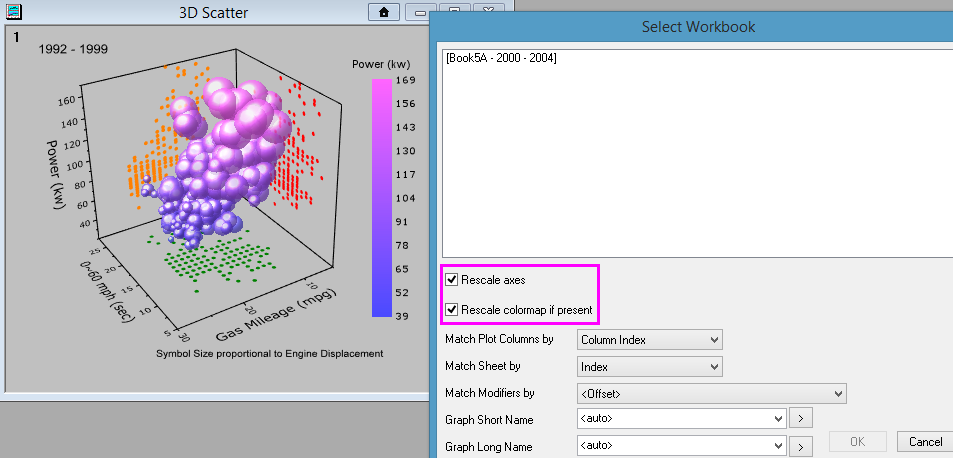
Rescale Axes and Colormap Controls during Batch Plotting |
| |
| Improve rendering of raster images inserted into graphs | After inserting raster image into Origin, when zoom out, or resizing, the image doesn't look clear any more. Improved in Origin 2017 SR1. New System Variable Added: @II, whether enable interpolation for bitmap drawing, 1 for enable(default), 0 for disable. Notice: use @GDIPIE (default 7) for interpolation quality. Set it lower will speed up the drawing but poor quality. | |
| ORG-16041 | Add XY scale range for Kernel Density plot | Add a treenode Grid Range for 2D Kernel Density. User can specify X/Y Minimum/Maximum scale range for Kernel Density plot. |
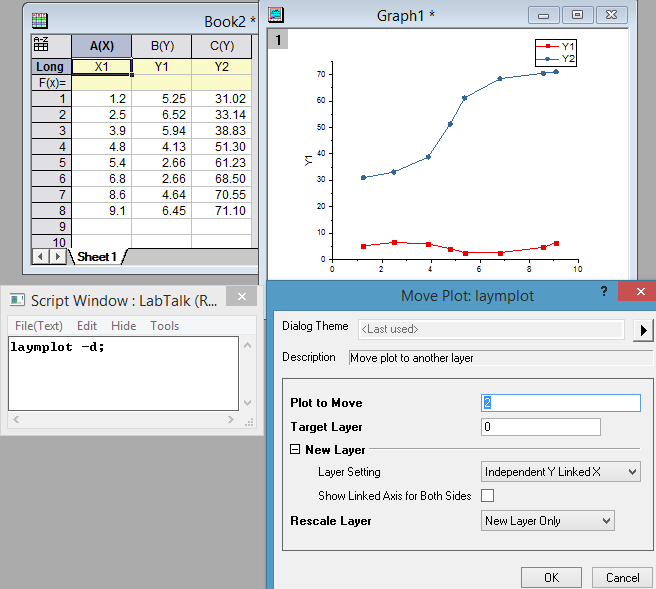
| laymplot X-Function is added to move plot(s) to new y axis/layer | Many times, user asks how to move a plot to right Y axis. Before Origin 2017 SR1, user needs to move the plot from existing layer, add new layer with right Y axis. Then add plot to it. In Origin 2017 SR1, we added an X-Function so it's much easier. With graph window active, choose Window: Script Window In Script Window, run Specify which plot(s) you want to move, e.g. 2 means 2nd plot. 2 4 means 2nd and 4th plots. Click OK to move it. Note: Plot customization such as color, etc. can't be moved to new layer. So we recommend move plot(s) first and then customize plot in each layer. | |
| ORG-15278 | Use only category legend and auto update | Add a option for Categorical Legend update dialog named Use only category legend and auto update. When it's checked, you can change the Makes filter and see plot and legend updated accordingly. |
...
| JIRA | Summary | Details |
|---|---|---|
| ORG-15968 | Matrix Image Crop on multiple object | Support cropping on multiple matrix/image objects in the same matrix sheet. |
...