| Table of Contents |
|---|
Origin 2020
Graphing
Graph Types
ID | JIRA | Summary | Description | Details | ||||||
|---|---|---|---|---|---|---|---|---|---|---|
15610 | Download Correlation Plot APPS-890 | Correlation Plot | Piper Diagram | Make piper diagram using specified ions dataset. | Download Piper Diagram app from the page and install the app. Highlight columns in the worksheet. Click the Correlation Plot icon in the Apps Gallery window to open the dialog. 
 | 1562 | 3D Antenna Radiation Pattern | Download 3D Antenna Radiation Pattern This app can be used to create piper diagram used the specified ions data.
 | ||
0 | Marginal Abatement Cost Curve | Create marginal abatement cost curve. | Download Marginal Abatement Cost Curve app from the page and install the app. This App can create a marginal abatement curve from worksheet columns. Input data includes Abatement Potential, Abatement Cost, and an optional column for color group.  | |||||||
0 | Soil and Rocks Classification Diagrams | Help to create Soil and Rocks Classification Diagrams with provided templates | Download Soil and Rocks Classification Diagrams app from the page and install the app. This propose of 3D Antenna Radiation Patternapp is to help user to plot 3D antenna radiation pattern from a virtual matrix. In addition, this app can also help user to prepare virtual matrix from the raw data.
 | 1563 | X-Ray Diffraction Analysis | Download X-Ray Diffraction to provide you a few popular ternary plot templates to show the relative compositions of soils and rocks:
 |
Data Handling
Importing Third Party Formats
ID | JIRA | Summary | Description | Details |
|---|---|---|---|---|
0 | Word Connector | Connect to tables and images in Word document. | This App connects the Origin project to a Word document in docx format. | |
0 | Import NMR Data | Import NMR data in different formats. | This App imports NMR data in different formats, including FID data and processed data. | |
0 | LeCroy Connector | Connect to a LeCroy trace data file. | This App connects the Origin project to LeCoy waveforms (*.trc). |
Analysis
Fitting
ID | JIRA | Summary | Description | Details | ||||
|---|---|---|---|---|---|---|---|---|
0 | 2D Peak Analysis | Perform 2d peak fitting and integration for each peak. | Download 2D Peak Analysis app from the page and install the app. This app can help to do simple X-Ray diffraction analysis in Origin.Activate the graph with a diffraction pattern of material, and select the desired reference patterns and the color assignments, click OK button to add it to the graph. 
| 1564 | Zoomed Inset Plus | Download Zoomed Inset Plus be used to perform 2d peak fitting, and integrate each peak fitted data.
 | ||
0 | Neural Network Fitting | Fit data with neural network. | Download Neural Network Fitting app from the page and install the app. This app can be used to fit data with neural network. It trains a neural network to map between a set of inputs and output. Features include:
|

Statistics
ID | JIRA | Summary | Description | Details |
|---|---|---|---|---|
0 |
Signal Processing
ID | JIRA | Summary | Description | Details |
|---|---|---|---|---|
Image Processing
ID | JIRA | Summary | Description | Details |
|---|---|---|---|---|
0 | Video Data Explorer | Explore video and related measurement data. | Download Video Data Explorer app from the page and install the app. This app can be used to explore a video and related measurement data.
 |
Origin 2019b
Graphing
Graph Types
ID | JIRA | Summary | Description | Details |
|---|---|---|---|---|
0 | 3D Wind Rose | Help to create a 3D wind rose graph | Download 3D Wind Rose app from the page and install the app. Zoomed Inset PlusThis app can add a rectangle to 2D Cartesian graph with Cartesian coordinate system (line, scatter, and line+symbol plot), so for zooming in the part of plot covered by this rectangle, which is put into an inset layer. help to create a 3D wind rose graph and to change the plot properties like number of grids, direction labels, sphere scale and orientation easily.  | |
0 | Concave Hull | Create 2D concave hull. | Download Concave Hull app from the page and install the app. | |
Isosurface Plot | Create isosurface from regular volume data. | Download Isosurface Plot app from the page and install the app. This app can create isosurface plot from stacked matrix objects in MSheet, XYZZ columns in worksheet or a function of three indepent variables. The level for the isosurface can be customized. |
Data Handling
Importing Third Party Formats
ID | JIRA | Summary | Description | Details | 1565||||
|---|---|---|---|---|---|---|---|---|
Minitab XPORT Connector Download Minitab | Connect to SAS XPORT files. | Download XPORT Connector app from the page and install the app. Minitab Connector app can connectThis App connects the Origin project to Minitab 19 projects (.mpx) and worksheets (.mwx). | 1566 | MetroPro Connector | Download MetroPro Connector an XPORT file. Features include:
|
Worksheet Data Manipulation
ID | JIRA | Summary | Description | Details |
|---|---|---|---|---|
Hysteresis | Create and plot separate datasets for each segment of hysteresis data. | Download Hysteresis from the page and install the app. This app can split cyclic data into forward and backward segments. These divided segments can be used for further peak analysis.  |
Analysis
Fitting
...
ID | JIRA | Summary | Description | Details | ||||
|---|---|---|---|---|---|---|---|---|
0 | Gel Molecular Weight Analyzer | Determine gel molecular weight from electrophoresis. | Download Gel Molecular Weight Analyzer app from the page and install the app. MetroPro Connector app can connect the Origin project to MetroPro binary data file (*.dat). | 1567 | BioLogic Connector | Download BioLogic Connector This app fits a standard curve to relate the known molecular weights of proteins in a set of standards (y-axis) to their relative migration (x-axis), and estimates molecular weights of unknow proteins. Features include:
 | ||
0 | Fit ODE | Fit ordinary differential equation. | Download Fit ODE app from the page and install the app. BioLogic Connector app can connect the Origin project to BioLogic MPR (*.mpr) files. | 1568 | MDF4 Connector | Download MDF4 Connector This app is capable of fitting ordinary differential equation.  | ||
0 | Speedy Fit | Download Speedy Fit app from the page and install the app. MDF4 Connector app can connect the Origin project to MDF4 (*.mf4) files. |
Analysis
This app can be used to fit a large number of datasets from a worksheet sequentially and speedily, and create a simple report table of parameter values and fit statistics. Features include:
 |
Statistics
ID | JIRA | Summary | Description | Details | 1569|||||
|---|---|---|---|---|---|---|---|---|---|
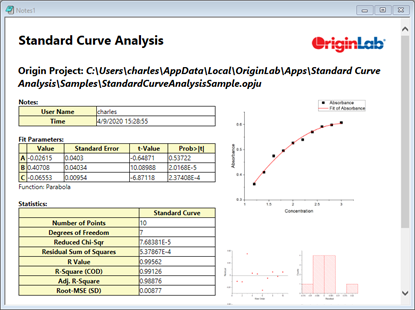
Linear Regression with Marginal Distribution | Download Linear Regression with Marginal Distribution Quantile Regression | Explore the relation between continuous or categorical independent variables and specified quantiles of a dependent variable. | Download Quantile Regression app from the page and install the app. Linear Regression with Marginal Distribution app can create a report of linear regression, including a graph with marginal distribution. 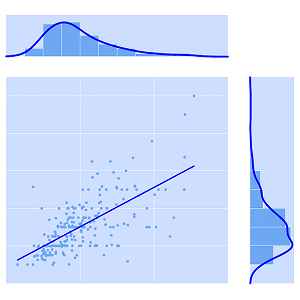 | 1570 | Standard Curve Analysis | Download Standard Curve This app can be used to identify the relation between independent variables and specified quantiles of a dependent variable. Features include:
 |
Signal Processing
ID | JIRA | Summary | Description | Details | ||||
|---|---|---|---|---|---|---|---|---|
0 | 2D Correlation Spectroscopy Analysis | Calculate synchronous and asynchronous correlation spectra. | Download 2D Correlation Spectroscopy Analysis app from the page and install the app. This app fits a standard curve like Concentration vs Absorbance. Such a curve can be used to determine concentrations in "unknown" samples with their measured absorbance. This method is commonly used to analyze RIA or ELISA Data.
 | 1571 | Linear Mixed Effects Model | Download Linear Mixed Effects Model app calculates synchronous and asynchronous correlation spectra from one set of dynamic spectra (homo correlation) or two sets of dynamic spectra (hetero correlation) induced by perturbation.  | ||
0 | Change Point Analysis | Detect single and multiple change points within data. | Download Change Point Analysis app from the page and install the app. This app can be used to detect single and multiple changes within a given time series or sequence. Features include:
 |
Image Processing
ID | JIRA | Summary | Description | Details |
|---|---|---|---|---|
Origin 2019
Graphing
Graph Types
ID | JIRA | Summary | Description | Details | ||||
|---|---|---|---|---|---|---|---|---|
Graph Publisher | Help to export graphs and prepare a graph for publication. | Download Graph Publisher app from the page and install the app. Linear Mixed Effects Model App fits a linear mixed effects model for data collected in groups. A mixed effects model consists of fixed effects and random effects. Fixed effects are conventional linear regression. Random effects have linear coefficients that vary with respect to one or more grouping variables. 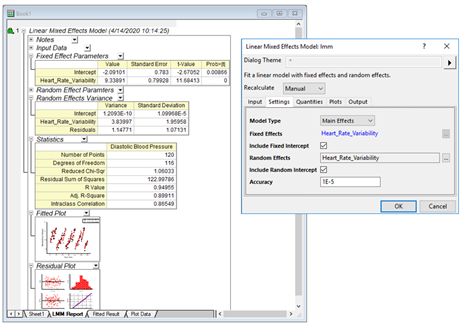 | 1572 | Fit Adsorption Isotherm | Download Fit Adsorption Isotherm Features
| |||
Batch Plotting | Create graphs using existing graph, cloneable template or from existing sheet. | Download Batch Plotting app from the page and install the app. This App creates graphs with similar settings. Features include:
 | ||||||
Graph Maker | Create graph with grouped data interactively by drag-and-drop. | Download Graph Maker app from the page and install the app. This App provides a convenient way to transform your raw data related to adsorption isotherm into a linear dataset with various types of the model provided, and perform linear fitting with the new dataset.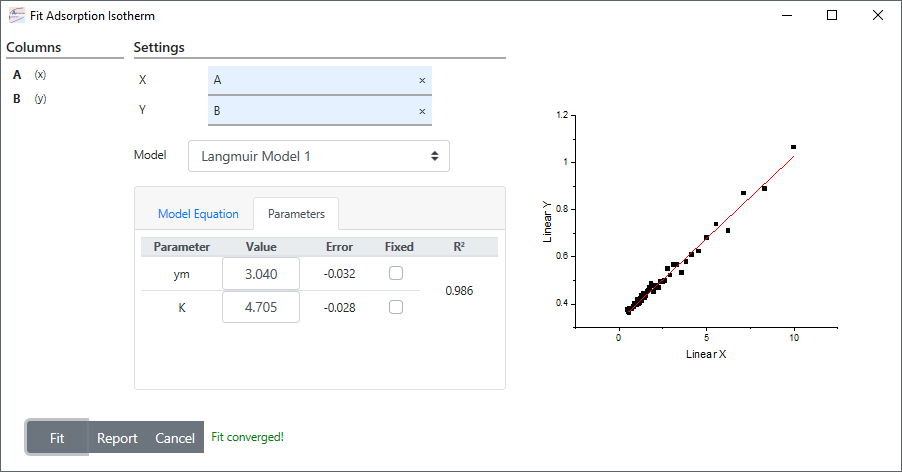 |
...
creates various graphs of grouped data by drag-and-drop columns. Features include:
 |
Data Handling
Importing Third Party Formats
ID | JIRA | Summary | Description | Details |
|---|---|---|---|---|
Import LSM |
Analysis
Fitting
ID | JIRA | Summary | Description | Details | ||
|---|---|---|---|---|---|---|
15730 | Download Canonical Correlation Analysis APPS-714 | Canonical Correlation Analysis | Peak Deconvolution | Offer an intuitive and interactive interface to perform peak analysis. | Download Peak Deconvolution app from the page and install the app. Canonical Correlation Analysis app is used to measure the correlation between two multidimensional variables. It transforms them into two combinations of canonical variates by finding a set of linear coefficients. The coefficients are chosen so that they maximize the correlation between the two combinations of canonical variates. The number of canonical variates equals the smaller dimension of the two source variables. | |
1574 | Nonmetric Multidimensional Scaling |
| ||||
1575 | SVM Classification | Download SVM Classification This app is capable of performing peak analysis intuitively and interactively. It is able to define baseline, then detect the peaks, and fit peaks.  | ||||
0 | Global Fit with Multiple Functions | Perform global fit and share parameters for different functions. | Download Global Fit with Multiple Functions app from the page and install the app. This app is capable of performing global fit with multiple functions, and parameters can be shared across different functions.  | |||
0 | Image Object Counter | Object identification and measurement on image. | Download Image Object Counter app from the page and install the app. This app is capable of identifying the objects on image, together of measuring their characterics. Click the app icon to start this app by opening a dialog. Then load an image as source image (If the active window is image window, this active image is used as the source image for analysis.), and then insert operations by using the menu. You can also save or load the operations to or from a file. And after getting the target objects on image, you can output the measurement results of these objects.  | |||
0 | Design of Experiments | Design an experiment, fit a model to experimental data, and find best factor settings that optimize responses. | Download Design of Experiments app from the page and install the app. This DOE app helps you determine the relationship between factors affecting a process and the output of that process. You can use it to design an experiment, analyze experimental data and optimize output. Features
 | |||
Fitting Function Libray | Search, find and add fitting functions to Origin. | Download Fitting Function Libray app from the page and install the app. The purpose of this app is to allow Origin user search, find and add new fitting functions to Origin. Simply select the function and click a button to download the FDF file and add the function to Origin, then find and use it when perform fitting. This app will update the function list automatically if Origin provides some new functions even after installation.  |
Statistics
ID | JIRA | Summary | Description | Details |
|---|---|---|---|---|
Stats Advisor | Help you pick the most appropriate statistical tool that is best suited for your data, including the tests, the graphs, and the Apps. | Download Stats Advisor app from the page and install the app. If you are all new to Origin or are unfamiliar with the statistical procedures, this app could help you get started. Open the Stats Advisor App, you could see three column, including What do you want to do, Your options and Suggested feature(s).  | ||
Gaussian Mixture Models | Fit Gaussian mixture models and cluster test data. | Download Gaussian Mixture Models app from the page and install the app. This app can be used to fit Gaussian mixture model using EM method. Features include:
 |
Signal Processing
ID | JIRA | Summary | Description | Details |
|---|---|---|---|---|
0 | Align Peaks | Shift, scale and trim data to align various peaks. | Download Align Peaks app from the page and install the app. This app can be used to align peaks of spectra by shifting, scaling, clipping and inserting data.  | |
0 | Independent Component Analysis | Separate mixed signals into sub-components. | Download Independent Component Analysis app from the page and install the app. SVM ClassificationThis app can be used to perform the support vector machine algorithm for classification.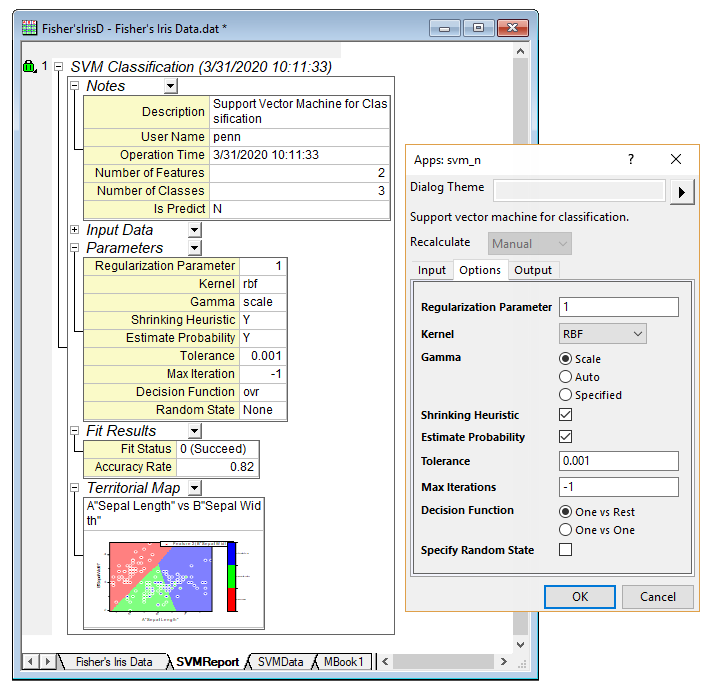 to decompose observed mixed signals into sub-components which are assumed to be independent from each other. Input data can be either columns or matrices. Three methods are supported:
|
Image Processing
ID | JIRA | Summary | Description | Details |
|---|---|---|---|---|
Origin 2018b
Graphing
Graph Types
ID | JIRA | Summary | Description | Details |
|---|---|---|---|---|
Data Handling
Importing Third Party Formats
ID | JIRA | Summary | Description | Details |
|---|---|---|---|---|
Analysis
Fitting
ID | JIRA | Summary | Description | Details |
|---|---|---|---|---|
0 | Rank Models | Fit and rank multiple functions to identify best fitting model. | Download Rank Models app from the page and install the app. This app can fit and rank multiple functions ito identify the best fitting model for your data. The app works for XY and XYZ data.  |
Statistics
ID | JIRA | Summary | Description | Details |
|---|---|---|---|---|
Signal Processing
ID | JIRA | Summary | Description | Details | ||
|---|---|---|---|---|---|---|
15760 | Download Modified Short-Time Fourier Transform APPS-860 | Modified Short-Time Fourier Transform | 3D Smoother | Smooth 3D data. | Download 3D Smoother app from the page and install the app. Modified Short-Time Fourier TransformThis app can be used to perform short-time Fourier transform with the window size fixed in the frequency domain, that is to use the concept of the short-time Fourier transform, but fix the window size in the frequency domain instead of in the time domain.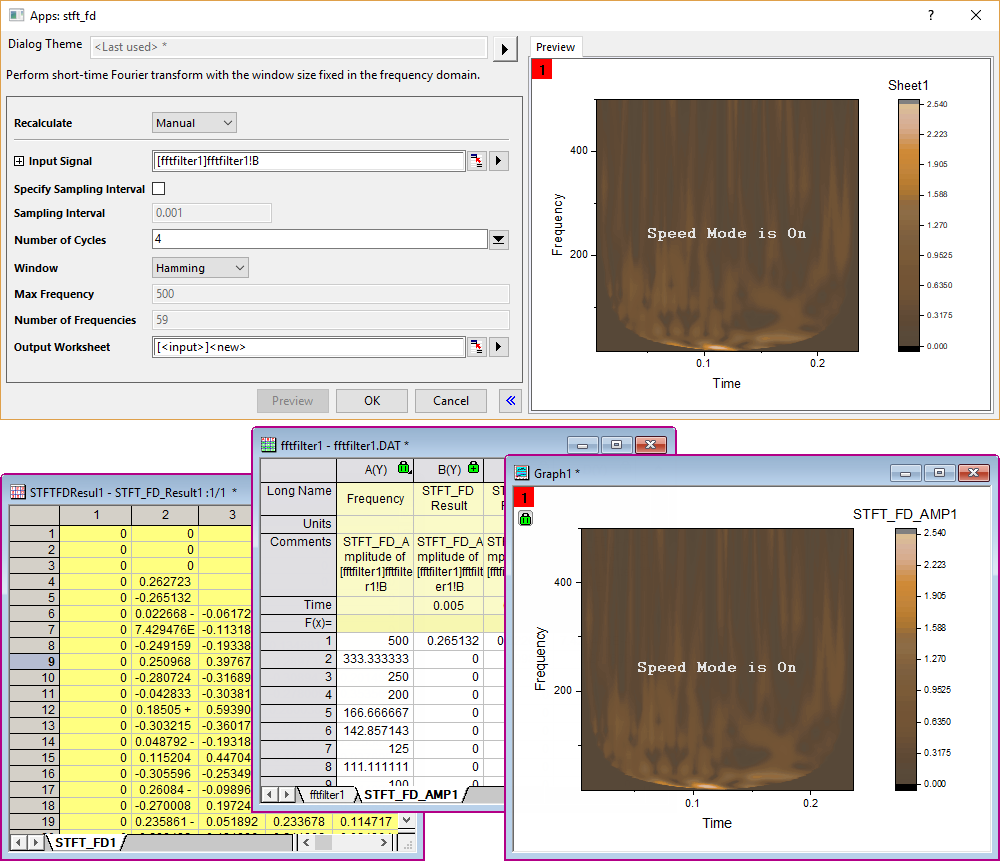 |
...
smooth 3D data from XYZ columns or a matrix. Features include:
 |
Image Processing
ID | JIRA | Summary | Description | Details |
|---|---|---|---|---|
Batch Processing
ID | JIRA | Summary | Description | Details |
|---|---|---|---|---|
0 | Distributed Batch Processing | Batch processing with multiple Origin instances. | Download Distributed Batch Processing app from the page and install the app. This app is capable of batch processing with analysis template using multiple Origin instances in background. Click the app icon to bring up the dialog, then provide the desired settings, and then click the Run button to start the batch processing. Note: there is a sample project together with this app. You can open the sample folder by right clicking on the icon of this app, and then choose Show Samples Folder from the context menu. In this folder, you can use the provided template and follow the note to get how to use this app.  | |
Toolbar Maker | Help to create simple and personal toolbar buttons that run script. | Download Toolbar Maker app from the page and install the app. Simply select an image for buttons, enter the tooltip, enter or copy-paste an existing LabTalk script, and click a button to generate a user-defined toolbar named Toolbar Maker.  |
Origin 2018
Graphing
Graph Types
ID | JIRA | Summary | Description | Details |
|---|---|---|---|---|
Data Handling
Importing Third Party Formats
ID | JIRA | Summary | Description | Details |
|---|---|---|---|---|
Origin Project Files
ID | JIRA | Summary | Description | Details |
|---|---|---|---|---|
0 | OPJ Searcher | Search the specified keyword in all the OPJs in the specified folder. | Download OPJ Searcher app from the page and install the app. This app is used to search for an OPJ file by identifying a keyword that is input into a search engine. All projects from a specified folder or subfolders that have that keyword are listed.  |
Analysis
Fitting
ID | JIRA | Summary | Description | Details | ||
|---|---|---|---|---|---|---|
15770 | Download Direct Linear Transformation APPS-813 | Direct Linear Transformation | Composite Spectrum Regression | Perform multiple linear regression for spectra. | Download Composite Spectrum Regression app from the page and install the app. Direct Linear TransformationThis app can be used to perform direct linear transformation to do camera calibration and reconstruct 3D coordinates of points by 2D coordinates.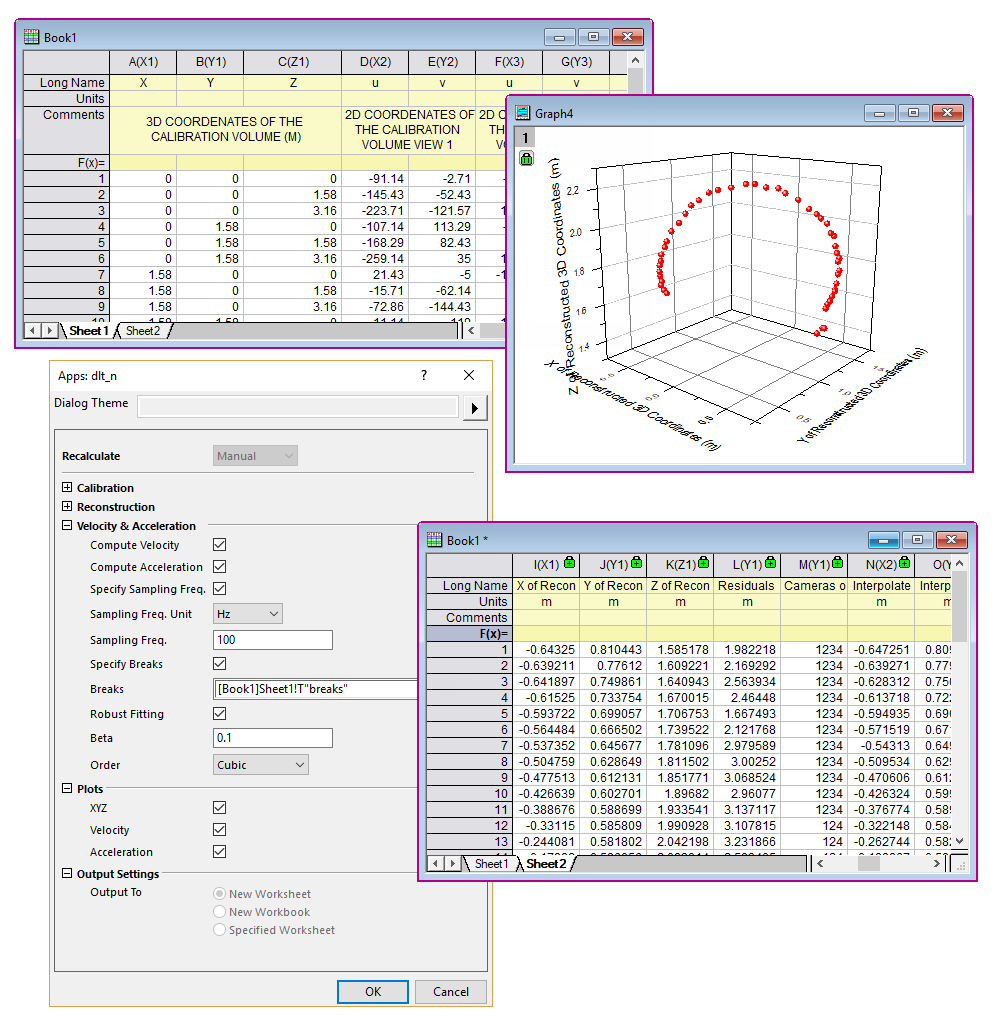 peform multiple linear regression of spectral data. |
Statistics
ID | JIRA | Summary | Description | Details |
|---|---|---|---|---|
Signal Processing
ID | JIRA | Summary | Description | Details |
|---|---|---|---|---|
Image Processing
ID | JIRA | Summary | Description | Details |
|---|---|---|---|---|