Analysis
Batch Processing
ID | JIRA | SUMMARY | DESCRIPTION | DETAILS |
|---|---|---|---|---|
0 | Allow importing data directly into embedded matrix in worksheet when performing batch processing | Allow importing data directly into embedded matrix in worksheet during batch processing | If the embedded matrix exits in the analysis template, batch processing support importing data or image to the embeded matrix. Besides, drag and drop to import data or image to opened analysis template is also supported. | |
0 | Batch Plot dialog now combines options for Book, Sheet and Column into one dialog | Batch Plot dialog now combines options for Book, Sheet and Column into one dialog | Batch Plotting GUI Improvements
  | |
0 | New App to distribute multiple files across multiple cores for faster Batch Processing | New App to distribute multiple files across multiple cores for faster Batch Processing | Select the Analyis Template and data files. Then specify how many cores to be used. The files will be distributed to multiple instances of Origin running on each core. App can be used to monitor progress. Once all tasks are finished, a consolidated summary report can be created with results from each core combined into one table. | |
0 | Save Batch Processing dialog settings into Analysis Template | Save Batch Processing dialog settings into Analysis Template | When using an Analysis template in Batch Process dialog, the batch processing dialog settings will be saved into the analysis template so that the next time this analysis template is loaded in Batch Process dialog, no need to set batch processing setting again. A system variable @bst is used to control the behavior. 0 : always no save settings; | |
0 | Some rule changes to batch processing | Some rule changes to batch processing for no dialogue and no interaction, | We tend to have no dialogue, no interaction, in batch process. So the rule of batch process now becomes to:
Once user make analysis template with import ASCII, that means the template is only used for ASCII file. If user want to it for other type file, they must import another file from MENU and save analysis template again. | |
0 | Support to add data from many sheets/books into a combined graph or an existing graph | Add data from many sheets/books into a combined graph or an existing graph |
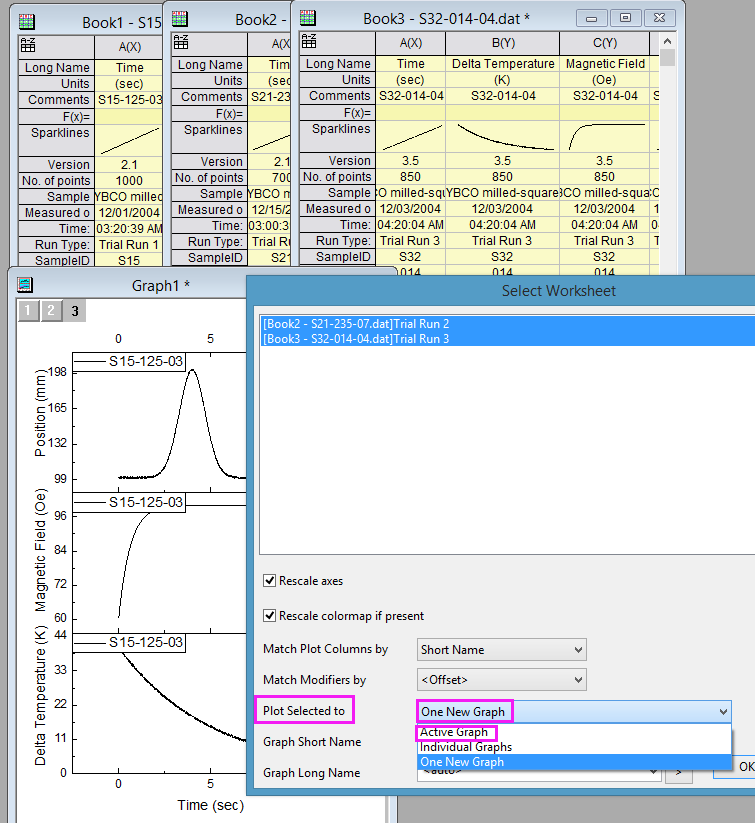 |
...
0 | ID | JIRA | SUMMARY | DESCRIPTION | Distributed Batch Processing | Batch processing with multiple Origin instances. | Download Distributed Batch Processing app from the page and install the app. This app is capable of batch processing with analysis template using multiple Origin instances in background. Click the app icon to bring up the dialog, then provide the desired settings, and then click the Run button to start the batch processing. Note: there is a sample project together with this app. You can open the sample folder by right clicking on the icon of this app, and then choose Show Samples Folder from the context menu. In this folder, you can use the provided template and follow the note to get how to use this app.  | |
|---|---|---|---|---|---|---|---|---|
0 | Toolbar Maker | Help to create simple and personal toolbar buttons that run script. | Download Toolbar Maker app from the page and install the app. Simply select an image for buttons, enter the tooltip, enter or copy-paste an existing LabTalk script, and click a button to generate a user-defined toolbar named Toolbar Maker.  |
Fitting
ID | JIRA | SUMMARY | DESCRIPTION | DETAILS |
|---|---|---|---|---|
0 | Fitting: Accuracy of p-value has been improved in nonlinear fit results. | Fitting: Accuracy of p-value improved in nonlinear fit results | Calculate the P value more accurately for tcdf and fdcf significance levels in Nonlinear Fitting Tools. Change code to calculate P value for tcdf and fcdf in fitting tools for significance | |
0 | Fitting: Standard error on derived parameters is now included in the parameter Summary table | Fitting: Standard error on derived parameters included in the parameter Summary table | Output the SE of derived parameter and in the Summary table. | |
0 | Fitting: Implicit Function now support Integral | Fitting: Implicit Function supports Integral | Support to define Implicit Function with integral in the Fitting Function Organizer and Fitting Function Builder | |
0 | Fitting: Sample Curve and Equation Preview images are included when transferring FDF files from older version. | Fitting: Sample Curve and Equation Preview images included when transferring FDF files from older version. | Transfer User Files tool can now transfer also (if present) the picture files for the formula (.wmf) and the picture files for the sample curves (*.cuv) with fitting function file (*.fdf). | |
0 | Fitting: Two new implicit fitting functions added for diode and solar cell data | Fitting: Two new implicit fitting functions added for diode and solar cell data | The SolarCellIV and ModDiode fitting functions are added in the Implicit Category. | |
0 | Support auto install of fitting function and origin template when installing opx | Support auto install of fitting function and origin template when installing opx |
| |
0 | Rank Models | Fit and rank multiple functions to identify best fitting model. | Download Rank Models app from the page and install the app. This app can fit and rank multiple functions ito identify the best fitting model for your data. The app works for XY and XYZ data.  |
General
ID | JIRA | SUMMARY | DESCRIPTION | DETAILS |
|---|---|---|---|---|
0 | Support Plot Range for Dataset Identifier for Gadgets | Support Plot Range for Dataset Identifier for Gadgets | Added option "Plot Range" in the Dataset Identifier drop down list in all gadgets which have the combo. | |
0 | Better hint indication when run Pro-only features in Regular version | Better hint indication when run Pro-only features in Regular version |
|
...
ID | JIRA | SUMMARY | DESCRIPTION | DETAILS |
|---|---|---|---|---|
0 | Signal Processing: Unit description added to metadata of STFT result | Signal Processing: Unit description added to metadata of STFT result | Support unit output in worksheet result of STFT. | |
0 | 3D Smoother | Smooth 3D data. | Download 3D Smoother app from the page and install the app. This app can be used to smooth 3D data from XYZ columns or a matrix. Features include:
 |
Statistics
ID | JIRA | SUMMARY | DESCRIPTION | DETAILS |
|---|---|---|---|---|
0 | Statistics: Frequency Count/Binning tool supports output format such as: 0-10, 10-20, etc. | Statistics: Frequency Count/Binning tool supports output format such as: 0-10, 10-20, etc. | 2D Frequency Count/Binning output sheet creates 4 type columns ahead with following LongName: Bins of A, Bin Beginnings of A, Bin Centers of A, Bin Ends of A and create 3 label row : Bin Beginnings of B, Bin Centers of B, Bin Ends of B. Frequency Counts output sheet creates 4 type columns ahead with following LongName: Bins, Bin Begin, Bin Centers , Bin Ends. | |
0 | Statistics: Hidden column will be ignored when computing statistics on rows | Statistics: Hidden column will be ignored when computing statistics on rows | Hidden column should be ignored if do statistics on rows and other statistics tools | |
0 | Statistics: PCA Loading plot and Biplot support improved plot labeling | Statistics: PCA Loading plot and Biplot support improved plot labeling | Principal Component Analysis: Loading plot and BiPlot use the latest design: plot label tab in Plot details dialog, and update Axis Labels "Principal Component 1" to be "PC1", add the value of "Percentage of Variance" to the Units label | |
0 | Statistics: Stats on columns and rows will carry over Units from the source datasets | Statistics: Stats on columns and rows will carry over Units from the source datasets | Statistics on columns/Statistics on Rows, the result value will carry the same Unit as the source datasets. |
...
ID | JIRA | SUMMARY | DESCRIPTION | DETAILS |
|---|---|---|---|---|
0 | ASCII Import: | In ASCII Import, Origin's auto determine header line may not work well for all user's data. | Origin's auto determine header line may not work well for all user's data. One example is user wants to import files by removing all lines that start with # character. In sush case, uncheck Auto Determine Subheader lines and then choose By Leading Character option and specify a leading char under Header Lines node in ImpASCII dialog. This option is also available on Header page of Import Wizard.  | |
0 | Improvements to labels in ASCII import dialog | Improvements to labels in ASCII import dialog | S1: Some label on ASCII dialog were changed: S2: Restrict editbox to allow single character input On Import Wizard dialog, Data Columns page, the "Other" editbox is not allowed to enter more than 1 char. |
...
ID | JIRA | SUMMARY | DESCRIPTION | DETAILS | ||
|---|---|---|---|---|---|---|
0 | Copy and paste entire worksheet across multiple Origin sessions. | Copy and paste entire worksheet across multiple Origin sessions. | Right-click on the sheet tab, two new context menu items are available.
Use Copy Sheet to copy current sheet with all information(including the header lines and structure) into the clipboard, and then use Paste as New Sheet to paste it as a new sheet from the clipboard into a new layer or new window. LabTalk command is also provided,
| |||
0 | Export ASCII to support ignore empty columns | Add a checkbox named as "Ignore Ending Empty Columns", to control ascii export, to ignore empty columns from the end. | Add a checkbox named as "Ignore Ending Empty Columns", to control ascii export, to ignore empty columns from the end, with the following options: 0 = no ignore (current way, default) 1 = ignore all empty columns after the last column with data, meta data not considered, and column with all missing values are considered empty. This is used only if export selection is not chosen. | |||
0 | Stack Columns tool check numeric for group identifier label row | In Stack Columns, choose a label row as Group Identifier, then Origin will check if all value is numeric and not set it as categorical in the result. | In Stack Columns, choose a label row as Group Identifier, then Origin will check if all value is numeric and not set it as categorical in the result. | |||
0 | Stack Columns tool will maintain column plot designation for Other columns | Keep column plot designation for other columns in the Stack Columns result. | Keep column plot designation for other columns in the Stack Columns result. | |||
0 | Support Excel column notation in condition string for Counif() function | For Averageif(), Countif(), and Sumif() function, you can use Excel column name in condition string argument in 2018b. | For Averageif(), Countif(), and Sumif() function, you can use Excel column name in condition string argument now. E.g,
Also, the performance of these functons is improved. | |||
0 | Support for custom formatting of User Parameter rows in Worksheet | From Origin 2018b, user is allowed to set data format for a Parameter row or a User-Defined parameter row. | From Origin 2018b, user is allowed to set data format for a Parameter row or a User-Defined parameter row. This option is provided in Worksheet Properties dialog. | |||
0 | Support more numeric format like Excel | Support more numeric format like Excel |
| |||
0 | Support more options when Copy Columns to | Support more options when Copy Columns to. | Copy Columns to is a useful way to copy columns from one sheet to other sheets and keep the linking. But some settings in source columns are not copied. Added in Origin 2018b.  |


Graphing
3D Graphs
ID | JIRA | SUMMARY | Description | DETAILS |
|---|---|---|---|---|
0 | 3D XYZ bar graph supports customization of individual bars | 3D XYZ bar graph supports customization of individual bars | Customize pattern, color and labels | |
0 | Added Connect Control for 3D Waterfall. | New connect line control for 3D Waterfall | Before Origin 2018b, 3d waterfall can only be plotted as straight lines. To have spline, etc., user had to plot as 2D Waterfall.  | |
0 | Improve preview of 3D OpenGL graphs in dialogs | Improved 3D OpenGL graph preview in dialogs | Better preview in our export graph dialog | |
0 | Support <end> as end of column/row for size, when creating virtual matrices | Support <end> as end of column/row for size, when creating virtual matrices | Add a context menu "Dynamic Ends" to the Plotvm dialog's Input node. When it is selected, virtual matrix's range will be expanded to both row&column ends. | |
0 | Support 2D annotation for 3D scatter plot. | Support 2D annotation for 3D scatter plot | ||
0 | Support more 2D arrow shapes in 3D graphs | Support more 2D arrow shapes in 3D graphs | ||
0 | Support total label for 3d stacked column/bar plots | Support total label for 3d stacked column/bar plots |
...
ID | JIRA | SUMMARY | Description | DETAILS | ||||||
|---|---|---|---|---|---|---|---|---|---|---|
0 | Better legend position when Fitting Layers to Page | Better legend position when Fitting Layers to Page | Add the option -L to the page -FLS command
| |||||||
0 | Customize Layer/Plot/Axes properties across all layers | Customize Layer/Plot/Axes properties across all layers | By checking what you want to customize together on Layers tab of Page level of Plot Details dialog, and then go to a layer to customize settings, all layers will be customized together.  | |||||||
0 | Easier notation for adding labels when merging multiple graphs, including support for Roman numerals | Easier notation for adding labels when merging multiple graphs | Set Label Text as Custom and click the dropdown list to see Custom notations. Notations can be combined, e.g. h$n$ to show #1, #2, .... a$ (default) – enumerate lower case letters Graph## – Graph01, Graph02, ... hsn$ means #1, #2, ....  Labtalk Script example: merge_graph labeltext:=custom labelcustom:=h$n$; Tip: Click the > button next to Dialog theme and choose Generate Script, executable Labtalk script will be created. | |||||||
0 | Easier way to show/hide error bars and data labels from Object Manager | Easier way to show/hide error bars and data labels from Object Manager |  | |||||||
0 | Enlarged graph using scale-in tool supports multiple overlapped layers | Enlarged graph using scale-in tool supports multiple overlapped layers | If layers are linked with 1:1 X axis and area, choose Scale In toolbar button and click in graph to create enlarged graph. Plots in all linked layers show in enlarged graph. | |||||||
0 | Fit all layers to maximum available page area, including option for margins. | Margin control to fit all layers in graph into page area nicely. | Margin control to fit all layers in graph into page area nicely. User stories:
 | |||||||
0 | Improve the assignment of columns to layers for multi-panel plots | Improve the assignment of columns to layers for multi-panel plots | When number of x cols <= number of layers, use x col as separator to plot into layers; When number of x cols > number of layers, pop up error message: When number of x cols > number of layers, pop up error message. Add X Column" to the "Group By" combo in Multiple Panels by Label tool dialog. For example, if data is organized as XYYYXYY and user asks for a 2-panel plot, the first three Y columns will be plotted in layer 1, and the last two Y colums will be plotted in layer2. | |||||||
0 | Integrate Gadget now supports marking of Fill Area under multiple curves | Integrate Gadget now supports marking of Fill Area under multiple curves | ||||||||
0 | Keep Aspect Ratio check box at Page level, to resize page | Keep Aspect Ratio check box at Page level, to resize page | This allows user to specify desired page width for publishing, and Origin can then scale the height accordingly to keep the aspect ratio, if this check box is checked. All elements in the graph will be scaled such that they "appear" the same in the final graph in terms of relative dimensions such as font size etc. MAY NOT work fully yet for elements such as color scale, and for 3D graphs.  | |||||||
0 | New LT command to force all layers to have scale factor fixed but keep the look | New LT command to force all layers to have scale factor fixed but keep the look | Select menu Graph: Fix Scale Factors...to open dialog, and you will allow to set all layers to fixed scale factor value and maintain current look.   LabTalk command is also available, | |||||||
0 | Page size change to keep same look | Page size change to keep same look | Automatically scale all elements similar to the work with fix scale factor. System variable @PSM controls the minimum change to trigger size update. Set @psm=100, elements will not resize when changing page size. | |||||||
0 | Rename Plot Groups instead of just using g1, g2, ... in Object Manager | Rename Plot Groups instead of just using g1, g2, ... in Object Manager | Right click g1, g2, ... node in Object Manager to give a meaningful group name. Such group name will show in
| |||||||
0 | Support for grouping and ungrouping of data plots in Object Manager | Support for grouping and ungrouping of data plots in Object Manager | In Object Manager,
 | |||||||
0 | Support Tagging Sheet as Exclude from Plotting Dialog | Support Tagging Sheet as Exclude from Plotting Dialog | Some users have a lot of worksheets in project. And it's hard to select which sheet to plot. In Origin 2018b, User can exclude some worksheets from showing in Plot Setup and Layer Contents dialogs by right clicking worksheet(s) and tag as "Exclude from Plotting Dialogs".  |

...
ID | JIRA | SUMMARY | DESCRIPTION | DETAILS | ||
|---|---|---|---|---|---|---|
0 | OC: Added a parameter for specifying the title of dialog created by "okoc_folder_browser" | Added a parameter for specifying the title of dialog created by "okoc_folder_browser" | Added a new parameter "lpcszInitTitle" to the OC function okoc_folder_browser, and the new parameter is used to specify the title of dialog box, now the function is: int okoc_folder_browser(LPCSTR lpcszInitDir, StringArray* saFolders, LPCSTR lpcszInitTitle) The new parameter "lpcszInitTitle" is used to specify the title of dialog box, and its default value is NULL. Example:
| |||
0 | OC: Better default for index in GetParameterResults | Better default for index in GetParameterResults | The default value of second parameter of OC function GetParameterResults() was changed to 0. | |||
0 | OC: function for Code Builder File Access | function for Code Builder File Access | Added a new OC function: BOOL CBFileOpen(LPCSTR lpcszFileName, LPCSTR lpcszSectionName=NULL, int nCntrl = CBF_OPEN); lpcszFileName: File path and name. lpcszSectionName: Specify a section you want to go. nCntrl:
| |||
0 | OC: Need better support for accessing embedded matrix via LabTalk and OriginC | Need better support for accessing embedded matrix via LabTalk and OriginC | Added a new OC function: int Worksheet::IsHolderSheet(PageBase& pg = NULL); Check if the Worksheet is embedded page. | |||
0 | OC: Access to get and set LabTalk LT properties of Origin Objects | Access to get and set LabTalk LT properties of Origin Objects | S2: Support accessing page properties by OC functions:Pagebase::SetProp() and Pagebase::GetProp(), for example:
| |||
0 | OC: Functions for Batch Plotting | Functions for Batch Plotting | Added three oc functions: 1. int GraphPage::CanDuplicate(int nWith = CAN_DUP_WITH_ANY); 2. int GetDuplicateWithCols(StringArray &saItems, DataPlot &dataPlot = NULL, int nModifier = PMMT_IGNORE); 3. int GetDuplicateWithBooks(StringArray &saItems, int nModifier = PMMT_OFFSET, int nMatchCol = MATCHCOLUMN_INDEX, int nMatchSheet = MATCHSHEET_INDEX);
|
...