...
| JIRA | Summary | Details | |||||
|---|---|---|---|---|---|---|---|
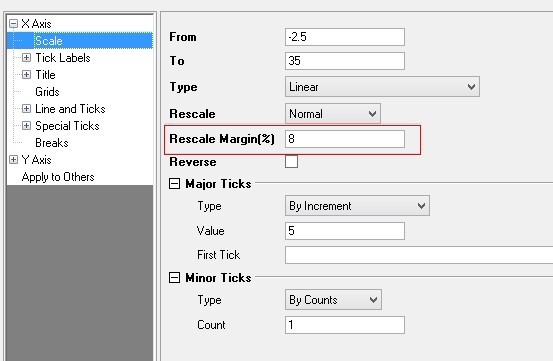
| ORG-9771 | Rescale Margin is added to Axis dialog | This edit box allows you to define the margin when you rescale the graph. The margin is defined by a percentage value you input, based on the distance between the data point with maximum value and that with minimum values along the axis direction. This control is also supported in polar axes (both angular and radial axis) and radar axis. But it is not supported for graphs created from a matrix.
| |||||
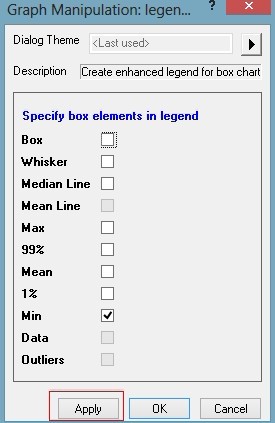
| ORG-9749 | Add "Apply" button in Box Chart Components Dialog | Apply button to review changes in graph.
| |||||
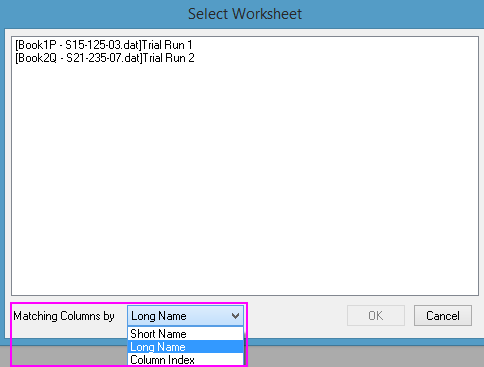
| ORG-9853 | Batch Plotting by Sheet/Books | Allow filtering similar sheets by column short name, long name or number of columns
| |||||
| ORG-2324 | Label color updates with associated data color when set Color to Auto |
| |||||
| ORG-9723 | Support Clipping for OpenGL XYY plot | When plot OpenGL xyy graph (e.g. waterfall plot), plots outside axis scale still showed. In SR1 it's fixed by supporting clipping.
|


...