Analysis
Fitting
ID | JIRA | SUMMARY | DESCRIPTION | DETAILS |
|---|---|---|---|---|
0 | Better support of doing fitting or peak analysis (including related gadgets) on Y offset plot. | Better support of doing fitting or peak analysis on Y offset plot | In the past, if user plot stacked lines with Y offset and then do fitting, the fitted curves are not stacked and stay with original plot. Improved in Origin 2019b.
| |
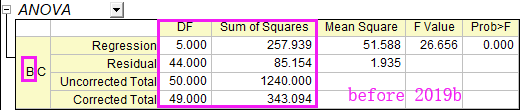
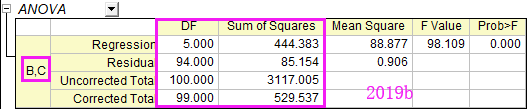
0 | Improve Statistics results for some special NLFit types | Improve Statistics results for some special NLFit types | For Nonlinear Multiple Dependent Variables Fitting, ANOVA table is improved. Before 2019b, ANOVA table in the report only shows the results for the first dataset(Dataset B in the following case). Now the result is improved and similar to Global Fit's result, DF and TSS should be total data.
For the Nonlinear Fitting using Orthogonal Distance Regression, R-Square quantity is improved. Before 2019b, R-Squared value may always be 1 though the ODR fit is normal. It is caused by the inappropriate TSS. Now the R-Square should be more accurate as TSS calculation is improved as: TSS = sum( (y - ymean)^2) + sum( (x - xmean)^2) |

General
ID | JIRA | SUMMARY | DESCRIPTION | DETAILS|
|---|---|---|---|---|
| 0 | Adjust height of worksheet label row for output columns | Adjust height of worksheet label row for output columns | After analysis is done, there are long column comments long names in output columns. In the past, we auto resized the column width to fit such info. In Origin 2019b, by default we adjust height of column label row to avoid very wide output columns. Use @RCW=1 to rollback the old behavior. |
Peak Analysis
...
ID
...
JIRA
...
SUMMARY
...
DETAILS
...
0
...
...
Integration Gadget: Set significant digits
...
Integrate gadget: Change the number of significant figures showing on top of the ROI box and output to Script window/Results Log

...
0
...
...
Peak Analyzer: Add Hints tab in Fit Control dialog
...
0
...
...
Peak Analyzer: Report Baseline Mode in Notes node
...

...
0
...
...
Peak Analyzer: Support output baseline subtracted peaks information after Finding Peaks
...
Statistics
ID | JIRA | SUMMARY | DESCRIPTION | DETAILS | |||
|---|---|---|---|---|---|---|---|
0 | Support Censor Mark in Survival Plot | Support Censor Mark in Survival Plot | Gel Molecular Weight Analyzer | Determine gel molecular weight from electrophoresis. | Download Gel Molecular Weight Analyzer app from the page and install the app. This app fits a standard curve to relate the known molecular weights of proteins in a set of standards (y-axis) to their relative migration (x-axis), and estimates molecular weights of unknow proteins. Features include:
| ||
| 0 | Fit ODE | Fit ordinary differential equation. | Download Fit ODE app from the page and install the app. This app is capable of fitting ordinary differential equation. | ||||
| 0 | Speedy Fit | Download Speedy Fit app from the page and install the app. This app can be used to fit a large number of datasets from a worksheet sequentially and speedily, and create a simple report table of parameter values and fit statistics. Features include:
|


General
ID | JIRA | SUMMARY | DESCRIPTION | DETAILS |
|---|---|---|---|---|
0 | Adjust height of worksheet label row for output columns | Adjust height of worksheet label row for output columns | After analysis is done, there are long column comments long names in output columns. In the past, we auto resized the column width to fit such info. In Origin 2019b, by default we adjust height of column label row to avoid very wide output columns. Use @RCW=1 to rollback the old behavior. |
Peak Analysis
ID | JIRA | SUMMARY | DESCRIPTION | DETAILS |
|---|---|---|---|---|
0 | Integration Gadget: Set significant digits | Integration Gadget: Set significant digits | Integrate gadget: Change the number of significant figures showing on top of the ROI box and output to Script window/Results Log
| |
0 | Peak Analyzer: Add Hints tab in Fit Control dialog | Peak Analyzer: Add Hints tab in Fit Control dialog | On Fit Peaks page of Peak Analyzer, if user click Fit Control button. There is Hint tab on bottom panel to help user customize settings. | |
0 | Peak Analyzer: Report Baseline Mode in Notes node | Peak Analyzer: Report Baseline Mode in Notes node | | |
0 | Peak Analyzer: Support output baseline subtracted peaks information after Finding Peaks | Peak Analyzer: Support output baseline subtracted peaks after Finding Peaks | Before Origin 2019b, the peak center result didn't have option to subtract baseline. A checkbox Output Baseline Subtracted Peaks is added on last page. |
Statistics
ID | JIRA | SUMMARY | DESCRIPTION | DETAILS |
|---|---|---|---|---|
0 | Support Censor Mark in Survival Plot | Support Censor Mark in Survival Plot | Choose menu Statistics: Survival Analysis: Kaplan-Meier Estimator You can select to mark censored values on survival plot not
|
Signal Processing
ID | JIRA | SUMMARY | DESCRIPTION | DETAILS |
|---|---|---|---|---|
0 | 2D Correlation Spectroscopy Analysis | Calculate synchronous and asynchronous correlation spectra. | Download 2D Correlation Spectroscopy Analysis app from the page and install the app. This app calculates synchronous and asynchronous correlation spectra from one set of dynamic spectra (homo correlation) or two sets of dynamic spectra (hetero correlation) induced by perturbation. | |
| 0 | Change Point Analysis | Detect single and multiple change points within data. | Download Change Point Analysis app from the page and install the app. This app can be used to detect single and multiple changes within a given time series or sequence. Features include:
|
Data Handling
Curve Handling
...
ID | JIRA | SUMMARY | Description | DETAILS |
|---|---|---|---|---|
0 | Plot Heatmap from XY column or XYZ Columns | Plot Heatmap from XY column or XYZ Columns | If XY columns is selected, Origin will open dialog for user to specify binning and counts to plot heatmap. If XYZ columns are selected, dialog will open for user to specify binning, data identifier for Z, quantities for Z, etc to plot heatmap. E.g.
| |
0 | Rugs Plot | Rugs Plot |
| |
0 | Split Heatmap | Split Heatmap |
| |
| 0 | 3D Wind Rose | Help to create a 3D wind rose graph | Download 3D Wind Rose app from the page and install the app. This app can help to create a 3D wind rose graph and to change the plot properties like number of grids, direction labels, sphere scale and orientation easily. |


Layer and Plot Management
...
ID | JIRA | SUMMARY | DESCRIPTION | DETAILS |
|---|---|---|---|---|
0 | Font control for Notes window | Font control for Notes window | Change Font and Font Size from Format toolbar for Notes window. It applies to all Notes window. | |
0 | Reset all dialog custom positions on new Origin session | Reset all dialog custom positions on new Origin session | There are cases user moved some dialog, script window, etc. to other location .e.g. another monitor and when restarting Origin, user couldn't find them. So in Origin 2019b, by default the dialog locations will reset. Set System variable @RDP=0 to go back to old behavior. |
Programming
Labtalk
ID | JIRA | SUMMARY | DESCRIPTION | DETAILS |
|---|---|---|---|---|
0 | Improvements on IF() and IFNA() functions | Improvements on IF() and IFNA() functions |
| |
0 | LabTalk command to clear imported data | LabTalk command to clear imported data | del -di: Delete imported data in current sheet | |
0 | LabTalk string function improvements | LabTalk string function improvements |
| |
0 | Multi-sheet range support | Multi-sheet range support | This is supported in many tools that supports multi-sheet range. E.g. if user wants to do statistics in same range of data on multiple sheets, user can specify the input as [book1](1:5)!1[89]:17[95]
| |
0 | New Object is wbook but can be abbreviated as wbk | New Object is wbook but can be abbreviated as wbk | ||
0 | New Switch for DOC command | New Switch for DOC command |
|
...
ID | JIRA | SUMMARY | DESCRIPTION | DETAILS | ||||||||||
|---|---|---|---|---|---|---|---|---|---|---|---|---|---|---|
0 | Allow OriginC VideoReader class in Origin Standard version | Allow OriginC VideoReader class in Origin Standard version | ||||||||||||
0 | Improve GraphLayer::AddPlot to support some important plot type | Improve GraphLayer::AddPlot to support some important plot type | GraphLayer::AddPlot supports more plot type, IDM_PLOT_INDEX_COLOR, IDM_PLOT_INDEX_SIZE, IDM_PLOT_INDEX_SIZE_COLOR, etc. | |||||||||||
0 | Improvement on Project class | Improvement on Project class |
The following will get empty for Untitled, and if has path, will not have last backslash
This is mainly to allow easy changing code to generate the tree for Origin Connector, which orglab is making the call to get display tree.
| |||||||||||
0 | Include code supports more relative path in OC | Include code supports more relative path in Origin C | Support relative path for Apps folder in OC, for example, #include "file_in_Apps.h" // directly inside Apps folder #include "AppsSubDir\awesome.h" // a sub-folder named AppsSubDir inside Apps | |||||||||||
0 | OC GetN Auto checkbox Improvement | OriginC GetN Auto checkbox Improvement |
| |||||||||||
0 | OC to provide access to LabTalk LT properties on OriginObject | OriginC to provide access to LabTalk LT properties on OriginObject |
Example,
| |||||||||||
0 | OrgLab Worksheet::GetData() Inconsistent with Column::GetData() and MatrixObject::GetData() | Added the optional argument lowbound to the COM server's method Worksheet::GetData() | Added the optional argument lowbound to the COM server's method Worksheet::GetData(): OODL_PREFIX_METHOD(ODISPID_WKS_GETDATA) HRESULT GetData( | |||||||||||
0 | Support passing LT tree to OC function | Support passing LabTalk tree to OriginC function | Both Tree and TreeNode datatype are supported. Example, OC Code:
| |||||||||||
0 | Support to detect and let the dialog know when delete the GraphObject | Support to detect and let the dialog know when delete the GraphObject | Support dialog event ON_GROBJ_DESTROY(_fn) on graph object destroy. |
...