| Table of Contents |
|---|
...
| JIRA | Summary | Details |
|---|---|---|
| ORG-11356 | Better extra large icon images for folder, workbook, matrix, notes, excel book in Project Explorer | |
ORG-13960 | Flyout buttons on Toolbars more obvious | Before SR1 – Tiny, not obvious
In SR1 – More standard, easier to click on to expand
|
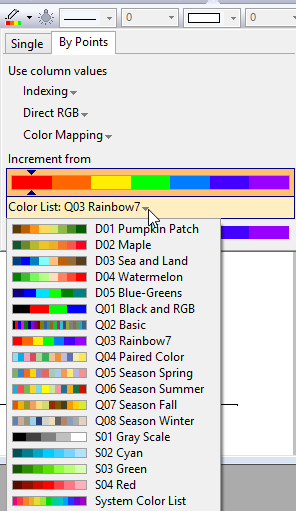
| ORG-13777 | Change Color List on By Points tab of Chooser Chooser | Before SR1, user must change color list on Color List tab of Plot Details if the plot color is set to incrementing or using other column values. In SR1, user can directly change Color List on By Points tab of Color Chooser.
|
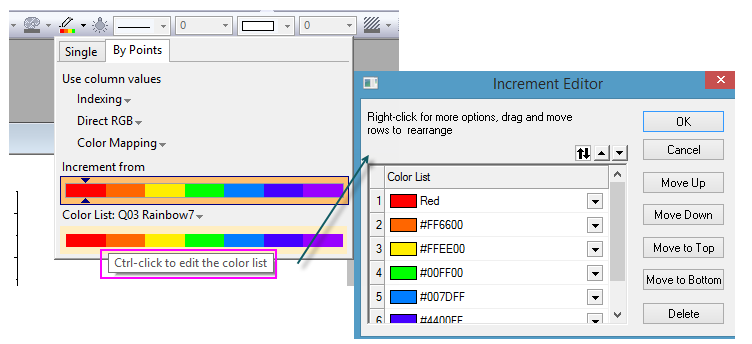
| ORG-13917 | Ctrl+ click Color List or Increment List in Color Chooser to edit color orders. | In SR1, user can click Ctrl+click Color List on By Points tab or Increment List on By Plots tab of Color Chooser to change the order of colors and save as future color increment list.
|


Graphing
Graph Customization
| JIRA | Summary | Details |
|---|---|---|
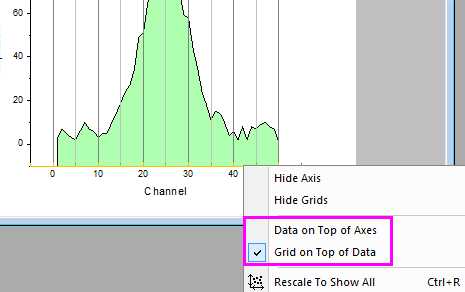
| ORG-13903 | Context menus on Axis to easily bring axis to front or push to back.
| By default data is drawn on top of axis. If user wants axis, ticks or grids to be on top of data, right click axis and choose the corresponding context menus. Before SR1, user had to go to Plot Details dialog; select the layer on the left and then go to Display tab to customize.
|
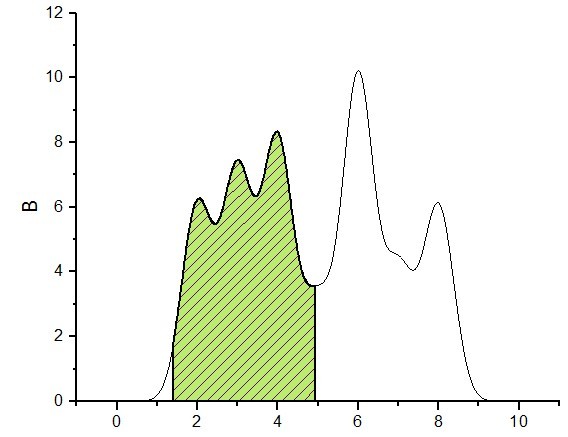
ORG-12862 | Support customizing shade made by Integrate gadget |
|
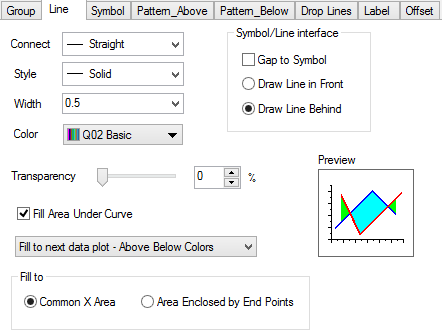
| ORG-3693 | Fill Area Enclosed by End Points option in Plot Details dialog | In SR1, when filling between two plots with different X ranges, user can choose Fill to Common X Area or Area Enclosed by End Points on Line tab of Plot Details dialog. Before SR1, default is fill to common X area. User had to use system variable @FAB=1 to fill to area enclosed by end points.
|
Plot Related
| JIRA | Summary | Details |
|---|---|---|
| ORG-13852 | Change group plot Edit mode in Object Manager | Before SR1, user must use Plot Details dialog to change group plot Edit mode to independent to edit each plot independently. In SR1, user can right click group e.g. g1 in Object Manager to change edit mode. |
| Delete key to remove data plot | Before SR1, user needs to use Remove context menu, Object Manager or some dialogs to remove data plot. In SR1, user can click on a plot and press Delete key to remove it. For group plot, whole group will be removed. Undo is supported. | |
| ORG-13935 | Copy and Paste Plot in Graph window.
| This is a nice way to do quick comparison of two plots. Example 1: Copy a plot from one graph to another graph.
Example 2: Copy fitted curves and paste on same graph. Then change parameters or input data to do quick visual comparison of fitted cuves.
|
| ORG-13935 | Copy two columns of numeric values from notepad or webpage and paste as plot in Graph window | It must be two columns of numeric data. 1st column will be treated as X and 2nd column will be treated as Y.
|
| ORG-14078 | Copy graph page and paste link to other graph window, layout, worksheet gray area | In SR1, after copying page, user can right click in another graph window, layout window, worksheet gray area and choose Paste Link context menu or Edit: Paste Link menu. Double click it will go to corresponding graph window to customize further. Changes in source graph will be updated in paste linked one. |
| ORG-13889 | Copy Plot as line object | User can right click a plot and choose Copy as Line Object. Then Ctrl+V to paste it in same graph or new graph. It will be pasted as a line object. This is another way to quickly compare two curves. User can also go to worksheet to paste the data behind the line object. |
| ORG-13889 | Create data from line/polyline/freehand line object |
|
| ORG-14118 | Right click on 2D function plot to create data copy of the function plot | Before SR1, after using File: New: Function Plot: 2D Function Plot menu or 2D Function Plot toolbar button to create a function plot, it took several steps to create the data copy of the plot. In SR1, just right click the function plot and choose Make dataset copy of Fn to create the dataset. User can also click Workbook button in Plot Details dialog to create the dataset. |
| ORG-13813 | Improvements on Extracted Contour Line output | More information in Output workbook.
|
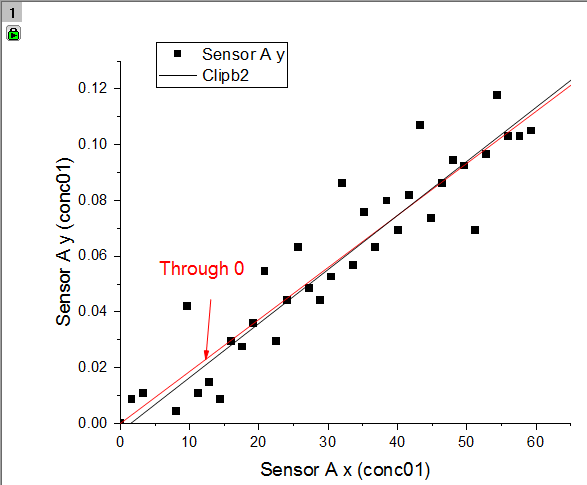
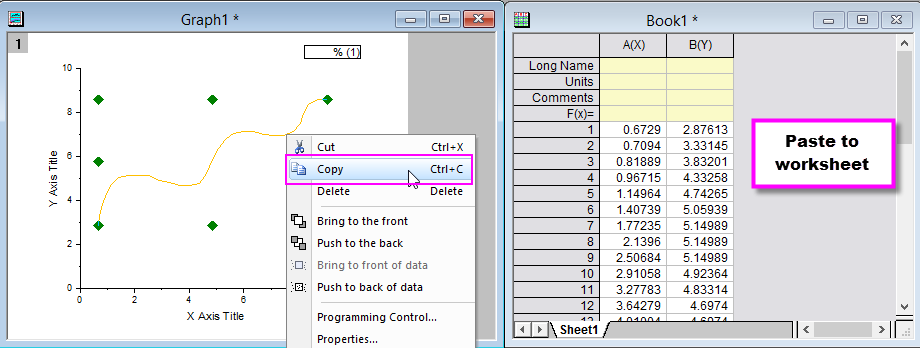
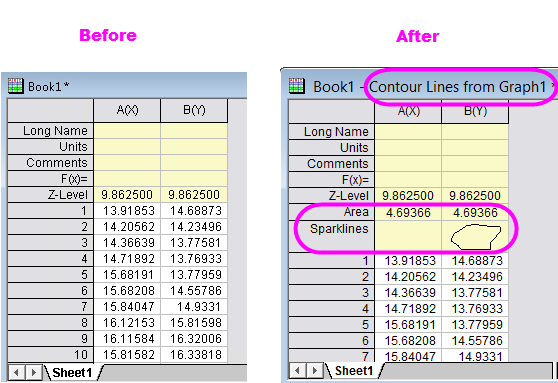
Image Profile
| JIRA | SUMMARY | DETAILS |
|---|---|---|
| ORG-13581 | Provide an option to output original x in profile lines for virtual matrix | For virtual matrix input, we add an drop down list Output Profile Data with two options: Same as Source and Uniform Linear |
| ORG-13576 | Button to Activate Profile datasheet in Contour Profile dialog/Profile Gadget | We Add a button to Image Profile/Contour Profile dialog: Go to Profile data. So when a graph is active, you can click the button and activate output dataset |
...
| JIRA | Summary | Details |
|---|---|---|
| ORG-13167 | Control Legend border line width on Style toolbar | 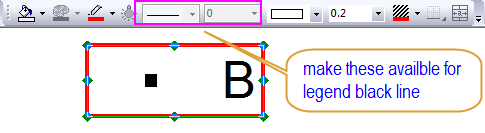 |
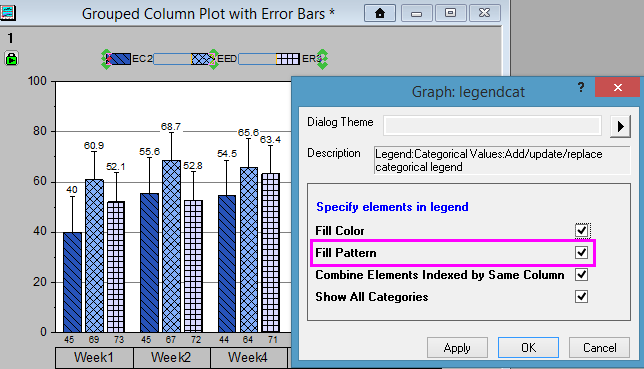
| ORG-13830 | Fill Pattern supported in Categorical Legend | Fill Pattern checkbox is added in Categorial legend dialog
|
Analysis
| JIRA | Summary | Details |
|---|---|---|
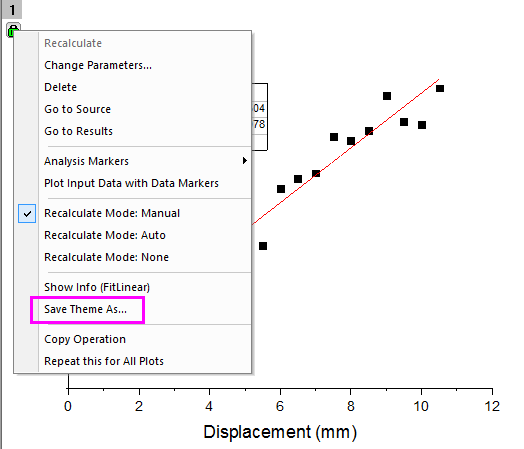
| Add Save Theme as... context menu when click on green lock | To save analysis dialog setting after an analysis is done, Left click on green lock and choose Save Theme as... context menu. In the past, user must choose Change Parameters to open the dialog and then save theme as.
| |
| Output Integration Area in Worksheet | When choosing Analysis: Mathematics: Integrate..., Integration Result checkbox is added in the dialog to put areas to worksheet. We used to output area in Results Log only. | |
| ORG-13916 | Smoothing effect in Preview of Peak Analyzer | Smoothing effect shows in Preview of Peak Analyser when setting Smoothing Window Size is not 0 when finding peaks. |
| ORG-14018 | Rank 3D function Models | Choose Input Data Form as XYZ Data and pick 3D functions to rank 3D functions in Rank Models tool
|
Worksheet
| JIRA | Summary | Details | ||||||||||||||||||||||||||||||||||
|---|---|---|---|---|---|---|---|---|---|---|---|---|---|---|---|---|---|---|---|---|---|---|---|---|---|---|---|---|---|---|---|---|---|---|---|---|
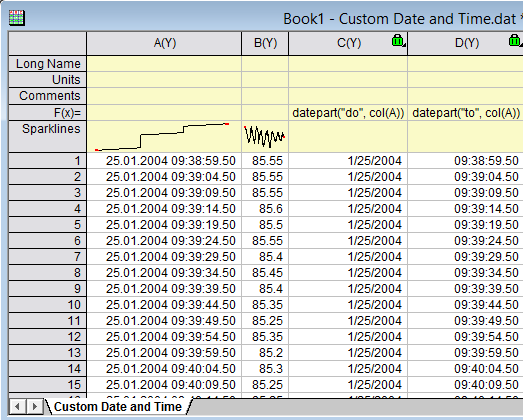
| ORG-14027 | LabTalk function DatePart (datepart$, d [, n]) to return a single part of a date/time, such as year, month, day, hour, minute, etc. n=0,1, 2, 3, which is meaningful only for weekday and week. (see WeekDay() for reference)
| Examples:
v=datepart("yyyy", dd); 2. If column A is date column, in Col(B), use Set Column Values dialog datepart("do", col(A)) //Get date part only datepart("to", col(A)) //Get time part only
| ||||||||||||||||||||||||||||||||||
| ORG-13950 | Improve the performance of Stack Columns tool | The performance has been improved a lot, about 120 times faster than before. |
...
| JIRA | Summary | Details |
|---|---|---|
ORG-13782 | Options to show label or value only in Statistics gadget | In the past, there is no option to show label only, or values only next to gadget. Added in sr1 now. 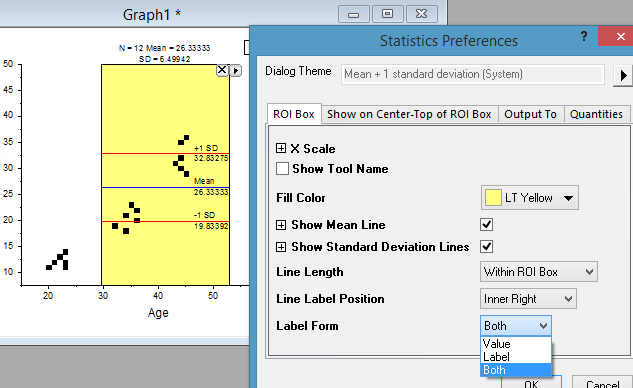 |
| ORG-13140 | Add more separate options for Label Box in Quick Fit Gadget | Added option to whether show Date&Time, Weighting info for Label Box in Quick Fit Gadget. |
...
| JIRA | Summary | Details |
|---|---|---|
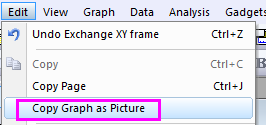
| ORG-10503 | Paste Graph as Picutre Only in Word, PPT, etc. | Edit: Copy Graph Picture menu is added. This allows user to copy an graph page and page it as image in Word/PPT.
|
Programming
| JIRA | Summary | Details |
|---|---|---|
ORG-13843 | For XFunctions, global switch to suppress warning or result type of messages is added | There was switches to suppress message of Error or Info types, but not for Warning and Results types. cd newpath:="D:\Temp"; // suppose there is a folder "Temp" is disk D, a message will be dumped to Script Window. We may add switch -sw to suppress warning message and -sr to suppress result message. cd -sr newpath:="D:\Temp"; //no message will be dumped.
|
| ORG-13574 | Support more basic OC functions for matrix |
BOOL GetSubMatrix( matrixbase & mbTarget, const vector<uint>& vnIndices, BOOL bRow = TRUE ) Can get some rows/cols from the matrix by indices that not need to be continuous. e.g. row 1,3,4,6. 2. Added an OC function. BOOL MeshGrid( const vector &vX, const vector &vY, matrix &mX, matrix &mY ) Repeat vectors vX, vY to form two matrices. |
...