TOP FEATURES SUMMARY
- The following table provides a summary of key new features with brief description, and where to find the feature.
- Look in sections further below for detailed feature notes.
| Feature | Brief Description | Where to find it in Origin |
|---|---|---|
| Data Connector |
|
For Data→Connect to Web..., there are sample URLs for various connectors. Click on the Recent URLs menu in the Connect to Web dialog to pick a sample URL. We have several blogs on data connectors: http://blog.originlab.com/category/origin-2019b CSV connect
Relative Data Source Path and Common Data Path:
LabTalk Access:
Book Level Import Command:
"doc -e LBC" to loop all sheets on book with Data Connector
Adding DC to workbook using LabTalk: newbook; |
| HTML Reports |
| Blog: http://blog.originlab.com/publishing/creating-html-reports-and-documents-in-origin-2019b With Notes window active, go to HTML→Load Samples menu. You will find both HTML and Markdown samples. NOTE: If you plan to write your own Markdown syntax, after opening a new Notes window, you need to right-click on title and select the Syntax→Markdown menu item. To switch between HTML and Markdown syntax, you need to first set to Text and then change to the other. When in Markdown mode, you include html syntax, such as for setting styles, or for advanced formatting not supported by Markdown. To view a sample OPJU showing HTML+Markdown reports: System variable to control using HTML or Markdown when pressing Ctrl+M @NPS=0; /// 0 means HTML, 1 means Markdown |
| Clone current Project |
| Menu: File→Clone current Project This new menu replaces the old menu items File→Save Project without Data... and File→Duplicate Project without Data... The cloned project can optionally maintain Origin Data Connector connections to the original file. |
| Exclude Imported Data when Saving Project |
|
Blog: http://blog.originlab.com/data-import/exclude-imported-data-when-saving-project |
Copy-paste Folders Copy-paste workbook | Copy an entire Origin Project Folder and paste it within the same project or even to another Origin session running on the same PC Copy workbook and paste n same session or another session. |
|
| Add Rugs to Axes | Add Rug marks to axes to indicate data density |
|
| Export Worksheet or Book to Excel File.. | Added support for exporting multi-sheet workbook as a multi-sheet Excel file. | File: Export: Excel Sheets can be excluded by right-clicking on tab and selecting "Exclude from Excel Export" context menu |
| Improved/Reorganized Menus | More first level menus to avoid too many entries in each menu
The Plot menu reorganization
Some context menu changes. |
|
| Import Speed Improvement | The speed of import ASCII and CSV is almost 50% faster. It also applies to CSV connector. |

Ease of Use
| JIRA | SUMMARY | DETAILS |
|---|---|---|
Main Menu Reorganization |
Workbook window active:
Graph window active:
Matrix window active:
Layout window active:
Notes window active:
No window active:
| |
| Plot Menu Reorganization |
| |
ORG-19335 S1 | Copy and paste folder in Origin |
|
| ORG-19335 S2 | Copy and paste workbook in Origin |
|
| Project name shows at the beginning of Origin title | The information in Origin2019b title bar ordered as Project name - Path - Current PE folder - Origin version - Bit - License Type If it's an unsaved new project, the order is Origin version - Bit - License Type - Untitled
| |
Show column list view of Workbook as tooltip when mousing over workbook in Project Explorer Set system variable @PEWP=0 to show regular view. |
| |
| Block docked windows to auto expand when mousing over it | Customer complained Project Explore, Messages Log, etc. windows auto show while he is trying use tools on Tools toolbar which System Variable @AHBC is added to control this.
| |
File:Clone Current Project ... |
| |
| Appending Projects Improvements | If user's projects
then when appending project files, and you choose No to not create subfolders for each project, all windows will be put together to current folder. | |
| HTML Report in Notes Window |
HTML field codes:
| |
| ORG-19156 | Recently Used Fonts | Recently used fonts show on the top of the font dropdown list Fixed some bugs when typing to find fonts |
| Font control for Notes window | Change Font and Font Size from Format toolbar for Notes window. It applies to all Notes window. | |
| Reset all dialog custom positions on new Origin session | There are cases user moved some dialog, script window, etc. to other location .e.g. another monitor and when restarting Origin, user couldn't find them. So in Origin 2019b, by default the dialog locations will reset. Set System variable @RDP=0 to go back to old behavior. | |
| Copy cell and paste to a range | E.g. Select A1 cell and copy (Ctrl+C). Select B1-B3 and paste. B1 -B3 will be filled with A1 value. Select A1 - A3 cells and copy (Ctrl+C). Select B1-B6 and paste. B1-B3 will be filled with A1-A3, B4-B6 will be filled with A1-A3. Set System variable @CPNB=0 to roll back to old behavior. | |
| Reorganization of some controls on Layer level of Plot Details dialog |
| |
| Group Folder Sharing Improvements |
| |
| Easier way to update all Apps to latest version | User can right click the Add Apps icon in Apps Gallery and choose Update All to updates all installed Apps to latest version.
| |
| Sort Apps in Apps Gallary | Sort apps by alphabetic order, newest, oldest
| |
| Support search in Template library | User can type keyword in upper-right corner of Template Library dialog to search for user-defined graphing templates. | |
| Plot: 3D: Parametric Surface menu to plot 3d parametric plot from data | Data needs to be organized in z, x, y, z(optional) matrix objects order in Matrix |


Graphing
New Graph Types
| JIRA | SUMMARY | DETAILS |
|---|---|---|
| ORG-19307 | Rugs Plot |
|
| Plot Heatmap from XY column or XYZ Columns | If XY columns is selected, Origin will open dialog for user to specify binning and counts to plot heatmap. If XYZ columns are selected, dialog will open for user to specify binning, data identifier for Z, quantities for Z, etc to plot heatmap. E.g.
| |
| Split Heatmap |
|


Graph Customization
| JIRA | SUMMARY | DETAILS |
|---|---|---|
| View: Show: Frame will add frame according to current bottom x axis settings | In the past when using View: Show: Frame to add layer frame, it was a non-customizable thin black line. In Origin 2019b, it will follow the bottom axis color and thickness, etc. | |
| Customize line segment remove line between two points on a line+symbol plot | Ctrl+double click the beginning point. In Plot Details go to Line tab and set Connect as No Line.
| |
| Add Include option for Common Display so adding layers, etc. will not affect existing layers. |
| |
| Use Number of X columns in worksheet to decide number of layers in Stack and Multi-Y Axes graph | Number of layers will be same as number of X columns in worksheet. E.g. data in worksheet is XY XYY XYYY, 3 layers will be created for each layer. In the past, 6 layers would be created, with one Y data in each layer.
| |
| Stack lines by Y offset by grouping information in column label rows | User can subgroup plots by column label row and offset them. After plotting all data, In Plot Details dialog, On Group tab, set Enable Subgroup by Column Labels On Stack tab of Layer level, select Constant or Auto radio button and choose Offset Between Subgroup (in Group tab) for Constant / Auto checkbox
| |
ORG-18844 S2 | Customize Histogram to show Relative Frequency or Density in each bin | Pick Relative Frequency or Density in Data Height dropdown list on Data tab of Plot Details dialog. Then customize Y axis tick labels to show percentage. #%
|
| Independent Transparency control for multiple patterns of one plot | The Transparency controls are on corresponding tabs in Plot Details dialog.
| |
| Independent Transparency of 2nd color in Gradient Fill | When user sets some pattern in graph to be gradient fill with two colors, for 2nd color, there is independent transparency control. This also applies to page and layer color with gradient fill.
| |
| Support line style customization for 3D vector graph |
| |
| Support highlight column in worksheet when highlighting plot on graph | Click on a plot in graph to select it, corresponding column is highlighted in workbook | |
Support Color list as Colormap Fill
|
| |
| Support same symbol edge thickness no matter symbol size big or small | In the past in bubble graph, edge thickness is based on bubble size so the bigger the bubble, the thicker the edge. In Origin 2019b, a checkbox Scale by Symbol Size is added to control it.
| |
| Blank circle in the middle of Polar graph | On Scale tab of Redial axis, there is a Center at % box. Set it can add circle from center of polar.
| |
| Showing Date and Time profile label in Contour Profile | If user's contour profile has X or Y axis with date or time, profile label will show so. In the past, Julian date was displayed. | |
| Updated Tick Label Custom Display examples when combining multiple @options |
| |
| Better handling of data point on the edge of layer frame | By default Clip Data to Frame is checked so data points outside layer frame are not be plotted. But this causes issue such as symbol, error bar and data labels on the edge of layer frame will show in half, error bar show in half or not showing. We improved it so that if the center of the point is around the edge of layer frame, show the data point, error bar and data label in full. System variable @PEC=0 by default. Set it to 1 to roll back to old behavior of strict clipping.
| |
| ORG-19776 | Do not show symbol for line if a special point is created from label | In the past, hold Ctrl to select label and move, examples as Graph Samples: Line and Symbol Graphs: Line and Symbol Graphs - B&W Line Plot in Learning Center, big dots are shown, in 2019b, it won't shown. |


Legend and Label Improvements
| JIRA | SUMMARY | DETAILS |
|---|---|---|
Legend notation for controlling column plot and text for column/bar kind of legend,
For text part of legend, adjust font size by a scaling factor. |
| |
| Double click text side of legend enters in-place edit mode with cursor blinking | In previous versions, because the legend box shrinked to show Origin syntax when double clicking legend, if you click on right side of text, the whole legend may be highlighted and if user pressed Delete key, all entries would be deleted. | |
Merge Graph Label Improvements
| In Merge Graphs dialog, go to Add Label node and set Label Text as Custom. Set Custom as %H. In merged graph, source graph names show as labels of each graph.
| |
Add label on specified indices for Waterfall 3 – 3rd data point position 0 - end point |
| |
| Support leader line to labels of 3D vector graph | ||
| Allow moving axis titles to corners (vertices) of the ternary |
| |
Support Data label for polar line plot | Plot polar line plot and open Plot Details dialog. There was no Label tab. Fixed in Origin 2019b. |


Import and Export
| JIRA | SUMMARY | DETAILS |
|---|---|---|
| ORG-15634 | Data Connector | Connect to various data types (CSV, JSON, OPJ, OPJU, Matlab, Excel, HTML Table, XML, etc.) from web or on hard-drive. One workbook can only connect to one type of data. Different sheet can connect to different file of that type
Icon is added to upper-left corner with context menu to change Data Source, select different node to import, exclude data when saving, reimport (Alt+4), etc. Exclude imported data when saving project to make project file size smaller.
|
| The speed of import ASCII and CSV is almost 50% faster | The speed is also faster when using CSV connector. | |
| Export Worksheet or Book to Excel File | File: Export: Excel menu is added to export multi-sheet workbook as a multi-sheet Excel file.
| |
| Replace existing data from Multiple files Importing | New option 3 is added to System Variable @ISE. When setting it to 3 and import multiple data files to a book with multiple sheet, no matter the sheet is empty or not, data will be imported to existing sheet first. Suppose there is a workbook with 3 sheets. There are data in them. Select 3 other files to import with Multi-file Import mode as Start New Sheet. Data will be imported to the 3 sheets, instead of creating 3 more sheet and import them. | |
| Smaller Dialog Height for Import Wizard in E and G Origin | Height of Import Wizard in E and G Origin is reduced from 688px to 600px. | |
| Copy graph and paste directly to online documentation tools | Ctrl+C or Ctrl+J and then Ctrl+V to online documentation tools, e.g. Confluence page, etc. System variable @CPGD 1: also copy dib — default | |
| Hide Import HTML Table from Data: Import From Files menu | impHTML XF is very similar to the HTML connector. So we hide it from menu. |


Worksheet
| JIRA | SUMMARY | DETAILS |
|---|---|---|
| Exclude Imported Data when Saving Project | With ANY data import (not just Data Connectors), user can opt to clear the imported data when saving project. This allows for your "analysis project" to stay small in size. You simply re-import the data, when needed, to perform further analysis
| |
| Allow Saving Workbook as Analysis Template even if no operation | E.g. The following dialog shows if there is no operation (e.g. Analysis, Statistics, Set Column Value calcualtions in workbook), asking user how to clear data in saved template
| |
| Filtering Columns based on Column Label Row | Show worksheet in Column List View (Ctrl+W or View: Column List View). Then add filter to the column that corresponds to the column label row.
You can then choose Ctrl+W to switch back to normal view.
| |
| More ways to Split Columns | Split Columns by a reference column is supported in Origin 2019b.
| |
| Use Column Short Name directly in Worksheet Query | To define conditions for worksheet query in the past, user had to use Alias in the past. In Origin 2019, user can directly use column short name. E.g. B="Drug 2" to find all rows with B column cell value "Drug 2"
| |
| Extraction of worksheet rows by Random sampling |
| |
| Reduce by Group should support X as Corresponding X | When reduce data by group, user can set merge X by X of Min Y or Max Y. So the output X will be X value of found Y.
| |
| Support recalculation in Split Worksheet | Auto recalculation wasn't supported for Split Worksheet tool till Origin 2019b. | |
| Support NOT logical operator in Column Filtering |
|


Analysis
| JIRA | SUMMARY | DETAILS |
|---|---|---|
| Better support of doing fitting or peak analysis (including related gadgets) on Y offset plot. | In the past, if user plot stacked lines with Y offset and then do fitting, the fitted curves are not stacked and stay with original plot. Improved in Origin 2019b.
| |
Adjust height of worksheet label row for output columns | After analysis is done, there are long column comments long names in output columns. In the past, we auto resized the column width to fit such info. In Origin 2019b, by default we adjust height of column label row to avoid very wide output columns. Use @RCW=1 to rollback the old behavior. | |
| Peak Analyzer: Support output baseline subtracted peaks information after Finding Peaks | Before Origin 2019b, the peak center result didn't have option to subtract baseline. A checkbox Output Baseline Subtracted Peaks is added on last page. | |
| ORG-19679 | Peak Analyzer: Report Baseline Mode in Notes node |  |
| Peak Analyzer: Add Hints tab in Fit Control dialog | On Fit Peaks page of Peak Analyzer, if user click Fit Control button. There is Hint tab on bottom panel to help user customize settings. | |
| Support 1.5, etc. in Multiple of SD in Mask Cells by Condition dialog | In the past, when choosing Condition as Outliers by Std. Deviation, the Multiple of SC can only be integers. | |
| Show All Info in One Label for Vertical Cursor | Use the button to toggle showing all info. in one label or individual labels.
| |
| Compare two vertical cursor | Use the button to add or remove 2nd vertical cursor.
| |
Cluster Gadget.: X at Min Y, X at Max Y, Y at Min X, Y at Max X are supported | In the past, depending doing statistics on X or Y, we only show the min and max values. In Origin 2019b, corresponding x or y info also shows. | |
| ORG-19337 | Statistics Gadget: More outputs: besides x at min/max y, SE, confidence bands, percentiles are supported as well. |
|
| Integration Gadget: Set significant digits | Integrate gadget: Change the number of significant figures showing on top of the ROI box and output to Script window/Results Log
| |
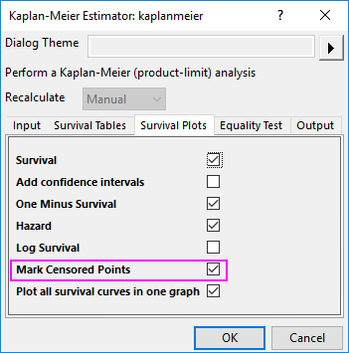
| Support Censor Mark in Survival Plot | Choose menu Statistics: Survival Analysis: Kaplan-Meier Estimator You can select to mark censored values on survival plot not
| |
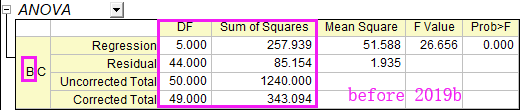
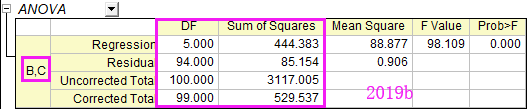
| ORG-19777 | Improve Statistics results for some special NLFit types | For Nonlinear Multiple Dependent Variables Fitting, ANOVA table is improved. Before 2019b, ANOVA table in the report only shows the results for the first dataset(Dataset B in the following case). Now the result is improved and similar to Global Fit's result, DF and TSS should be total data.
For the Nonlinear Fitting using Orthogonal Distance Regression, R-Square quantity is improved. Before 2019b, R-Squared value may always be 1 though the ODR fit is normal. It is caused by the inappropriate TSS. Now the R-Square should be more accurate as TSS calculation is improved as: TSS = sum( (y - ymean)^2) + sum( (x - xmean)^2) |


Programming
| JIRA | SUMMARY | DETAILS |
|---|---|---|
| Multi-sheet range support | This is supported in many tools that supports multi-sheet range. E.g. if user wants to do statistics in same range of data on multiple sheets, user can specify the input as [book1](1:5)!1[89]:17[95]
| |
| Improvements on IF() and IFNA() functions |
| |
| New Object is wbook but can be abbreviated as wbk | ||
| LabTalk string function improvements |
| |
| ORG-19719 | New Switch for DOC command |
|
| ORG-19719 | LabTalk command to clear imported data | del -di: Delete imported data in current sheet |
| ORG-19719 | Improvement on Project class |
The following will get empty for Untitled, and if has path, will not have last backslash string strProjPath = Project.GetPath(PROJ_PATH_NO_ENDING_SLASH|PROJ_PATH_UNSAVED_EMPTY);
This is mainly to allow easy changing code to generate the tree for Origin Connector, which orglab is making the call to get display tree. Tree tr; Project.GetTree(NULL, tr); out_tree(tr); |
| ORG-16946 | OC to provide access to LabTalk LT properties on OriginObject |
Example, void MyTest(int ntype = 0)
{
Worksheet wks = Project.ActiveLayer();
string strName;
double vv;
wks.GetProp("name", strName);
wks.GetProp("ncols", &vv);
printf("Current sheet is %s, contains %.0f columns.\n", strName, vv);
wks.SetProp("LongName", "My Data"); //set worksheet long name
string str;
if(0 == ntype)
wks.GetProp("dc.Source", str);
else if(1==ntype)
wks.GetProp("dc.Path", str);
else
wks.GetProp("dc.Sel", str);
printf("Data Connector source: %s.\n", str);
}
|
| ORG-19681 | Support passing LT tree to OC function | Both Tree and TreeNode datatype are supported. Example, OC Code: #pragma labtalk(4)
int tt(Tree& tr, string strAppsPath)
{
Tree tr1;
if(!tr1.Load(strAppsPath))
return 1;
tr.Replace(tr1, TRUE, TRUE);
return 0;
}
#pragma labtalk(0)
LabTalk Script, Tree tr1; string strApps$="%@AOpxList.xml"; if(0==tt(tr1,strApps$)) tr1.=; |
| Code Builder Improvements for Apps |
| |
| Build new Python package OriginExt to access Origin functionality from external Python through COM. | OriginExt is a Python package that enables you to access Origin functionality from Python. OriginExt is built on Origin's COM/Automation interface that Python functions as the client application that connects with Origin. It allows exchange data back and forth between Python and Origin and can also send commands from Python to be executed by Origin. | |
| OrgLab Worksheet::GetData() Inconsistent with Column::GetData() and MatrixObject::GetData() | Added the optional argument lowbound to the COM server's method Worksheet::GetData(): OODL_PREFIX_METHOD(ODISPID_WKS_GETDATA) HRESULT GetData( | |
| OC GetN Auto checkbox Improvement |
| |
| Support to detect and let the dialog know when delete the GraphObject | Support dialog event ON_GROBJ_DESTROY(_fn) on graph object destroy. | |
| Include code supports more relative path in OC | Support relative path for Apps folder in OC, for example, #include "file_in_Apps.h" // directly inside Apps folder #include "AppsSubDir\awesome.h" // a sub-folder named AppsSubDir inside Apps | |
| Improve GraphLayer::AddPlot to support some important plot type | GraphLayer::AddPlot supports more plot type, IDM_PLOT_INDEX_COLOR, IDM_PLOT_INDEX_SIZE, IDM_PLOT_INDEX_SIZE_COLOR, etc. | |
| ORG-11262 | Allow OriginC VideoReader class in Origin Standard version |
Installation and Licensing
| JIRA | SUMMARY | DETAILED |
|---|---|---|
| Skip Reboot Dialog at end of QuietMode Install | In Config.ini file, QuietModeNoRebootDialog is added. If QuietMode and QuietModeNoRebootDialog are both set to 1, then after the end of installation, no Reboot PC page will show. QuietModeNoRebootDialog setting will be ignored if QuietMode isn't 1. |