!!!coming in the spring of 2018 .......
Tentative Top 10 Features
2018b Apps
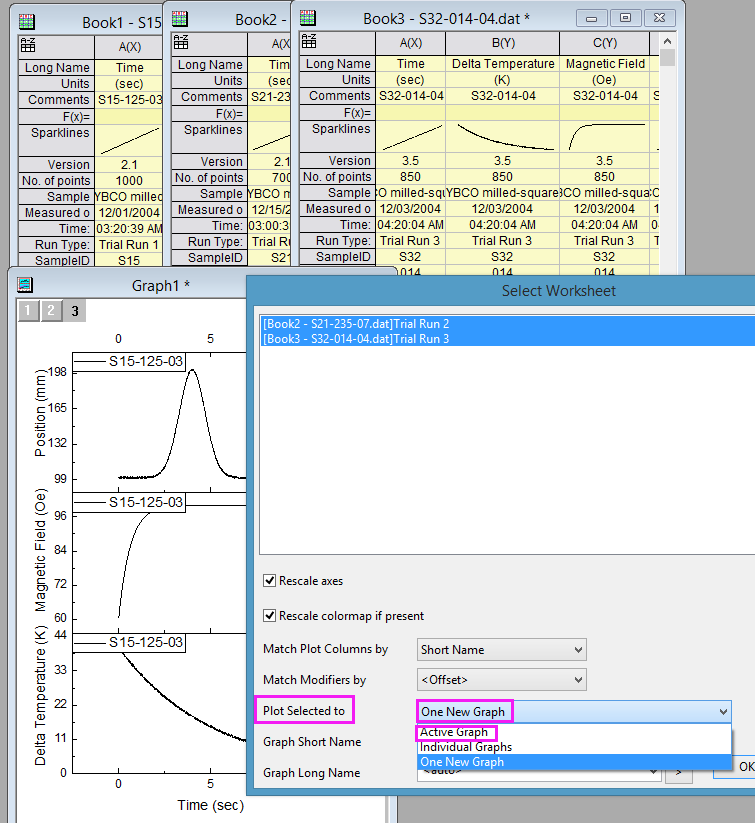
Data Visualization Improvements
- When selecting plot in graph, fadeaway effect on unselected data.
- When mousing over data points, data coordinates show and customizable.
- Context menu to go to corresponding row.??
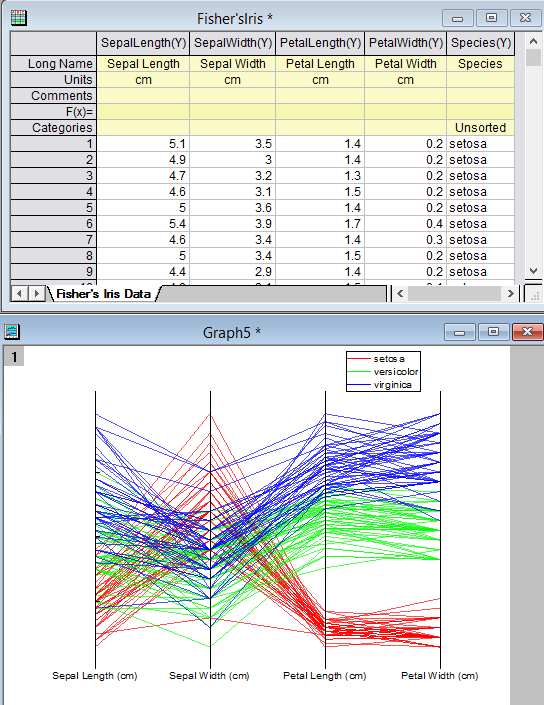
Parallel Plot
- support rescale each axis independently or together.
- curve the plots
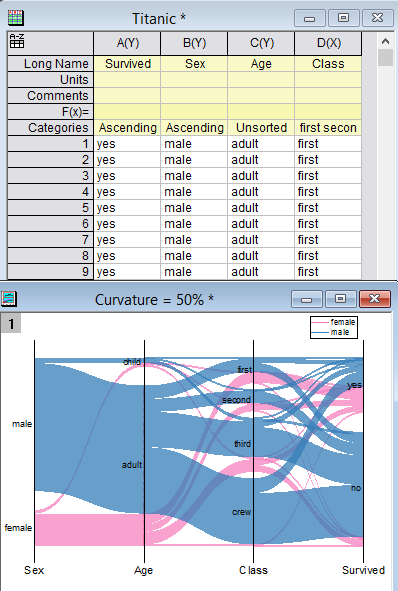
- Plot categorical data as Parallel set
Batch Processing – Parallel processing, Simple Version dialog
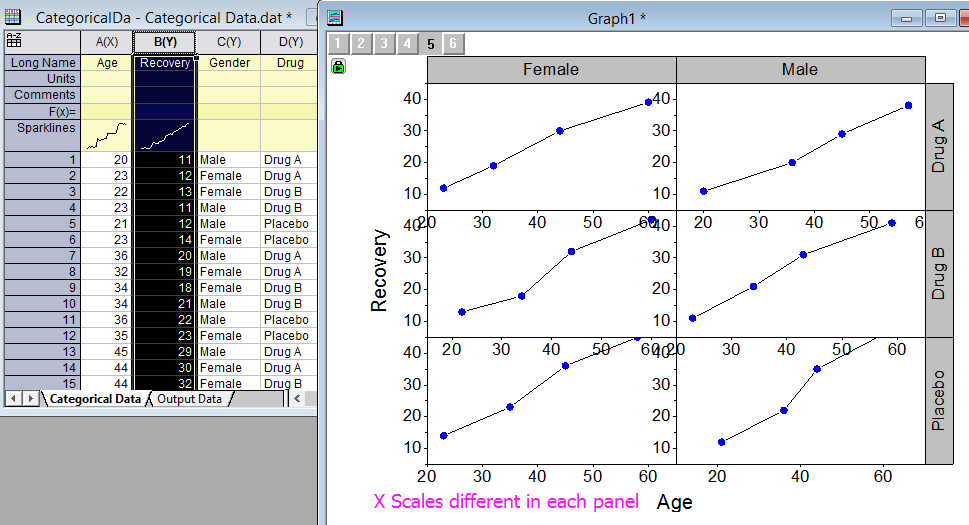
Group Plot to Multi-Panel with Different XY Scales
Python Improvement like Python IDE
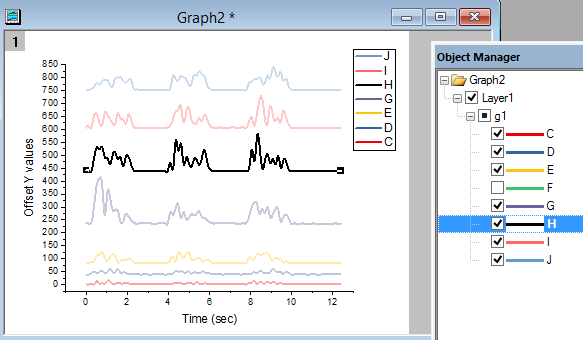
Batch Plot to existing graph or one combined graph