Polar Contour from Matrix with r and theta as X and Y

Sample OPJ to download to try:  Polar Graph.opj

 (ORG-8549)

In Origin9.1, user can plot a polar contour from matrix directly. The number of columns and rows in the matrix indicates the angular and radial axes scale of your plot.
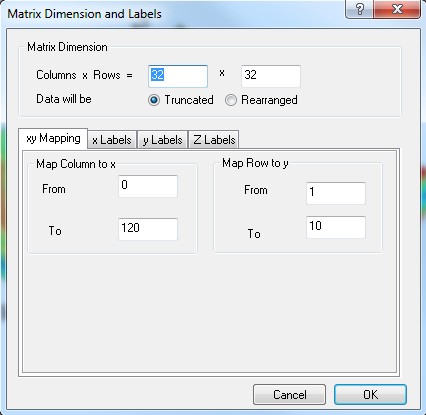
How to:

  1. In Matrix: Dimension and Labels: xy Mapping tab, set the number of columns and rows of the matrix. 
    Column indicates angle (in this example, 0~120); while row indicates radial range (1~10 in this example). 
  2. Input the matrix values, highlight all, and you can select Plot: Contour: Polar Contour theta(x)r(Y) to plot a polar contour directly.