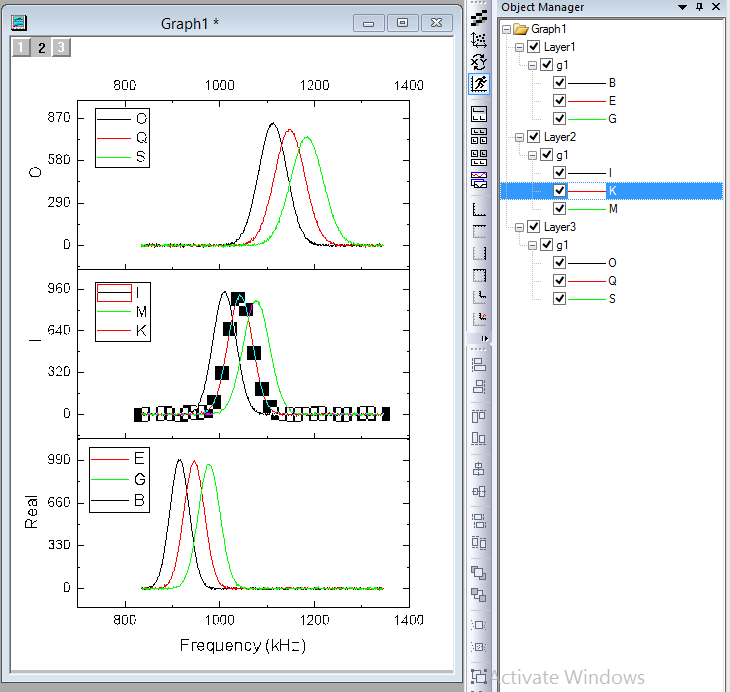
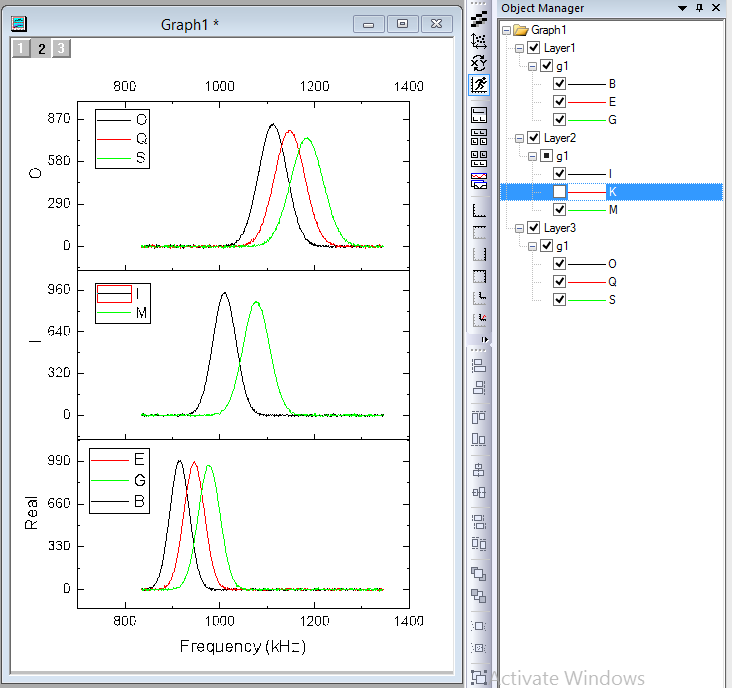
Dockable Object Manager to easily show or hide plots on a graph

ORG-10737

Video on YouTube

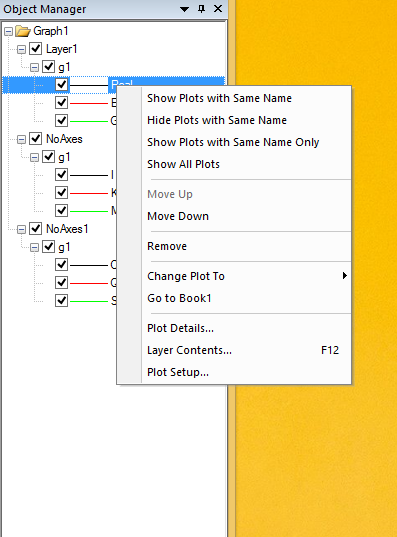
Hide and show plots using Object ManagerUseful context menu tools inside Object Manager
  • Select an element item in the Object Manager to select the corresponding element in the graph window and Vice Versa.
  • Show group level for the data plot if there is grouped data.
  • Show/hide plots by checking/unchecking the box before the object name. The object name corresponds to the legend name through translation mode.

  • Hide/Show a set of plots with the same name.
  • Change the order of plots in the same layer.
  • Change the plot style.
  • Go to Plot detail, Plot Setup, Layer Content from object manager.


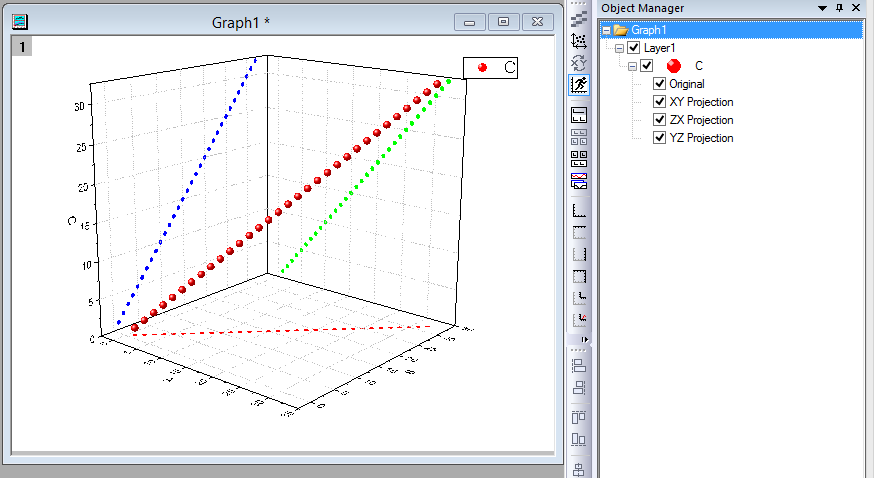
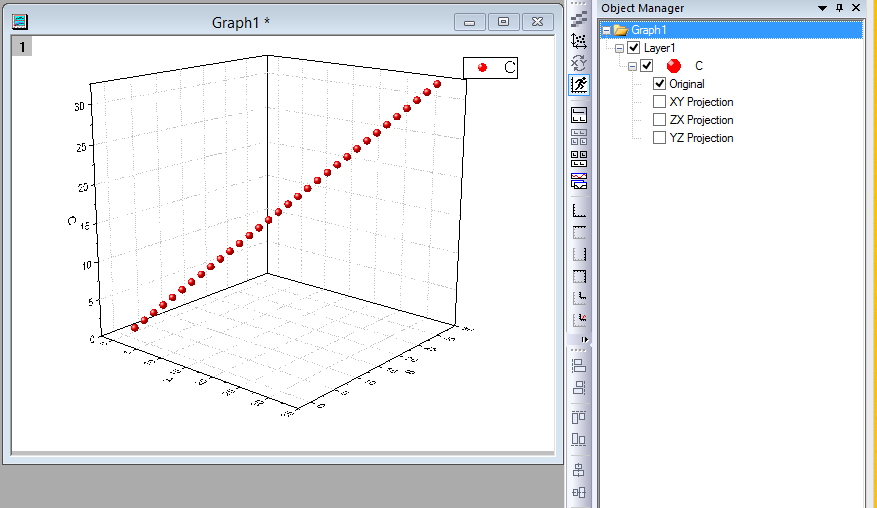
For 3D Scatter plots, XY Projection, ZX Projection, YZ Projection items are included in object manager as well.