ORG-6449
Origin 2016: Customize Plot Attributes by Column Labels
| Allow to customize the format of the annotation added to the plot. It is available for 2D XY plot and polar, and contour from both XYZ data and matrix. |
|---|
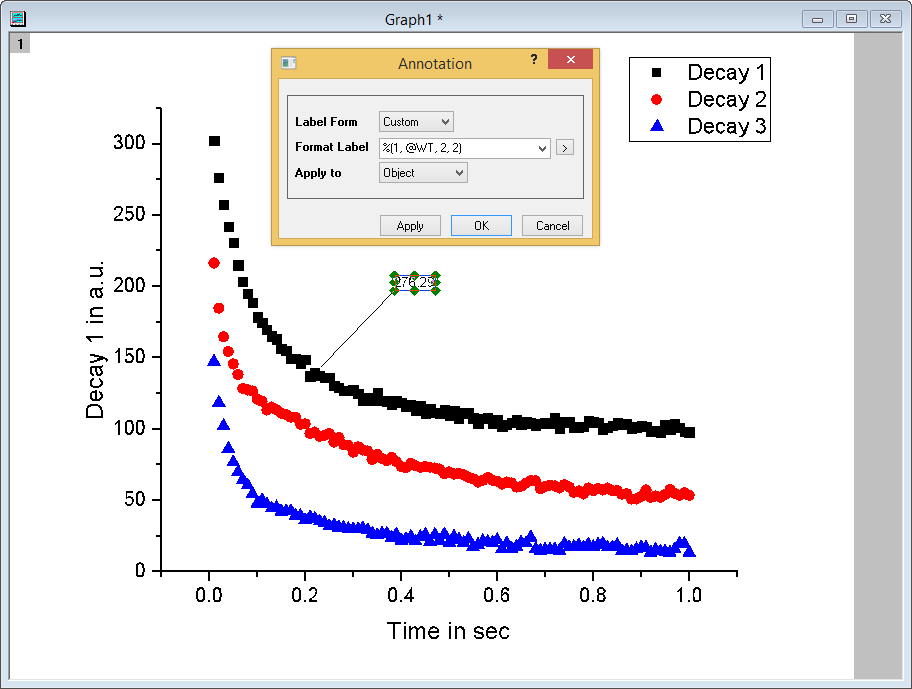
- Select an annotation object, right click and select Customize Label to open the Annotation dialog.
- in the Label Form we can specify the quantities or dataset used to create the annotation.
- If Custom is selected, Format label is opened up and format string/Labtalk scripts can be entered, and multiple notations and arbitrary fixed strings can be combined as desired. The > button lists the frequently used notations.
- Apply to can apply the format to the annotations of the current object, the objects in the current layer or all the objects inside the graph window.
|
 |