Skip to end of metadata
Go to start of metadata
You are viewing an old version of this page. View the current version.
Compare with Current
View Page History
« Previous
Version 7
Next »
Graph Types
ID | JIRA | Summary | Details |
|---|
1561 | APPS-890 | Correlation Plot |   |
| | | |
Data Handling
Analysis
Fitting
ID | JIRA | Summary | Details |
|---|
| APPS-810 | Linear Regression with Marginal Distribution | Download Linear Regression with Marginal Distribution app from the page and install the app. Linear Regression with Marginal Distribution app can create a report of linear regression, including a graph with marginal distribution.
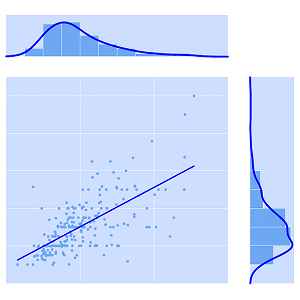 |
| APPS-841 | Standard Curve Analysis | Download Standard Curve Analysis app from the page and install the app. This app fits a standard curve like Concentration vs Absorbance. Such a curve can be used to determine concentrations in "unknown" samples with their measured absorbance. This method is commonly used to analyze RIA or ELISA Data.
 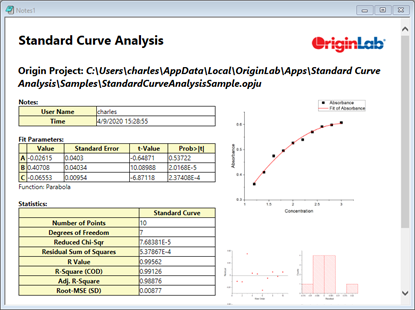 |
| APPS-795 | Linear Mixed Effects Model | Download Linear Mixed Effects Model app from the page and install the app. Linear Mixed Effects Model App fits a linear mixed effects model for data collected in groups. A mixed effects model consists of fixed effects and random effects. Fixed effects are conventional linear regression. Random effects have linear coefficients that vary with respect to one or more grouping variables.
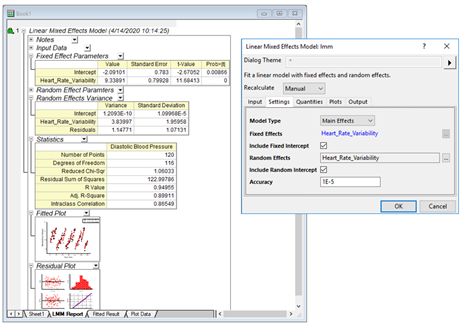 |
| | | |
Peak Analysis
Statistics
ID | JIRA | Summary | Details |
|---|
| APPS-714 | Canonical Correlation Analysis | Download Canonical Correlation Analysis app from the page and install the app. Canonical Correlation Analysis app is used to measure the correlation between two multidimensional variables. It transforms them into two combinations of canonical variates by finding a set of linear coefficients. The coefficients are chosen so that they maximize the correlation between the two combinations of canonical variates. The number of canonical variates equals the smaller dimension of the two source variables.
|
| APPS-822 | Nonmetric Multidimensional Scaling | Download Nonmetric Multidimensional Scaling app from the page and install the app. Non-metric multidimensional scaling (nMDS) is used to transform multidimensional data into lower dimensional representation. Bray-Curtis matrix is used as dissimilarity matrix.
|