Analysis
Batch Processing
...
ID | JIRA | SUMMARY | DESCRIPTION | DETAILS |
|---|---|---|---|---|
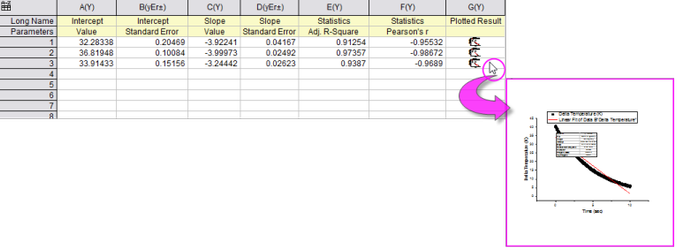
0 | Fitting: Add more Fit Statistics to fitting Result Table Quantities. | Add more Fit Statistics to fitting Result Table Quantities | In previous versions, some Fit Statistics were excluded from list of available Quantities in Table. More items are available in Origin 2018.
| |
0 | Fitting: FDF should include Category | FDF should include Category | Add new Category key to FDF General Information section.
| |
0 | Fitting: Fit until converged supports all datasets for multiple data | Fit until converged supports all datasets for multiple data | In Nonlinear Fit tools, add All option in the Select data to iterate drop-down list which allow to iterate on multi datasets at the same time. | |
0 | Fitting: Null hypothesis footnote is added under ANOVA table of Nonlinear Curve Fit, Multiple Regression, and Polynomial Fit report sheets. | Null hypothesis footnote is added under ANOVA table | Requested by customer. | |
0 | Fitting: Put all weighting methods in dropdown items for all input datasets | Put all weighting methods in drop-down items for all input datasets |
| |
0 | Fitting: Smarter Handling of NLFit X Data Type | Smarter Handling of NLFit X Data Type | When Iteration Algorithm is set as "Levenberg Marquardt" in Nonlinear Fit tools, Fitted Curves page, default X Data Type is changed as new method: Follow Curve Shape. (Note: except the Nonlinear surface/matrix fit tool) | |
| 0 | Composite Spectrum Regression | Perform multiple linear regression for spectra. | Download Composite Spectrum Regression app from the page and install the app. This app can be used to peform multiple linear regression of spectral data. |

...
ID | JIRA | SUMMARY | DESCRIPTION | DETAILS |
|---|---|---|---|---|
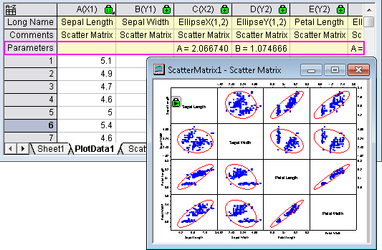
0 | Statistics: Add ellipse coefficient to correlation matrix | Add ellipse coefficient to correlation matrix | From Origin 2018, the major and minor radius of the correlation ellipse in Scatter Matrix are exported to the result sheet. No matter you create the Scatter Matrix from Plot: 2D: Scatter Matrix or Statistics: Descriptive Statistics: Correlation Coefficient, you can find the major and minor radius of each correlation ellipse by A and B values in the Parameters column label row of the PlotData worksheet, where A is the major radius and B is the minor radius.
| |
0 | Statistics: Add grouping support for Statistics on Rows. | Add grouping support for Statistics on Rows | Statistics on Rows now allows grouping based on values in a columns label row. For example, in below illustration, results will be grouped by values in the Long Name label row.
| |
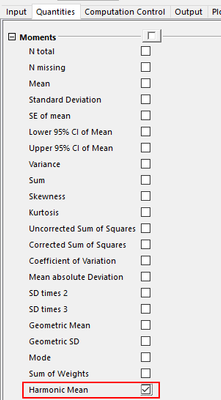
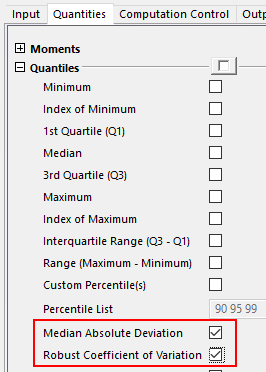
0 | Statistics: Add Median Absolute Deviation, Robust Coefficient of Variation and Harmonic Mean for Statistics on Columns/Rows tool | Add Median Absolute Deviation, Robust Coefficient of Variation and Harmonic Mean for Statistics on Columns/Rows tool | Statistics on Columns/Rows dialog adds below checkboxes:
| |
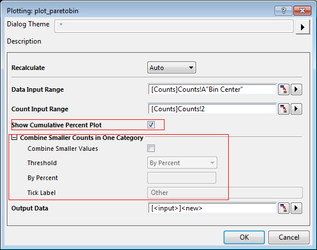
0 | Statistics: Add option of Exclude cumulative counts plot to Pareto chart dialog | Add option of Exclude cumulative counts plot to Pareto chart dialog | Add options to the Pareto Chart (Binned and Raw) dialog
| |
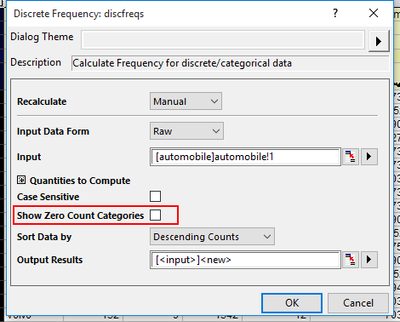
0 | Statistics: Discrete Frequency for categorical data needs to add zeros for if not found | Discrete Frequency for categorical data needs to add zeros for if not found | Discrete Frequency dialog adds a checkbox Show Zero Count Categories.
| |
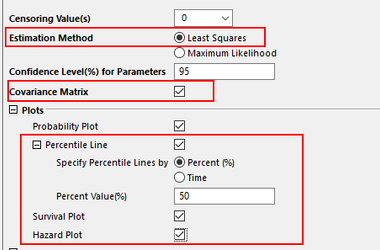
0 | Statistics: Improve Weibull Fit with RRX method and Add Plot for survival function and hazard function for weibull fit - Origin Pro | Improve Weibull Fit with RRX method and Add Plot for survival function and hazard function for weibull fit | Weibull Fit dialog adds below new items:
| |
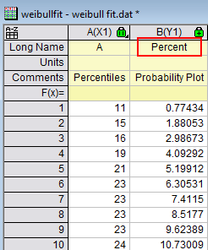
0 | Statistics: Rename Weibull Percentiles into percentages | Rename Weibull Percentiles into percentages | Weibull Fit tool's PlotData worksheet column label changed.
| |
0 | Statistics: Weibull Fit Calculate 100% Probability Which Can't Plot | Weibull Fit Calculate 100% Probability Which Can't Plot | Origin 2018 changed Weibull Fit tool's Score Methods from Kaplan-Meier to Benard, which also affects Distribution Fit tool's probability plot . |

Data Handling
ASCII Importing
...
ID | JIRA | SUMMARY | DESCRIPTION | DETAILS |
|---|---|---|---|---|
0 | Convert Origin to use Unicode for text and a new file structure for various Origin files including projects. | Convert Origin to use Unicode for text and a new file structure for various Origin files including projects. | File extensions are changed to: OPJU, OGWU, OGGU, OTWU,, etc. New structure allows file sizes to be reduced (sometimes greatly). It also allows files to be loaded more quickly. | |
0 | In the Projects tab, Origin projects that were modified and not actually saved can be reopened with the modifications in place via the Unsaved Files list. | In the Projects tab, Origin projects that were modified and not actually saved can be reopened with the modifications in place via the Unsaved Files list. | Even if the user chooses not to save a project file (OPJU), an autosaved OPJU will be kept for 7 days by default. If the user actually saves the project after modifying it, the unsaved version will be removed.
| |
0 | New Project File Extension for New File Format and File Dialog | New Project File Extension for New File Format and File Dialog | In Origin 2018, New File Extensions like OPJU, OGWU, OGGU, OTWU, etc are added to various opening/saving file dialogs drop-down lists. | |
0 | Support Preview and thumbnail file images in Windows File Explorer for Origin Files. (Toggle Windows File Explorer Preview pane using the Alt+Pkeyboard shortcut). | Support Preview and thumbnail file images in Windows File Explorer for Origin Files. |
| |
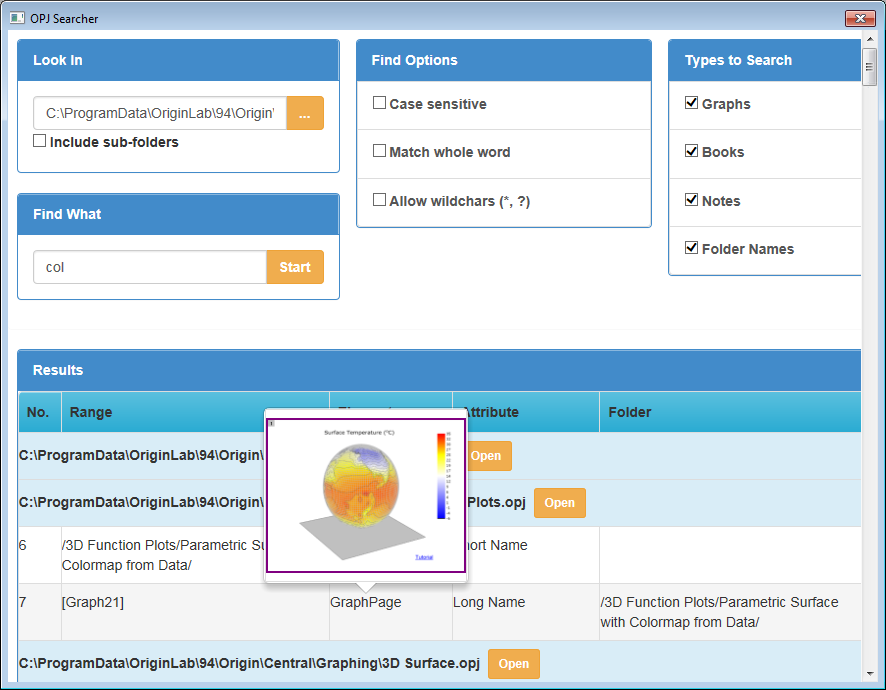
| 0 | OPJ Searcher | Search the specified keyword in all the OPJs in the specified folder. | Download OPJ Searcher app from the page and install the app. This app is used to search for an OPJ file by identifying a keyword that is input into a search engine. All projects from a specified folder or subfolders that have that keyword are listed.
|


...
ID | JIRA | SUMMARY | DESCRIPTION | DETAILS |
|---|---|---|---|---|
0 | Allow drag-and-drop to add dataset into the group of Stacked Column | Allow drag-and-drop to add dataset into the group of Stacked Column | In 9.4, it is not possible to adding a dataset into a Stacked Column by drag-and-drop. Now you can add new dataset into the group of Stacked Column/Bar plot by drag-and-drop. | |
0 | Column Gap control for Double Y Column Plot. | Column Gap control for Double Y Column Plot | For Double Y column plot, user can go to 1st plot's Spacing tab to set Overlap as a negative value to show some gaps between the the columns. There is no such control in Origin 2017 and earlier so the bars are always connected in the past.
| |
0 | Show Total Label on Stacked Column/Bar. | Show Total Label on Stacked Column/Bar | Show total value on stacked column/bar or 100% stacked column/bar.
|


...
ID | JIRA | SUMMARY | DESCRIPTION | DETAILS |
|---|---|---|---|---|
0 | Support no smoothing when set custom boundary for XYZ contour. | Support no smoothing when set custom boundary for XYZ contour | In Origin 2018, user can uncheck Smoothing checkbox when using Custom Boundary. Before Origin 2018, the checkbox couldn't be unchecked so there was always some smoothing effect. Workaround: Set system variable @tcs=0 to minimize the number of smoothing data points |
Customizing Color
ID | JIRA | SUMMARY | DESCRIPTION | DETAILS |
|---|---|---|---|---|
0 | Use Cluster tool to easily change part of plot to a different color. | Use Cluster tool to easily change part of plot to a different color | Cluster Gadget is improved so user can easily select a range of plot and color it. User can use cluster gadget to create group for the region of interest and check Color Data by Category. Then the region will be colored red. Open Plot Details, user can go to Color List tab to change color.
|

...
ID | JIRA | SUMMARY | DESCRIPTION | DETAILS |
|---|---|---|---|---|
0 | Better Hint and Examples in Update Legend dialog. | Better Hint and Examples in Update Legend dialog |
| |
0 | Control Decimal Separator for Labels & Annotations at Graph Page Level. | Control Decimal Separator for Labels & Annotations at Graph Page Level | In the past, this is a global control in Tools: Options dialog so user can not set different graph windows differently.
| |
0 | Customization symbol on left side of legend box. | Customization symbol on left side of legend box |
| |
0 | Easier way to turn on and off active dataset indicator (red frame) in Legend via: | Easier way to turn on and off active dataset indicator (red frame) in Legend | The red frame around plot part of legend is the activate dataset indicator. Analysis, etc. tools always work on active dataset by default. So it's useful to see it sometimes. The control to turn it on or off is hidden on Legends/Titles tab of Plot Details dialog in the past and hard to find.
| |
0 | GUI to Customize Symbols in Legend. | GUI to Customize Symbols in Legend |
| |
0 | Plot multiple line plots with colors mapped to a palette. Corresponding color scale shows in legend. | Plot multiple line with colors mapped to a palette and show color scale in legend | It was doable before Origin 2018 but needs a lot of steps.
| |
0 | Simplify Categorical Values Legend Dialog. | Simplify Categorical Values Legend Dialog |
The "Combine Elements Indexed by Same Column" checkbox is hidden and on so such elements will always show as combined in Legend. To bring back the old dialog, set system variable @LCC=1 and reopen the dialog. | |
0 | Symbol like legend for customized single point in line plot and line+symbol plot. | Symbol like legend for customized single point in line plot and line+symbol plot | Before Origin 2018, if user customized a single point in line graph, the symbol failed show in legend. If user customized a single point in line+symbol graph, the special point legend showed as line+symbol. In Origin 2018, both are supported. For line+symbol plot, if you want the single point legend show as line+symbol as before, set @lsl=0. | |
0 | Use One Legend Type Only and Auto Update | Use One Legend Type Only and Auto Update | Add a new menu option named Use One Legend Type Only and Auto Updateunder Legend context menu. When it's checked and select one type of legend in Legend context menu, all other types of entry will be deleted. When data point/data plot is added or deleted, the legend will be updated automatically. |


Theme and Template
ID | JIRA | SUMMARY | DESCRIPTION | DETAILS |
|---|---|---|---|---|
0 | Graph Theme support for Anti-Aliasing. | Graph Theme support for Anti-Aliasing | Before Origin 2018, there was Enable/Disable Anti-Aliasing toolbar button orpage.aa=1 property for user but it was tedious for user to do it for each graph. A built-in graph theme AntiAliasing.oth is added on Graph tab of Tools: ThemeOrganizer. User can apply it to existing graphs or set it as system theme for future graph creation.
|

...
ID | JIRA | SUMMARY | Description | DETAILS |
|---|---|---|---|---|
0 | Miscellaneous:Stop shipping MOCA files | MOCA files are not shipped together with Origin 2018. Contact us if you need to build your MOCA DLL. | MOCA files are not shipped together with Origin 2018. If you need to build your MOCA DLL, please contact us: tech@originlab.com | |
0 | Miscellaneous:Warning when opening an opj which version is higher than your Origin | When opening an opj/opju which version is higher than your Origin, a smart hint will show. | Implemented in Origin 2018. When opening an opj/opju which version is higher than your Origin, a smart hint show
| |
0 | Option to bring over 2017 Workspace and toolbar layout to Origin 2018. | When launching Origin 2018 for the 1st time, a messagebox will ask whether to copy over Origin 2017 workspace and toolbar layout. It can be reactivated by View: Toolbars > Reinitialize button. | When launching Origin 2018 for the 1st time, after specifying User Files Folder, a messagebox asks user if he/she wants to copy over Origin 2017 workspace and toolbar layout. Alternately, the user can go to View: Toolbars, click Reinitialize button to see the message again. | |
0 | Options to Transfer 2017 User Files. | When launching Origin 2018 for the 1st time, a message box will ask whether to transfer User Files from Origin 2017. Alternatively, it can be done by Tools: Transfer User Files... later. | When launching Origin 2018 for the 1st time, a message box will popup asking user if they want to transfer User Files from Origin 2017. If "No" is chosen, the user can later choose Tools: Transfer User Files... to transfer them. |
...
ID | JIRA | SUMMARY | DESCRIPTION | DETAILS |
|---|---|---|---|---|
0 | App Central Dialog. | New App Center dialog | The new App Center dialog (keyboard shortcut F10) centralizes App discovery, installation, without having to leave Origin and open a web browser (unless you choose to learn more about selected Apps).
| |
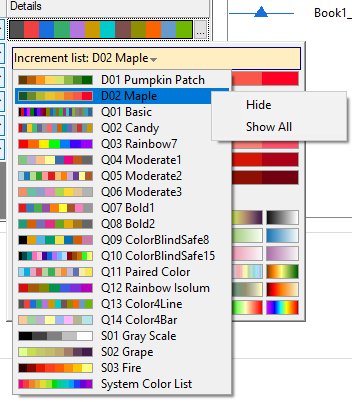
0 | Context menu to Hide Color List/Palettes and Show All to restore | Context menu to Hide Color List/Palettes and Show All to restore | Some of the color lists or color palettes may not apply to user. Then user can right click from the color list or palette list to hide it. Chose Show All to make hidden ones visible again. This also works for user-defined color list/palettes.
| |
0 | ORG-14339 S2 | Export Graph...menu shows under File: Export: if there is graph floating or embedded on active sheet. for example:. | Export Graph...menu shows under File: Export | Origin 2018, if there is embedded graph in workbook, Export Graph... menu shows under File: Export: In previous versions of Origin, the user needs to double-click on a floating or embedded graph prior to exporting it.
|
0 | Graph Samples tab is restructured and allow selecting a specific Plot Type category as well as keyword searching. | Graph Samples tab allows selecting a specific Plot Type category as well as keyword searching | ||
0 | Images in worksheet cells now be viewed as enlarged popups when running mouse over the cell. | View images in worksheet cells as enlarged popups when running mouse over the cell | For example, when mousing over the following cells, an enlarged popup image will be displayed.
A System Variable @CET is used to control the behavior: @CET=0, use default size of 250x250 @CET=1 to 29, disable this feature @CET > 30 is user defined size in pixel, scaled by DPI scale factor | |
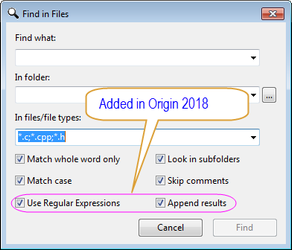
0 | Miscellaneous:Improve Find and Find in Files in Code Builder. | Improve Find and Find in Files in Code Builder | Support User Regular Expressions and Append results in Find in Files dialog of Code Builder.
| |
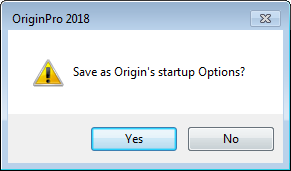
0 | Remove the "Yes-No" confirmation dialog about saving changes to "Tools: Options" modifications. | Remove the "Yes-No" confirmation dialog about saving changes to "Tools: Options" | After you make modifications in the Options dialog (accessible from menu Tools: Options) and click "OK" button, the changes will be saved directly WITHOUT the dialog to confirm.
| |
0 | Tooltip Improvements on Color related toolbars | Tooltip Improvements on Color related toolbars |
| |
0 | File: Export: As PDF File...menu added for worksheet | File: Export: As PDF File...menu added for worksheet | In Origin 2018, File: Export: As PDF File... menu is added. In previous versions of Origin, Export worksheet as PDF file is an option in File: Export: As Image File... dialog. But is not obvious. | |
0 | Insert non-keyboard Unicode characters similar to MS Word and other apps using 4-digit code and Alt+X keyboard combination. | Insert non-keyboard Unicode characters | To insert a character that is not supported by your keyboard, find the relevant 4-digit Unicode code via Google. Then, when in edit mode, type in the 4 digits and hit Alt+X to convert it to the actual character. Note: If the font for the location does not support the relevant character, it may not display properly even though the character is valid.
This feature works in:
| |
0 | Miscellaneous:Reminder Message about saving OPJ as OPJU | Reminder Message about saving OPJ as OPJU | When user opens an OPJ file and later Save As, by default the format is OPJU, and we should open a reminder message box to inform them earlier version of Origin will not be able to open such files and allow Cancel, so file not saved. |


Settings
ID | JIRA | SUMMARY | DESCRIPTION | DETAILS |
|---|---|---|---|---|
0 | Access to the Character Map in Worksheet cell edit mode. | Access to the Character Map in Worksheet cell edit mode | Double click a cell to enter the edit mode. Ctr+M or right-click and choose Character Map to insert symbol into cell using the font specified for the cell. The benefit of this is that it allows actual Unicode characters to be inserted into Label rows, rather than codes used in previous versions of Origin. Hence, then the values in Label Rows are displayed elsewhere, those Unicode characters will be used.
| |
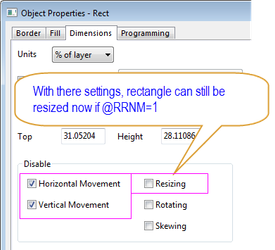
0 | Miscellaneous:Allow graph object to be resized programmatically when horizontal and vertical movement is prohibited in Object Properties dialog. | Allow graph object to be resized programmatically | Set system var @RRNM=1 to allow resizing when Disable Horizontal or Vertical Movement bits are set. (default is 0).
| |
0 | Increase the Maximum Undo times to 100. | Increase the Maximum Undo times to 100. | In Origin 2018, the default maximum number of Undos is set to 100. Before Origin 2018, it was 10 times. Corresponding system variable: @UN. |

...
ID | JIRA | SUMMARY | DESCRIPTION | DETAILS |
|---|---|---|---|---|
0 | ORG-14339 S3 | Improve LabTalk script to support exporting specified embedded graph(s) or graph sheet(s) during batch processing via Script After Each Process in Batch Processing dialog. | Support exporting specified embedded graph(s) or graph sheet(s) during batch processing | Example scripts: expGraph type:=pdf overwrite:=rename page:=2!; //sheet index |
0 | Labtalk: Better LabTalk access to plotting X-functions. | Better LabTalk access to plotting X-functions | The X-functions below can be run via LabTalk to create graphs.
For example: plot_gboxindexed irng:=col(A) group:=col(B) theme:="test"; | |
0 | Labtalk: Diff() function supports padding in the begin or end of range. | Diff() function supports padding in the begin or end of range | Add optional argument to current function: vec Diff(vec[,n]) //support length of vector is N For example: Suppose there are 10 rows in column A and Set Column Values of B as diff(A) – returns 9 numbers. No value in last row. | |
0 | Labtalk: LabTalk Command to convert OriginC C and CPP files to become OCZ for distribution. | LabTalk Command to convert OriginC and CPP files to become OCZ for distribution | Syntax for the conversion command is is file -ocz password srcpath destination; srcpath can have wildcard in file name, and in this case destination must be a folder location and destination files will use source file name and extension changed to OCZ. The Message Log will list each successful conversion and indicate at the end as "Done!" or "Failed!". If any errors occur, they will be displayed in a Messagebox. For example: file -ocz junk "%YOriginC\*.c??" "%Yabc" file -ocz "aB12#$" "%YOriginc\test.c" "%Yjunk.ocz" | |
0 | Labtalk: LabTalk Function for Data Range of Plot | LabTalk Function for Data Range of Plot | Add a new LabTalk function to get the data range of a plot in graph. Syntax: dataset plotdata(index, designation, x = 0, y = 0) //x&y refers to panel index. Also, two new LabTalk functions added to get the first point and last point of a plot. Syntax: double FirstPoint(vector vec); | |
0 | Labtalk: LabTalk Save command updated to support new file format | LabTalk Save command updated to support new file format |
Also, use option X to Save With Format Determined From Supplied File Extension. Following switches are supported, -ix, -tx, -dix. For example,
| |
0 | Labtalk: New X-Function wcellfmt added to set format of selected worksheet cells. | New X-Function wcellfmt added to set format of selected worksheet cells | Run wcellfmt -h; in Script window to see Help and examples. For example: The following example first uses wxt x-function to select all rows with B>0 and then set the fill color of the selected cells to green. | |
0 | Labtalk: Option to let graph source always plot all Y columns in worksheet. | Option to let graph source always plot all Y columns in worksheet | With graph window active, run layer.group1.AllCols=1; in Script Window. Then all Y data in the worksheet will be plotted and, as Y columns are added or deleted, they will be removed/added to the graph. Note: This only applies to worksheet with XYYY... plot designation. | |
0 | Labtalk: Support -mfph switch for LabTalk Create command to create a hidden matrix from 2D loose datasets for 3D parametric function plot. | Support to create a hidden matrix from 2D loose datasets for 3D parametric function plot | For example: create myx -fp2 50 u 0 1 50 0 1; | |
0 | Miscellaneous: LabTalk and OriginC string functions can now operate on UTF-8 encoded strings. | LabTalk and OriginC string functions can now operate on UTF-8 encoded strings | Origin 2018 is Unicode-based with UTF-8 as the encoding method. For details on how this changes both LabTalk and OriginC text string processing functions, see this blog post: |

...
ID | JIRA | SUMMARY | DESCRIPTION | DETAILS | |||
|---|---|---|---|---|---|---|---|
0 | HTML: Provide format option to convert variables in OC to string in html | Provide format option to convert variables in OriginC to string in html | Add a parameter in JSON.ToString( ), which converts variables in OC to string in html with full precision, to specify format
| ||||
0 | HTML:Change the z-index of controls | Change the z-index of controls | Enable popping up a message in an HTML dialog, it should be on top of graph control . Download the zip file below to see the sample codes | ||||
0 | HTML:HTML dialog support IE version checking | HTML dialog support IE version checking | All HTML dialog and HTML based App support IE version checking to avoid Javascript errors when IE Ver < 9 | ||||
0 | HTML:Show icon in the title bar of app dialog | Show icon in the title bar of app dialog | Two new member functions are added to OC Window class:
A new util function is also added to make it easier to set the icon from given icon file:
See below for the example of setting the icon of the HTML app dialog:
| ||||
0 | OC: Add rgb calculation functions to OC | Add rgb calculation functions to OriginC | Add two OC functions RGBtoHSL() and HSLtoRGB() to convert RGB to HSL and HSL to RGB | ||||
0 | OC: Additional dialog-related Win API functions | Additional dialog-related Win API functions | Support added for flashing dialog title bar, etc via the functions FlashWindowEx() and FlashWindow(). For example:
| ||||
0 | OC: Code Builder Should Handle UTF-8 files | Code Builder Should Handle UTF-8 files | Now Code Builder is able to handle UTF-8 files - loading, editing, saving, and debugging. | ||||
0 | OC: CreateGraphObject() provides an option to replace existing | CreateGraphObject() provides an option to replace existing | Add a bit, GROBJ_REPLACE_EXISTING,for CreateGraphObject() to replace existing
| ||||
0 | OC: DynaControl to Allow Multiple Controls in One Row | DynaControl to Allow Multiple Controls in One Row |
| ||||
0 | OC: OC to provide access to LabTalk LT properties on OriginObject | OriginC to provide access to LabTalk LT properties on Origin Object | 2018 will have general OC access to all the LT properties, this will include GraphObject, Column, Worksheet, etc
| ||||
0 | OC: Origin C compiler Must Handle UTF-8 Source Files | Origin C compiler Must Handle UTF-8 Source Files | In Origin 2018, we support executing UTF-8 files in Code Builder. 1. All code files (*.c, *.ogs etc.) Origin ships (so it is placed EXE folder) is kept as ANSI.
| ||||
0 | OC: Provide function to get the short description name of DataRange | Provide function to get the short description name of DataRange | Function below is added
|

...