Origin 2018 Features
Analysis
Batch Processing
ID | JIRA | SUMMARY | DESCRIPTION | DETAILS |
|---|---|---|---|---|
0 | Batch processing support XYZ columns, worksheets, and data ranges. | Batch processing support XYZ columns, worksheets, and data ranges. | 1.XYZ column support in both using existing xyz datasets or import from files. 2. Use existing worksheets support using any sheet from opj as input, if selected it will copy all columns to data source in analysis template.this options should be useful for statistics tools not require column designation. 3.Use Existing Ranges it will have two input range: Fixed Range and Batch Range, Fixed Range means those data which is fixed in each process. this options should be useful for statistics tools. | |
0 | Improvements to Batch Processing: | Improvements to Batch Processing | Mini tutorial:
How to include a graph image in each row or report sheet:
|
Fitting
ID | JIRA | SUMMARY | DESCRIPTION | DETAILS |
|---|---|---|---|---|
0 | Fitting: Add more Fit Statistics to fitting Result Table Quantities. | Add more Fit Statistics to fitting Result Table Quantities | In previous versions, some Fit Statistics were excluded from list of available Quantities in Table. More items are available in Origin 2018. | |
0 | Fitting: FDF should include Category | FDF should include Category | Add new Category key to FDF General Information section.
| |
0 | Fitting: Fit until converged supports all datasets for multiple data | Fit until converged supports all datasets for multiple data | In Nonlinear Fit tools, add All option in the Select data to iterate drop-down list which allow to iterate on multi datasets at the same time. | |
0 | Fitting: Null hypothesis footnote is added under ANOVA table of Nonlinear Curve Fit, Multiple Regression, and Polynomial Fit report sheets. | Null hypothesis footnote is added under ANOVA table | Requested by customer. | |
0 | Fitting: Put all weighting methods in dropdown items for all input datasets | Put all weighting methods in drop-down items for all input datasets |
| |
0 | Fitting: Smarter Handling of NLFit X Data Type | Smarter Handling of NLFit X Data Type | When Iteration Algorithm is set as "Levenberg Marquardt" in Nonlinear Fit tools, Fitted Curves page, default X Data Type is changed as new method: Follow Curve Shape. (Note: except the Nonlinear surface/matrix fit tool) | |
| 0 | Composite Spectrum Regression | Perform multiple linear regression for spectra. | Download Composite Spectrum Regression app from the page and install the app. This app can be used to peform multiple linear regression of spectral data. |
General
ID | JIRA | SUMMARY | DESCRIPTION | DETAILS |
|---|---|---|---|---|
0 | General: Ignore Hidden column/plots when choosing all columns or plots for analysis. | Ignore Hidden column/plots when choosing all columns or plots for analysis | A system variable, @AIP, is added to control whether ignore hidden column(s)/plot(s) or not when adding all as input(s) for analysis.
For example, if some columns or plots on a graph are hidden, when opening an analysis dialog that supports multiple inputs and the user chooses All Colu | |
0 | General: Set Default Digits for individual types of analyses. | Set Default Digits for individual types of analyses | Prior to Origin 2018, there is only global control of display digits via Digits in Report in the Numeric Format tab of Tools: Options. In 2018, users can specify default Default Digits to apply for different types of analyses. For example: After an analysis is done, right click in the table in the result sheet and choose Digits... Set the Digits values and check Save as Default. The default will apply to other instances of that particular analysis operation in the future. To reset back to system default: Close Origin. Go to User Files folder and delete Defaults.XML. |
Peak Analysis
ID | JIRA | SUMMARY | DESCRIPTION | DETAILS |
|---|---|---|---|---|
0 | Peak Analysis: Automatically set Area/Amplitude boundaries based on Peak Finding Direction. | Automatically set Area/Amplitude boundaries based on Peak Finding Direction |
|
Statistics
ID | JIRA | SUMMARY | DESCRIPTION | DETAILS |
|---|---|---|---|---|
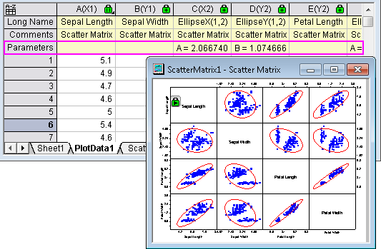
0 | Statistics: Add ellipse coefficient to correlation matrix | Add ellipse coefficient to correlation matrix | From Origin 2018, the major and minor radius of the correlation ellipse in Scatter Matrix are exported to the result sheet. No matter you create the Scatter Matrix from Plot: 2D: Scatter Matrix or Statistics: Descriptive Statistics: Correlation Coefficient, you can find the major and minor radius of each correlation ellipse by A and B values in the Parameters column label row of the PlotData worksheet, where A is the major radius and B is the minor radius. | |
0 | Statistics: Add grouping support for Statistics on Rows. | Add grouping support for Statistics on Rows | Statistics on Rows now allows grouping based on values in a columns label row. For example, in below illustration, results will be grouped by values in the Long Name label row. | |
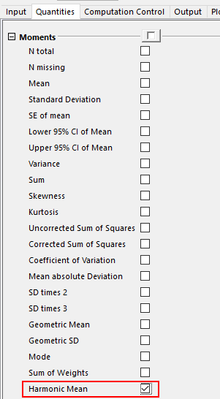
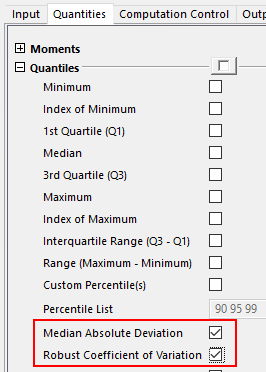
0 | Statistics: Add Median Absolute Deviation, Robust Coefficient of Variation and Harmonic Mean for Statistics on Columns/Rows tool | Add Median Absolute Deviation, Robust Coefficient of Variation and Harmonic Mean for Statistics on Columns/Rows tool | Statistics on Columns/Rows dialog adds below checkboxes: | |
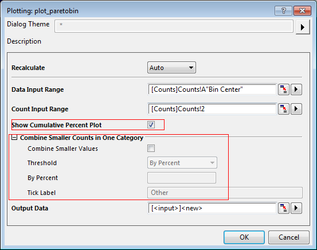
0 | Statistics: Add option of Exclude cumulative counts plot to Pareto chart dialog | Add option of Exclude cumulative counts plot to Pareto chart dialog | Add options to the Pareto Chart (Binned and Raw) dialog
| |
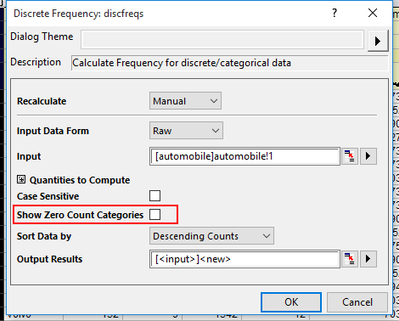
0 | Statistics: Discrete Frequency for categorical data needs to add zeros for if not found | Discrete Frequency for categorical data needs to add zeros for if not found | Discrete Frequency dialog adds a checkbox Show Zero Count Categories. | |
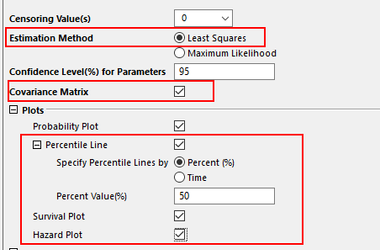
0 | Statistics: Improve Weibull Fit with RRX method and Add Plot for survival function and hazard function for weibull fit - Origin Pro | Improve Weibull Fit with RRX method and Add Plot for survival function and hazard function for weibull fit | Weibull Fit dialog adds below new items: | |
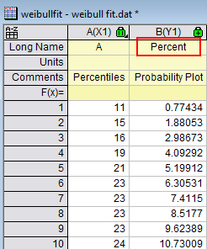
0 | Statistics: Rename Weibull Percentiles into percentages | Rename Weibull Percentiles into percentages | Weibull Fit tool's PlotData worksheet column label changed. | |
0 | Statistics: Weibull Fit Calculate 100% Probability Which Can't Plot | Weibull Fit Calculate 100% Probability Which Can't Plot | Origin 2018 changed Weibull Fit tool's Score Methods from Kaplan-Meier to Benard, which also affects Distribution Fit tool's probability plot . |
Data Handling
ASCII Importing
ID | JIRA | SUMMARY | DESCRIPTION | DETAILS |
|---|---|---|---|---|
0 | Import ASCII one row header line with special format | Import ASCII one row header line with special format | Change the Extract Long Name and Units from Same Line node to Composite Header Line No. node, when this node is check, we show the Composite Pattern node for specify the composite pattern of Long Name, Unit andComment, if it is <auto>, it will works as the old way. | |
0 | New impASC on GUI and related changes | New impASC on GUI and related changes | Reconstruct the Import ASCII X-Function "impASC"(including the impASC setting dialog), and also it is compatible with the old one in LT script. However, we also add a system variable @IA for users who want to use the old one to roll back. @IA = 1 @IA = 2 |
Importing Third Party Formats
ID | JIRA | SUMMARY | DESCRIPTION | DETAILS |
|---|---|---|---|---|
0 | Import Excel- Support Importing Sheets into Separate Workbooks | Import Excel- Support Importing Sheets into Separate Workbooks | Add a new option Start New Books for Each Sheet in "1st File" and "Multi-File" Import Mode, but currently re-import is not supported in this mode. |
Data Import
ID | JIRA | SUMMARY | DESCRIPTION | DETAILS |
|---|---|---|---|---|
0 | Display imported file name in a new worksheet label row entitled "SourceFile". | A new checkbox "Add Filename User Parameter Row" in Import dialogs. | A new checkbox "Add Filename User Parameter Row" in Import dialogs. If checked, "SourceFile" label row appears in worksheet after import. This label row can be used in any place label rows can be used such as legends. | |
0 | Importing specified columns and rows in ASCII, CSV, and Excel dialogs using specific syntax. | Under Partial Import node. See ASCII Import dialog for example syntax. | Under Partial Import node. See ASCII Import dialog for example syntax.
| |
0 | Set Origin to be the default software to open data files. | Set Origin to be the default software to open data files. | In Origin 2018, if user right-clicks on a data file and set the file to open with Origin or set Origin to be the default program to open it, data file will be imported into Origin directly whenever such a file is double-clicked. | |
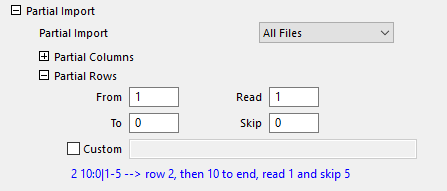
0 | Support Partial Row Import for Excel | Support Partial Row Import for i importing Excel file. | Suppport Partial Row Import for Excel import tool, add Partiial Rows branch with five nodes under Options: Partial Import: | |
0 | Support Undo for Import ASCII, CSV, and Excel. | Support Undo for Import ASCII, CSV, and Excel. | After importing either ASCII, CSV, or Excel, user can choose Undo from the Edit menu or Ctrl+Z to undo the import. | |
0 | To make Reimport and Clone Import more obvious, a new Import toolbar is created with more buttons. | To make Reimport and Clone Import more obvious, a new Import toolbar is created with more buttons. |
Importing Third Party Formats
ID | JIRA | SUMMARY | DESCRIPTION | DETAILS |
|---|---|---|---|---|
0 | Copy and Paste Excel cell(s) to Origin Graph will paste as text by default. | Copy and Paste Excel cell(s) to Origin Graph will paste as text by default. | Before Origin 2018, if user copied some cell(s) in Excel and then pasted it into Graph window, it was pasted as Excel object by default. User must use Edit: Paste Special... to paste as unformatted text. In Origin 2018, the cells will be pasted as text by default. If user wants to paste as Excel object, user can choose Edit: Paste Special... or context menu and choose to paste as "Microsoft Excel Worksheet". Set system variable @PXLTXT=0 to change back to old behavior. | |
0 | More options in Excel Import. | More options in Excel Import. |
| |
0 | Support Skip Column when importing CSVfile. | Added the Read Columns and Skip Columns in CSV Import. | This was already supported in some other import like ASCII, Excel, etc. Added the Read Columns and Skip Columns in CSV Import. |
Origin Project Files
ID | JIRA | SUMMARY | DESCRIPTION | DETAILS |
|---|---|---|---|---|
0 | Convert Origin to use Unicode for text and a new file structure for various Origin files including projects. | Convert Origin to use Unicode for text and a new file structure for various Origin files including projects. | File extensions are changed to: OPJU, OGWU, OGGU, OTWU,, etc. New structure allows file sizes to be reduced (sometimes greatly). It also allows files to be loaded more quickly. | |
0 | In the Projects tab, Origin projects that were modified and not actually saved can be reopened with the modifications in place via the Unsaved Files list. | In the Projects tab, Origin projects that were modified and not actually saved can be reopened with the modifications in place via the Unsaved Files list. | Even if the user chooses not to save a project file (OPJU), an autosaved OPJU will be kept for 7 days by default. If the user actually saves the project after modifying it, the unsaved version will be removed.
| |
0 | New Project File Extension for New File Format and File Dialog | New Project File Extension for New File Format and File Dialog | In Origin 2018, New File Extensions like OPJU, OGWU, OGGU, OTWU, etc are added to various opening/saving file dialogs drop-down lists. | |
0 | Support Preview and thumbnail file images in Windows File Explorer for Origin Files. (Toggle Windows File Explorer Preview pane using the Alt+Pkeyboard shortcut). | Support Preview and thumbnail file images in Windows File Explorer for Origin Files. | ||
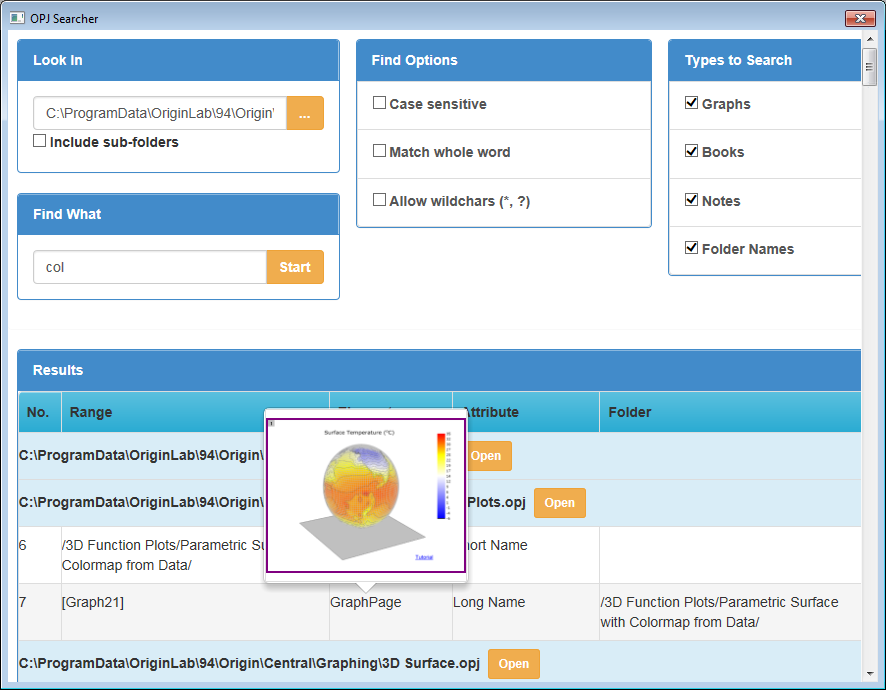
| 0 | OPJ Searcher | Search the specified keyword in all the OPJs in the specified folder. | Download OPJ Searcher app from the page and install the app. This app is used to search for an OPJ file by identifying a keyword that is input into a search engine. All projects from a specified folder or subfolders that have that keyword are listed. |
Set Column Values / Cell Formula
ID | JIRA | SUMMARY | DESCRIPTION | DETAILS |
|---|---|---|---|---|
0 | Better color syntaxing for LabTalk function and Spreadsheet column name notation in Set Column Value dialog. | In Set Column Value dialog, use Navy color for LT variable, Wine color for LT function, Pink color for Spreadsheet column name. | In Set Column Value dialog, use Navy color for LT variable, Wine color for LT function, Pink color for Spreadsheet column name. | |
0 | Keep formula exactly as entered by user. | Keep formula exactly as entered by user. | Before Origin 2018, formula auto expanded in some cases.
System variable @SCVU is added in Origin 2018. By default what you type will be what you see. If you want it to go back to 2017 behavior, set @scvu=0. | |
0 | Worksheet Cell Formula. | Support Worksheet Cell Formula. |
Workbook and Worksheet
ID | JIRA | SUMMARY | DESCRIPTION | DETAILS |
|---|---|---|---|---|
0 | Copy Full Precision change to text only | Copy Full Precision change to text only | Since Origin 2018, when use choose Copy Full Precision, the copied content will be text only in clipboard, then it would be convenient for user to paste to another application. Set @CPF = 0 to go back to 2017 behavior. | |
0 | Ignore hidden columns in ASCII Export. | Ignore hidden columns in ASCII Export. | Before Origin 2018, when exporting a worksheet as ASCII data, hidden columns were exported. In Origin, by default hidden columns will be ignored and will not be exported. To export hidden columns, set system variable @UHC=1. | |
0 | Increase the Maximum number of Sheets per workbook. | Increase the Maximum number of Sheets per workbook. |
| |
0 | New X-Function wcellfmt added to set selected cells' format. | New X-Function wcellfmt added to set selected cells' format. | Run wcellfmt -h to see Help and examples. E.g. the following example first uses wxt x-function to select all rows with B>0 Then set the fill color of the selected cells to green | |
0 | Rename sheet name and long name inNavigate Worksheetdialog. | For a workbook with many sheets, user can right click any sheet tab and choose Navigate to delete, order, duplicate sheet etc. But renaming sheet wasn't supported. Added in Origin 2018 now. | ||
0 | System Variable to hide worksheet tab tooltip. | When mousing over a worksheet tab, worksheet short name, long name and comments show. But it can block other sheets. A system variable @WTT is added. Default is 1 (enabled). Set it to 0 to disable worksheet tooltip. |
Worksheet Data Manipulation
ID | JIRA | SUMMARY | DESCRIPTION | DETAILS |
|---|---|---|---|---|
0 | Support carrying over column categories in worksheet query. | Support carrying over column categories in worksheet query. | Support carrying over column categories during worksheet query data extraction to new book/sheet. |
Graphing
3D Graphs
ID | JIRA | SUMMARY | DESCRIPTION | DETAILS |
|---|---|---|---|---|
0 | 3D XYZ Colormap Surface supports colormapping from another column. | 3D XYZ Colormap Surface supports colormapping from another column | In the past, we don't support this so user has to convert XYZ data and the coloring data into Matrix first since 3d colormapping surface plotted from matrix supports colormapping from another matrix object. | |
0 | 3D XYZ Colormap Surface supports custom boundary. | 3D XYZ Colormap Surface supports custom boundary | Contouring Info tab is added in Plot Details dialog to specify XY boundary. | |
0 | Drag on graph to move light source. | Drag on graph to move light source | Hotkey S is added on 3D graph to move light source.
| |
0 | Support Lighting effect for 3D walls plot. | Support Lighting effect for 3D walls plot | Before Origin 2018, Lighting was only supported for 3D OpenGL based surface and 3d Bars. In Origin 2018, we added the support for 3D Walls. |
Axes
ID | JIRA | SUMMARY | DESCRIPTION | DETAILS |
|---|---|---|---|---|
0 | Add custom reference lines to your graph: | Define Reference Lines based on statistics or expression | Define Reference Lines based on statistics or expression and saved in graph template for future use.
Click Details on Reference Lines tab of Axis dialog to define reference lines.
| |
0 | Allow number of Major axis ticks to be 0. | Allow number of Major axis ticks to be 0. | This will allow user to create a graph with only begin and end ticks and no ticks in between by:
| |
0 | Axis Break Improvements: | Axis Break Supports Anti-Aliasing and Proportional Unit for Axis Break Positions | In Origin 2018,
| |
0 | Axis end doesn't look nice when zoomed in | Make the Axis end look nice when zoomed in | Before Origin 2018, when zoomed in, Axis ends didn't look good. In Origin 2018, the Axis ends will look nice even when zoomed in, depending on different coordinate system. -2 (default): square for Cartesian (=90 degree) coordinate, round for other coordinates (!=90) | |
0 | Change Filling color between Reference Lines with Alternate Fill. | Change Filling color between Reference Lines with Alternate Fill | Before Origin 2018, if Alternate Fill was checked for Reference Lines, user couldn't change fill color. In Origin 2018, click Details... button on the tab. Then select all entries on the left panel and change Fill Color to change all fill colors together. | |
0 | Different ways to wrap tick labels. | Different ways to wrap tick labels | Wrap based on layer length Wrap by Minimum number of characters. E.g. in the following example, set tick label display to Custom Display with MMM dd HH:mm:ss And to wrap with by minimum 1 char. It will show Month, date and time each on one row. | |
0 | No extra space after / or - when using /<U> and -<U> as axis unit. | A system variable added to control space before unit separator | Before Origin 2017, In Tools: Options →Axis tab, when specifying unit separator as /<U>, or -<U>, an extra space shows after / or -. In Origin 2018, by default no space will be added after / or -. User can manually set it as / <U>, or - <U> to add a space. We will continue to have space before units separators by default. System variable @ATSS is added to control space before unit separator. 1: space before unit separator (default) 0: no space before unit separator | |
0 | Show reference line in Trellis plot | Show reference line in Trellis plot | You can control reference line show in specific panel in trellis plot through Reference Lines dialog's Show on Panel control. Label will show when open Reference popup to incicate panel index. | |
0 | Support Arrow at axis begin and end in 2D graphs. | Support Arrow at axis begin and end in 2D graphs | Arrow node on Line and Ticks tab of Axis dialog | |
0 | Support not plotting filtered rows for text axis: | Support not plotting filtered rows for text axis | E.g. Some data are filtered in worksheet. When plot column plot in Origin 2018, only those data in display will be plotted with their corresponding X axis. Before Origin 2018, though the filtered data are not plotted, the x axis still kept their position with blank tick label. Note: This only applies to X column that contains text and not set as categorical. | |
0 | Support Reference Line for Polar(and other special plot types) | Support Reference Line for Polar(and other special plot types) | Polar graph, Radar chart and Ternary all support reference line. |
Column/Bar/Pie
ID | JIRA | SUMMARY | DESCRIPTION | DETAILS |
|---|---|---|---|---|
0 | Allow drag-and-drop to add dataset into the group of Stacked Column | Allow drag-and-drop to add dataset into the group of Stacked Column | In 9.4, it is not possible to adding a dataset into a Stacked Column by drag-and-drop. Now you can add new dataset into the group of Stacked Column/Bar plot by drag-and-drop. | |
0 | Column Gap control for Double Y Column Plot. | Column Gap control for Double Y Column Plot | For Double Y column plot, user can go to 1st plot's Spacing tab to set Overlap as a negative value to show some gaps between the the columns. There is no such control in Origin 2017 and earlier so the bars are always connected in the past. | |
0 | Show Total Label on Stacked Column/Bar. | Show Total Label on Stacked Column/Bar | Show total value on stacked column/bar or 100% stacked column/bar.
|
Contour
ID | JIRA | SUMMARY | DESCRIPTION | DETAILS |
|---|---|---|---|---|
0 | Support no smoothing when set custom boundary for XYZ contour. | Support no smoothing when set custom boundary for XYZ contour | In Origin 2018, user can uncheck Smoothing checkbox when using Custom Boundary. Before Origin 2018, the checkbox couldn't be unchecked so there was always some smoothing effect. Workaround: Set system variable @tcs=0 to minimize the number of smoothing data points |
Customizing Color
ID | JIRA | SUMMARY | DESCRIPTION | DETAILS |
|---|---|---|---|---|
0 | Use Cluster tool to easily change part of plot to a different color. | Use Cluster tool to easily change part of plot to a different color | Cluster Gadget is improved so user can easily select a range of plot and color it. User can use cluster gadget to create group for the region of interest and check Color Data by Category. Then the region will be colored red. Open Plot Details, user can go to Color List tab to change color. |
Data Label
ID | JIRA | SUMMARY | DESCRIPTION | DETAILS |
|---|---|---|---|---|
0 | Improvement to data labeling at specified Indices only. | Improvement to data labeling at specified Indices only | In addition to manually entering specific indices, now specific columns may be selected that contain indices for the specific labels. | |
0 | Support Label for 2D Vector Plot. | Support Label for 2D Vector Plot | Double click vector plot to go to Label tab of Plot Details dialog to add labels.
| |
0 | Support leader line for Pie chart label. | Support leader line for Pie chart label | Show a leader line between pie slices and labels. |
Drawing Objects
ID | JIRA | SUMMARY | DESCRIPTION | DETAILS |
|---|---|---|---|---|
0 | Distribute selected layers/graphic objects horizontally or vertically. | Distribute selected layers/graphic objects horizontally or vertically | Two buttons are added in Object Editor toolbar. Select all graphic objects and click it to keep begin and end positions of the objects and distribute them evenly in one direction. E.g. This also works for multiple Layers. User can press Shift key and select multiple Layers. Then click the button to distribute layers horizontally or vertically. |
General
ID | JIRA | SUMMARY | DESCRIPTION | DETAILS |
|---|---|---|---|---|
0 | Interactively pick data points from graph. | Interactively pick data points from graph | Interactively pick points and collect them in a workbook. Mouse over the plot you want to pick point. A tooltip will show about the plot's X,Y info. Right click and click Pick Data Points... Click a point in graph and make sure it's the point you want to pick. Then press Enter or double click to confirm the selection. Continue it till done. A workbook will be created with x,y coordinates and row indexing, etc. | |
0 | Control display of masked data at graph page level. | Control display of masked data at graph page level | Display of masked data on graph can now be controlled for individual graphs via the following Labtalk: page.mask = 2; // Display masked data on active graph page.mask = 1; // Hide masked data on active graph | |
0 | Ctrl+A Keyboard shortcut Selects All in Graph and Layout window. | Ctrl+A Keyboard shortcut Selects All in Graph and Layout window | This feature is useful when user needs to select all layers in agraph or all objects in layout to move and/or resize together.
| |
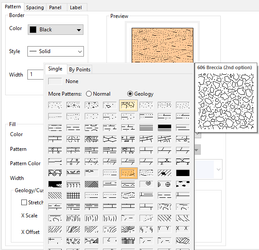
0 | Improve Preview for patterns and filled colors | Improve Preview for patterns and filled colors | Hover mouse over a pattern block, the preview of this pattern will show. | |
0 | Keep Scale in mode until pressing ESC. | Keep Scale in mode until pressing ESC | User wants to Scale In toolbar button and keep on zooming in by drawing a rectangle. Before 2018, after scale in once, need to click Scale In button again to zoom in further. | |
0 | Make new Layer Content dialog easy to use | Make new Layer Content dialog easy to use | Reorder the column order in left panel of Layer Contents dialog so Column Short Name with Plot designation can be more obvious. In Origin 2018, the default display order in left panel is: Short Name, Long Name, Book, Sheet. |
Graph Types
ID | JIRA | SUMMARY | DESCRIPTION | DETAILS |
|---|---|---|---|---|
0 | Bridge Chart/McKinsey-style waterfall. | Bridge Chart/McKinsey-style waterfall | Support Bridge chart with total and connecting lines.
| |
0 | Double Y Box Chart. | Double Y Box Chart | Plot: Box Chart: Double Y Box Chart menu is added. In Origin 2018 because on Miscellaneous tab of Plot Details dialog → Graph level, Column/Bar/Box Gap Across layers is checked. The checkbox used to work for column/bar plot only. Note: This checkbox is only enabled if
|
Layer and Plot Management
ID | JIRA | SUMMARY | DETAILS | |
|---|---|---|---|---|
0 | Plot 2 Y columns with numeric X, columns will be plotted against row indexing by default. | A system variable used to control how to plot 2Y columns, against X values or row index | If plotting one Y column as Columns/Bars with numeric X, it will be plotted as X value positions. If plotting multiple Y column as Columns/Bars with numeric X, it will be plotted with row indexing by default. Use system variable @DRX>0 (default is 16) to enable this feature only if dataset size is smaller then this value. Set @DRX=0 to disable this change completely. | |
0 | Use System Increment list when adding new plots into existing graph. | Use System Increment list when adding new plots into existing graph | Origin 2017 supported customizing system color list, shape list, etc. for line, line+symbol, scatter plot. But when user added more then 1 column of data to existing graph, the customized system color list wasn't used. Instead the color list defined in graph template was used. In Origin 2018, when adding more than 1 column of data to existing graph, the customized system color list will be used. |
Line and Symbol
ID | JIRA | SUMMARY | DESCRIPTION | DETAILS |
|---|---|---|---|---|
0 | Symbol size increments for each plot in group. | Symbol size increments for each plot in group |
|
Publishing
ID | JIRA | SUMMARY | DESCRIPTION | DETAILS |
|---|---|---|---|---|
0 | Define the region to export or copy page in Origin 2018. | Define the region to export or copy page |
Text Labels & Legends
ID | JIRA | SUMMARY | DESCRIPTION | DETAILS |
|---|---|---|---|---|
0 | Better Hint and Examples in Update Legend dialog. | Better Hint and Examples in Update Legend dialog | ||
0 | Control Decimal Separator for Labels & Annotations at Graph Page Level. | Control Decimal Separator for Labels & Annotations at Graph Page Level | In the past, this is a global control in Tools: Options dialog so user can not set different graph windows differently. | |
0 | Customization symbol on left side of legend box. | Customization symbol on left side of legend box |
| |
0 | Easier way to turn on and off active dataset indicator (red frame) in Legend via: | Easier way to turn on and off active dataset indicator (red frame) in Legend | The red frame around plot part of legend is the activate dataset indicator. Analysis, etc. tools always work on active dataset by default. So it's useful to see it sometimes. The control to turn it on or off is hidden on Legends/Titles tab of Plot Details dialog in the past and hard to find. | |
0 | GUI to Customize Symbols in Legend. | GUI to Customize Symbols in Legend |
| |
0 | Plot multiple line plots with colors mapped to a palette. Corresponding color scale shows in legend. | Plot multiple line with colors mapped to a palette and show color scale in legend | It was doable before Origin 2018 but needs a lot of steps.
| |
0 | Simplify Categorical Values Legend Dialog. | Simplify Categorical Values Legend Dialog | The "Combine Elements Indexed by Same Column" checkbox is hidden and on so such elements will always show as combined in Legend. To bring back the old dialog, set system variable @LCC=1 and reopen the dialog. | |
0 | Symbol like legend for customized single point in line plot and line+symbol plot. | Symbol like legend for customized single point in line plot and line+symbol plot | Before Origin 2018, if user customized a single point in line graph, the symbol failed show in legend. If user customized a single point in line+symbol graph, the special point legend showed as line+symbol. In Origin 2018, both are supported. For line+symbol plot, if you want the single point legend show as line+symbol as before, set @lsl=0. | |
0 | Use One Legend Type Only and Auto Update | Use One Legend Type Only and Auto Update | Add a new menu option named Use One Legend Type Only and Auto Updateunder Legend context menu. When it's checked and select one type of legend in Legend context menu, all other types of entry will be deleted. When data point/data plot is added or deleted, the legend will be updated automatically. |
Theme and Template
ID | JIRA | SUMMARY | DESCRIPTION | DETAILS |
|---|---|---|---|---|
0 | Graph Theme support for Anti-Aliasing. | Graph Theme support for Anti-Aliasing | Before Origin 2018, there was Enable/Disable Anti-Aliasing toolbar button orpage.aa=1 property for user but it was tedious for user to do it for each graph. A built-in graph theme AntiAliasing.oth is added on Graph tab of Tools: ThemeOrganizer. User can apply it to existing graphs or set it as system theme for future graph creation. |
Installation and Licensing
Compatibility/Upgrade
ID | JIRA | SUMMARY | Description | DETAILS |
|---|---|---|---|---|
0 | Miscellaneous:Stop shipping MOCA files | MOCA files are not shipped together with Origin 2018. Contact us if you need to build your MOCA DLL. | MOCA files are not shipped together with Origin 2018. If you need to build your MOCA DLL, please contact us: tech@originlab.com | |
0 | Miscellaneous:Warning when opening an opj which version is higher than your Origin | When opening an opj/opju which version is higher than your Origin, a smart hint will show. | Implemented in Origin 2018. When opening an opj/opju which version is higher than your Origin, a smart hint show
| |
0 | Option to bring over 2017 Workspace and toolbar layout to Origin 2018. | When launching Origin 2018 for the 1st time, a messagebox will ask whether to copy over Origin 2017 workspace and toolbar layout. It can be reactivated by View: Toolbars > Reinitialize button. | When launching Origin 2018 for the 1st time, after specifying User Files Folder, a messagebox asks user if he/she wants to copy over Origin 2017 workspace and toolbar layout. Alternately, the user can go to View: Toolbars, click Reinitialize button to see the message again. | |
0 | Options to Transfer 2017 User Files. | When launching Origin 2018 for the 1st time, a message box will ask whether to transfer User Files from Origin 2017. Alternatively, it can be done by Tools: Transfer User Files... later. | When launching Origin 2018 for the 1st time, a message box will popup asking user if they want to transfer User Files from Origin 2017. If "No" is chosen, the user can later choose Tools: Transfer User Files... to transfer them. |
Nodelocked Licensing
ID | JIRA | SUMMARY | Description | DETAILS |
|---|---|---|---|---|
0 | Easier nodelocked (single or group) Licensing. | The Product Key for Origin 2018 will be automatically pre-filled with the one from the Origin 2017 installation. Just click Activate button once to activate Origin 2018. | If user has valid Origin Maintenance, she/he can install 2018 with the same Serial number as Origin 2017 on the same PC as Origin 2017, The Product Key for Origin 2018 will be automatically pre-filled with the one from the Origin 2017 installation. Just click Activate button once to activate Origin 2018. |
Start-up
ID | JIRA | SUMMARY | Description | DETAILS |
|---|---|---|---|---|
0 | If Origin crashes, it will restart with last Autosaved OPJ/OPJU loaded | Origin auto-saves the current OPJ/OPJU file every 12 minutes by default and if Origin crashes, it will restart with last Autosaved OPJ/OPJU loaded. | If an OPJ/OPJU file is opened and being worked on in Origin, it will be autosaved every 12 minutes by default and if Origin crashes, user can go to Autosave folder to find it. In Origin 2018, if Origin crashes, it will restart with last Autosaved OPJ/OPJU loaded so user doesn't need to manually find it in Autosave folder. Note:
| |
0 | Important Origin-related folders are no longer in version-specific subfolders. | User Files\AutoSave\Unsaved\License folders are no longer put into Origin version-specific subfolders making migration to future versions of Origin much easier. | The following folders are no longer put into Origin version-specific subfolders making migration to future versions of Origin much easier.
|
Miscellaneous
Origin Workspace
ID | JIRA | SUMMARY | DESCRIPTION | DETAILS |
|---|---|---|---|---|
0 | App Central Dialog. | New App Center dialog | The new App Center dialog (keyboard shortcut F10) centralizes App discovery, installation, without having to leave Origin and open a web browser (unless you choose to learn more about selected Apps). | |
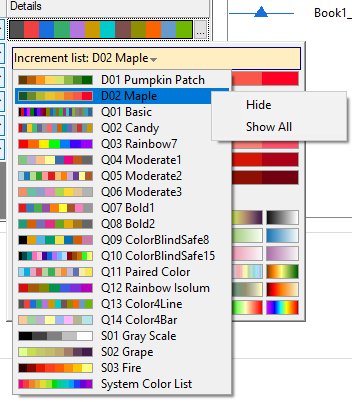
0 | Context menu to Hide Color List/Palettes and Show All to restore | Context menu to Hide Color List/Palettes and Show All to restore | Some of the color lists or color palettes may not apply to user. Then user can right click from the color list or palette list to hide it. Chose Show All to make hidden ones visible again. This also works for user-defined color list/palettes. | |
0 | Export Graph...menu shows under File: Export: if there is graph floating or embedded on active sheet. for example:. | Export Graph...menu shows under File: Export | Origin 2018, if there is embedded graph in workbook, Export Graph... menu shows under File: Export: In previous versions of Origin, the user needs to double-click on a floating or embedded graph prior to exporting it. | |
0 | Graph Samples tab is restructured and allow selecting a specific Plot Type category as well as keyword searching. | Graph Samples tab allows selecting a specific Plot Type category as well as keyword searching | ||
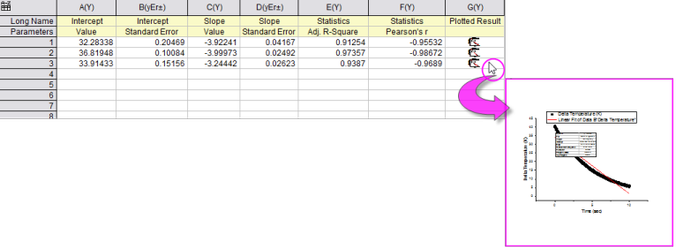
0 | Images in worksheet cells now be viewed as enlarged popups when running mouse over the cell. | View images in worksheet cells as enlarged popups when running mouse over the cell | For example, when mousing over the following cells, an enlarged popup image will be displayed.
A System Variable @CET is used to control the behavior: @CET=0, use default size of 250x250 @CET=1 to 29, disable this feature @CET > 30 is user defined size in pixel, scaled by DPI scale factor | |
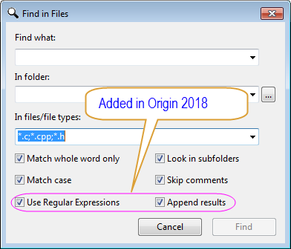
0 | Miscellaneous:Improve Find and Find in Files in Code Builder. | Improve Find and Find in Files in Code Builder | Support User Regular Expressions and Append results in Find in Files dialog of Code Builder. | |
0 | Remove the "Yes-No" confirmation dialog about saving changes to "Tools: Options" modifications. | Remove the "Yes-No" confirmation dialog about saving changes to "Tools: Options" | ||
0 | Tooltip Improvements on Color related toolbars | Tooltip Improvements on Color related toolbars |
| |
0 | File: Export: As PDF File...menu added for worksheet | File: Export: As PDF File...menu added for worksheet | In Origin 2018, File: Export: As PDF File... menu is added. In previous versions of Origin, Export worksheet as PDF file is an option in File: Export: As Image File... dialog. But is not obvious. | |
0 | Insert non-keyboard Unicode characters similar to MS Word and other apps using 4-digit code and Alt+X keyboard combination. | Insert non-keyboard Unicode characters | To insert a character that is not supported by your keyboard, find the relevant 4-digit Unicode code via Google. Then, when in edit mode, type in the 4 digits and hit Alt+X to convert it to the actual character. Note: If the font for the location does not support the relevant character, it may not display properly even though the character is valid. This feature works in:
| |
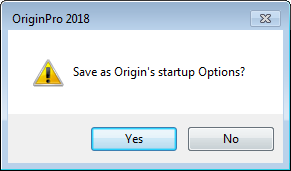
0 | Miscellaneous:Reminder Message about saving OPJ as OPJU | Reminder Message about saving OPJ as OPJU | When user opens an OPJ file and later Save As, by default the format is OPJU, and we should open a reminder message box to inform them earlier version of Origin will not be able to open such files and allow Cancel, so file not saved. |
Settings
ID | JIRA | SUMMARY | DESCRIPTION | DETAILS |
|---|---|---|---|---|
0 | Access to the Character Map in Worksheet cell edit mode. | Access to the Character Map in Worksheet cell edit mode | Double click a cell to enter the edit mode. Ctr+M or right-click and choose Character Map to insert symbol into cell using the font specified for the cell. The benefit of this is that it allows actual Unicode characters to be inserted into Label rows, rather than codes used in previous versions of Origin. Hence, then the values in Label Rows are displayed elsewhere, those Unicode characters will be used. | |
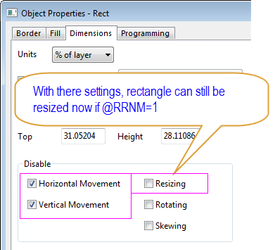
0 | Miscellaneous:Allow graph object to be resized programmatically when horizontal and vertical movement is prohibited in Object Properties dialog. | Allow graph object to be resized programmatically | Set system var @RRNM=1 to allow resizing when Disable Horizontal or Vertical Movement bits are set. (default is 0). | |
0 | Increase the Maximum Undo times to 100. | Increase the Maximum Undo times to 100. | In Origin 2018, the default maximum number of Undos is set to 100. Before Origin 2018, it was 10 times. Corresponding system variable: @UN. |
Programming
Labtalk
ID | JIRA | SUMMARY | DESCRIPTION | DETAILS |
|---|---|---|---|---|
0 | Improve LabTalk script to support exporting specified embedded graph(s) or graph sheet(s) during batch processing via Script After Each Process in Batch Processing dialog. | Support exporting specified embedded graph(s) or graph sheet(s) during batch processing | Example scripts: expGraph type:=pdf overwrite:=rename page:=2!; //sheet index | |
0 | Labtalk: Better LabTalk access to plotting X-functions. | Better LabTalk access to plotting X-functions | The X-functions below can be run via LabTalk to create graphs.
For example: plot_gboxindexed irng:=col(A) group:=col(B) theme:="test"; | |
0 | Labtalk: Diff() function supports padding in the begin or end of range. | Diff() function supports padding in the begin or end of range | Add optional argument to current function: vec Diff(vec[,n]) //support length of vector is N For example: Suppose there are 10 rows in column A and Set Column Values of B as diff(A) – returns 9 numbers. No value in last row. | |
0 | Labtalk: LabTalk Command to convert OriginC C and CPP files to become OCZ for distribution. | LabTalk Command to convert OriginC and CPP files to become OCZ for distribution | Syntax for the conversion command is is file -ocz password srcpath destination; srcpath can have wildcard in file name, and in this case destination must be a folder location and destination files will use source file name and extension changed to OCZ. The Message Log will list each successful conversion and indicate at the end as "Done!" or "Failed!". If any errors occur, they will be displayed in a Messagebox. For example: file -ocz junk "%YOriginC\*.c??" "%Yabc" file -ocz "aB12#$" "%YOriginc\test.c" "%Yjunk.ocz" | |
0 | Labtalk: LabTalk Function for Data Range of Plot | LabTalk Function for Data Range of Plot | Add a new LabTalk function to get the data range of a plot in graph. Syntax: dataset plotdata(index, designation, x = 0, y = 0) //x&y refers to panel index. Also, two new LabTalk functions added to get the first point and last point of a plot. Syntax: double FirstPoint(vector vec); | |
0 | Labtalk: LabTalk Save command updated to support new file format | LabTalk Save command updated to support new file format |
Also, use option X to Save With Format Determined From Supplied File Extension. Following switches are supported, -ix, -tx, -dix. For example,
| |
0 | Labtalk: New X-Function wcellfmt added to set format of selected worksheet cells. | New X-Function wcellfmt added to set format of selected worksheet cells | Run wcellfmt -h; in Script window to see Help and examples. For example: The following example first uses wxt x-function to select all rows with B>0 and then set the fill color of the selected cells to green. | |
0 | Labtalk: Option to let graph source always plot all Y columns in worksheet. | Option to let graph source always plot all Y columns in worksheet | With graph window active, run layer.group1.AllCols=1; in Script Window. Then all Y data in the worksheet will be plotted and, as Y columns are added or deleted, they will be removed/added to the graph. Note: This only applies to worksheet with XYYY... plot designation. | |
0 | Labtalk: Support -mfph switch for LabTalk Create command to create a hidden matrix from 2D loose datasets for 3D parametric function plot. | Support to create a hidden matrix from 2D loose datasets for 3D parametric function plot | For example: create myx -fp2 50 u 0 1 50 0 1; | |
0 | Miscellaneous: LabTalk and OriginC string functions can now operate on UTF-8 encoded strings. | LabTalk and OriginC string functions can now operate on UTF-8 encoded strings | Origin 2018 is Unicode-based with UTF-8 as the encoding method. For details on how this changes both LabTalk and OriginC text string processing functions, see this blog post: |
Origin C
ID | JIRA | SUMMARY | DESCRIPTION | DETAILS | |||
|---|---|---|---|---|---|---|---|
0 | HTML: Provide format option to convert variables in OC to string in html | Provide format option to convert variables in OriginC to string in html | Add a parameter in JSON.ToString( ), which converts variables in OC to string in html with full precision, to specify format
| ||||
0 | HTML:Change the z-index of controls | Change the z-index of controls | Enable popping up a message in an HTML dialog, it should be on top of graph control . Download the zip file below to see the sample codes | ||||
0 | HTML:HTML dialog support IE version checking | HTML dialog support IE version checking | All HTML dialog and HTML based App support IE version checking to avoid Javascript errors when IE Ver < 9 | ||||
0 | HTML:Show icon in the title bar of app dialog | Show icon in the title bar of app dialog | Two new member functions are added to OC Window class:
A new util function is also added to make it easier to set the icon from given icon file:
See below for the example of setting the icon of the HTML app dialog:
| ||||
0 | OC: Add rgb calculation functions to OC | Add rgb calculation functions to OriginC | Add two OC functions RGBtoHSL() and HSLtoRGB() to convert RGB to HSL and HSL to RGB | ||||
0 | OC: Additional dialog-related Win API functions | Additional dialog-related Win API functions | Support added for flashing dialog title bar, etc via the functions FlashWindowEx() and FlashWindow(). For example:
| ||||
0 | OC: Code Builder Should Handle UTF-8 files | Code Builder Should Handle UTF-8 files | Now Code Builder is able to handle UTF-8 files - loading, editing, saving, and debugging. | ||||
0 | OC: CreateGraphObject() provides an option to replace existing | CreateGraphObject() provides an option to replace existing | Add a bit, GROBJ_REPLACE_EXISTING,for CreateGraphObject() to replace existing
| ||||
0 | OC: DynaControl to Allow Multiple Controls in One Row | DynaControl to Allow Multiple Controls in One Row |
| ||||
0 | OC: OC to provide access to LabTalk LT properties on OriginObject | OriginC to provide access to LabTalk LT properties on Origin Object | 2018 will have general OC access to all the LT properties, this will include GraphObject, Column, Worksheet, etc
| ||||
0 | OC: Origin C compiler Must Handle UTF-8 Source Files | Origin C compiler Must Handle UTF-8 Source Files | In Origin 2018, we support executing UTF-8 files in Code Builder. 1. All code files (*.c, *.ogs etc.) Origin ships (so it is placed EXE folder) is kept as ANSI.
| ||||
0 | OC: Provide function to get the short description name of DataRange | Provide function to get the short description name of DataRange | Function below is added
|


