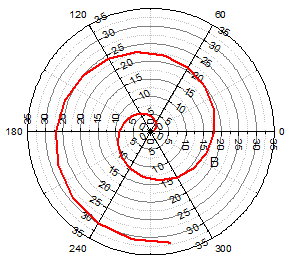
How to: After plot a regular polar graph, you can go to Plot Details dialog and change the plot type to be Column/Bar. - To stack columns: go to Plot Details: Plot Properties: Group tab, set Subgroup Size.
Then go to Plot Details: Layer Properties: Stack tab, choose Offset to be Cumulative and check Use Subgroup (in Group tab) for Cumulative checkbox. - To show grid line on top of data, go to Plot Details: Layer Properties: Display tab, check Grid on Top of Data checkbox.
In Plot Details: Plot Properties: Spacing tab, you can choose a column from the worksheet in Width(in %) dragdown list and let each column width indexed by it.
|


