Origin 9.1 Features
Key new features are highlighted below. To see all the features, use the navigation on the left.
Grouped Box Chart and other Improvements
We have added a lot of new controls on box plots, and also allows box plots from indexed or raw data with grouping controls.
Multiple Axis Breaks and Axis Break with No Gap
The axes dialog box has been completely redone to allow more features to be added in axes area, including
- Multiple Axis Breaks on X Y or Z axes
- User Defined Axis Scale Type is now supported
- You can now have more then one special tick to be added
Piper/Trilinear Diagram
Column Formula Label Row
LOWESS and LOESS Smoothing
Loess and Lowess are methods to describes the deterministic part of the variation in the data without requirement of a specific function. They are especially useful for detecting the trend of the data.
Partial Least Squares Regression (Pro)
Partial least squares (PLS) is a method for constructing predictive models when the factors are many and highly collinear. It is useful for variable selection and dimension reduction.
Column Plot Improvements
Smart Labels - Auto Position of Data Labels
3D Ternary Surface/Scatter
Merge Graphs: Treat Each Source Graph as a Unit and Add Labels
A new option Treat Layers in Each Source Graph as a Group makes it easy to keep original graphs arrangements in the merged graph.
Copy & Paste Operation
You can now copy the fit in one graph and then paste that to all curves in another graph. This allows all the settings to be applied, a big time saver.
Import Origin Project File (OPJ)
A new X-Function has been added to allow importing data from another OPJ. Currently, you can do so by running another instance of Origin, so this new tool makes it easier and also it can be used from LabTalk.
Improved Polar Plot - Full Control of Radial Axes and Other Improvements
We have made major overhaul of polar plots in Origin, giving user far more control on the radial axes as well as a host of other new features and improvements.
3D OpenGL Waterfall
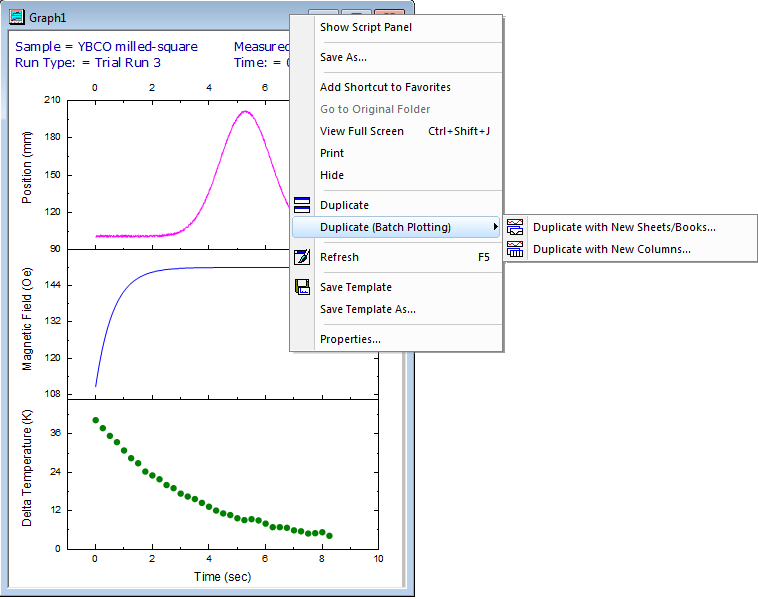
Batch Plotting - Duplicate Graphs by Using Data from Different Sheets
Origin 9.1 allows user to recreate a graph using a different sheet or book. Right-click on window title to see the new duplicate command.
Gadgets: Batch Analysis - Easily Apply Analysis to All Curves
New menu items have been added to the fly-out menu in Gadgets to output results for all curves, thus allowing batch analysis of multiple curves in a graph using gadgets.
Data Tooltip in Dialogs
Origin 9.1 introduce data tooltip in dialogs which makes it easier to view the ranges without having to expand the node in case of multiple range input.
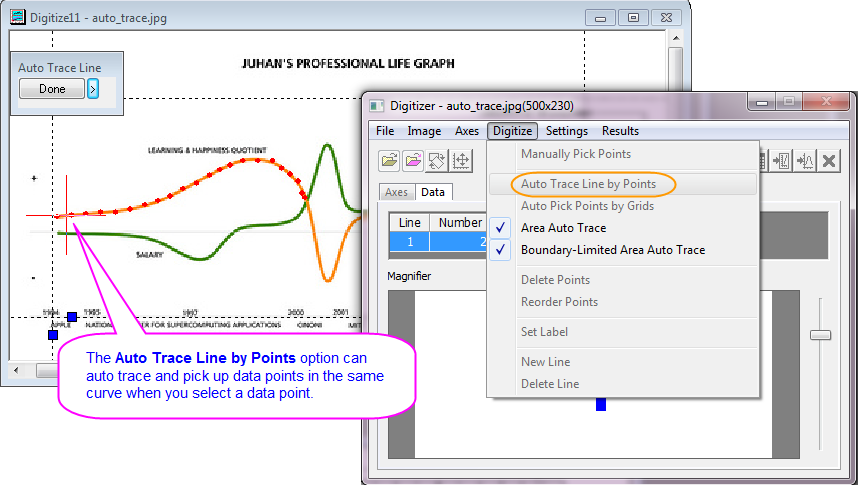
New Digitizer
The digitizer tool in Origin 9.1 make several improvements, including
- Auto trace Line & Digitize Area
- Remove Grid Line and Background
- Ternary and Polar coordinate


