(ORG-946)
Product Page of Column and Bar Plot
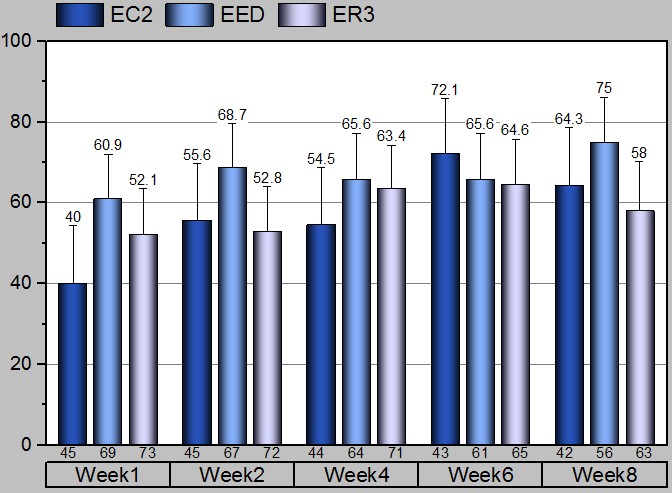
Menus are available under Plot: Column/Bar/Pie menu. Buttons are available on 2D Graphs toolbar,  . . |
 |  |
 | 
|
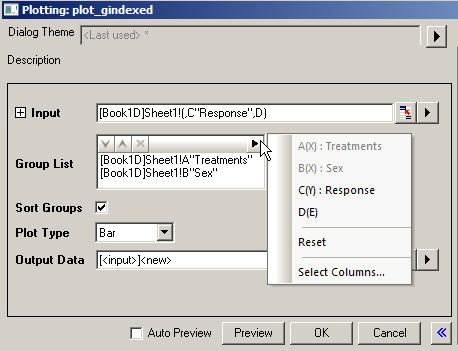
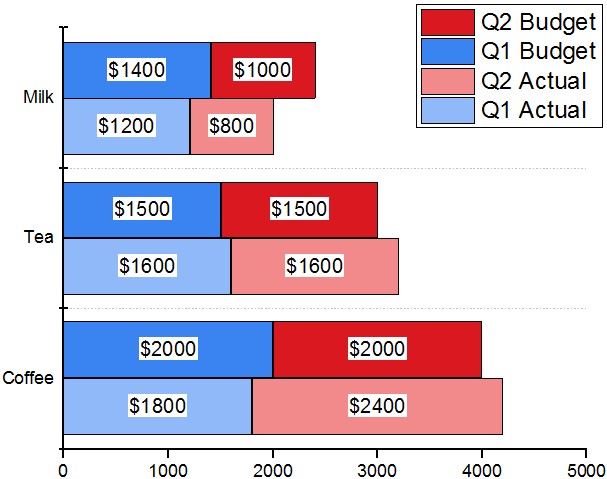
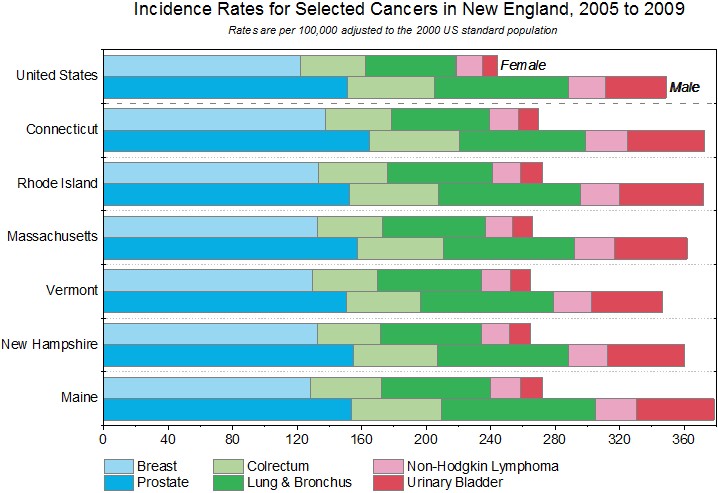
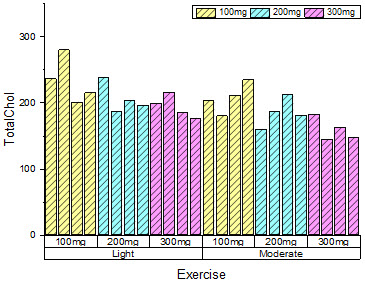
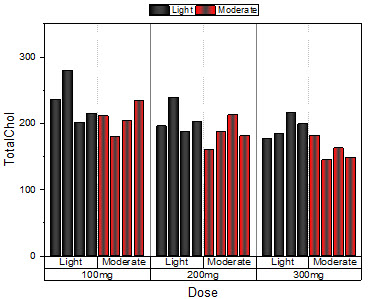
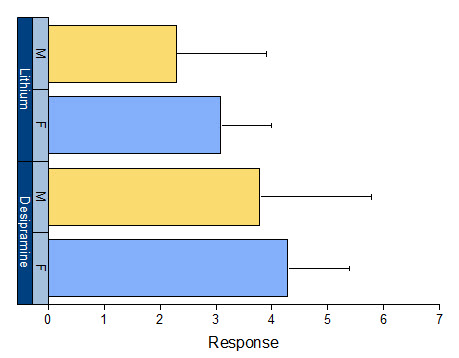
| How to: - Click Select Columns... to add multiple grouping columns into Group List or just select the fly-out one by one.
You can modify the sequence in Group List by Move Up/Down and Remove. - Uncheck Sort Groups if you don't want to sort the groups in alphabetical order of group name.
- Set Plot Type as Bar.
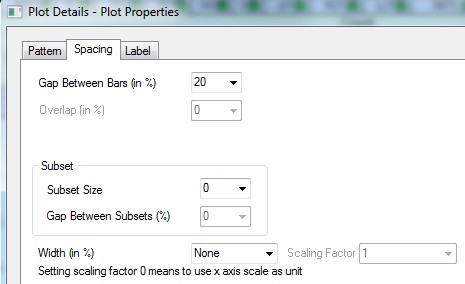
- Go to Plot Details: Plot Properties: Spacing tab, input Gap Between Subsets(%) to specify gap size between subgroups.
- Double click Tick Labels to open Axis dialog. Each row of the table has one node under Tick Labels node. Right click the node to move/delete it.
Note:
- The size of input range and all the group ranges must be equal.
|
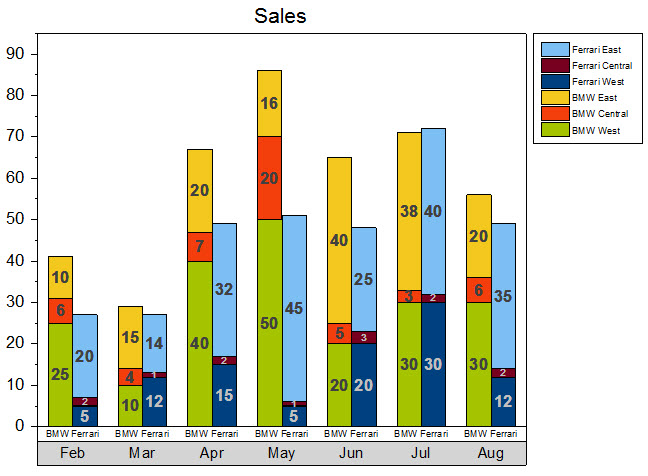
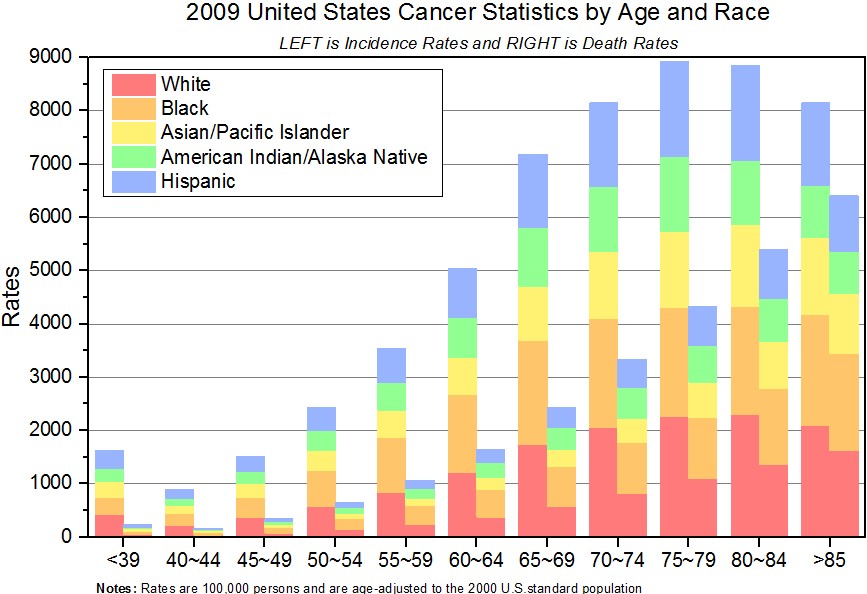
Grouped Stacked Column/Bar Graph (ORG-949)
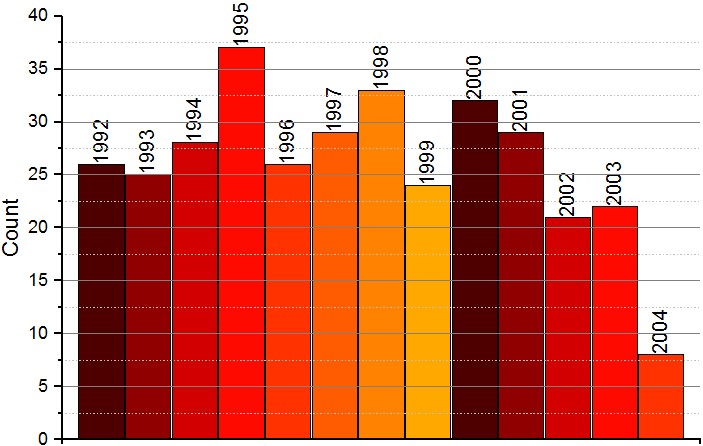
Subgrouping in Normal Column Plot
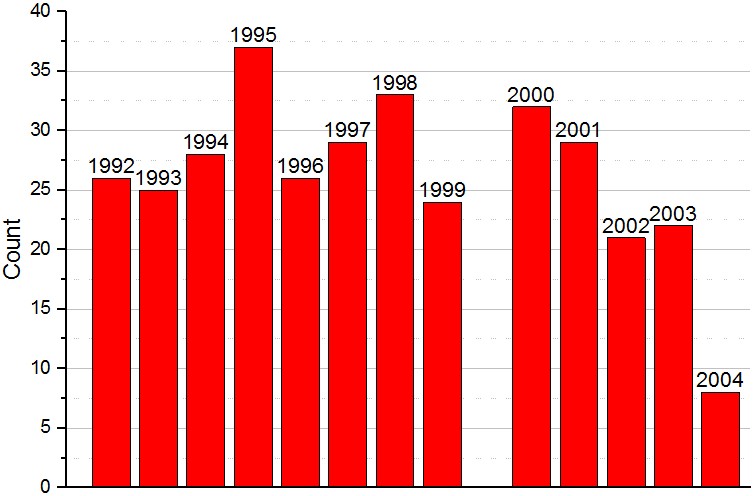 |  |
| How to: - Within the same dataset:
Go to Plot Detail: Plot Properties: Spacing tab, set Subsize Size and Gap Between Subsets(%). - In different dataset:
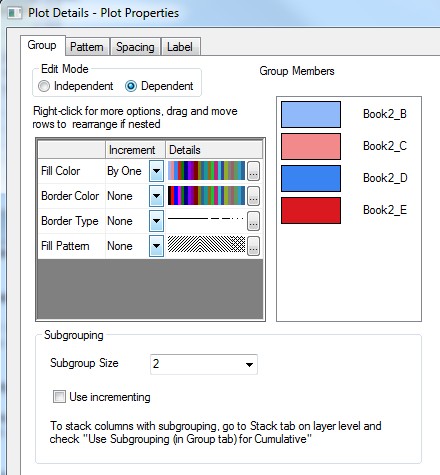
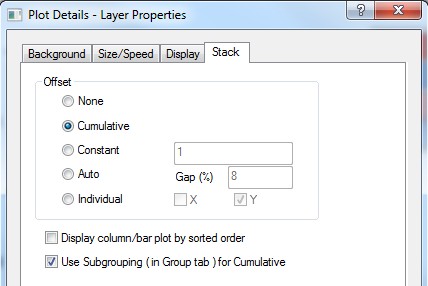
Go to Plot Details: Plot Properties: Group tab, set Subgroup Size.
Use increment checkbox indicated to repeat increment list within each subgroup.
|
![]()


