3D Ternary Surface
(ORG-917)
Sample OPJ to download to try: 3d Ternary Surface.opj
Plot:3D Surface:3D Ternary Colormap Surface. Toolbar button is under Plot: 3D Colormap Surface group on 3D and Contour Graphs toolbar.
How to:
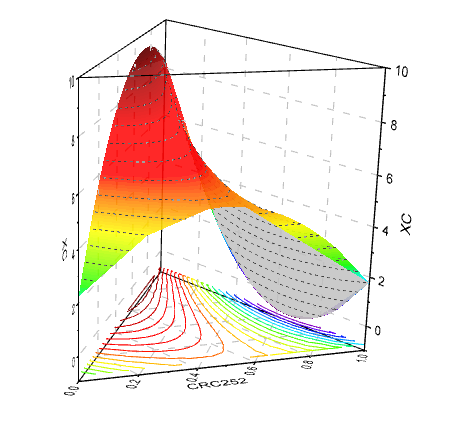
Graph1 is an example of a 3D Ternary Colormap Surface plot with the contour lines projected to the base plane.
It is in the 3D ternary coordination system with axes X, Y, Z and Zh, the input data should be designed as XYZZ.
To plot the 3D ternary surface
Go to the worksheet "Ternary Surface" in Book1,
Highlight column C and D(already highlighted)
Select Plot: 3D Surface:3D Ternary Colormap Surface from menu
To add the projection
On the graph window, double click on the layer icon to open the Layer Contents dialog.
In the dialog, highlight "Col(C) and Col(D) of sheet "Ternary Surface" and add it into the layer
Double-click on the plot to bring up the Plot Details dialog. In the Surface tab, choose Flat for both the second plot.
To show the projection as contour lines
Double-click on the plot to bring up the Plot Details dialog.
In the Colormap/Contours tab, select Line header to bring up Contour Lines dialog, select Link Line to Colormap Color check box. Click OK to close the dialog
In the Fill tab, clear the Enable check box.
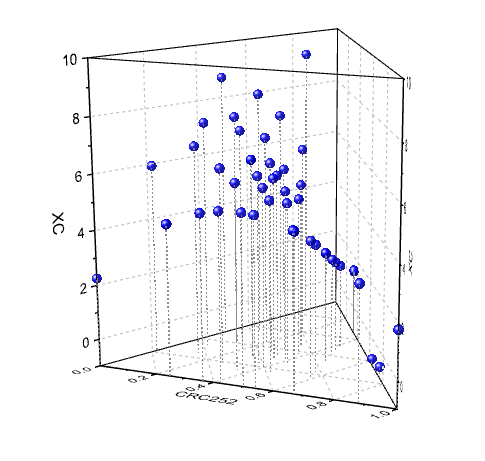
Graph 2 is a 3D Ternary Scatter Plot, to plot it
Go to the worksheet "3D Ternary Scatter" in Book1,
Highlight column C and D(already highlighted)
Select Plot: 3D Surface:3D Ternary Colormap Surface from menu
Double-click on the plot to bring up the Plot Details dialog, change Plot Type as 3D Scatter/Trajectory/Vector
You can customize/rotate this 3D Ternary Surface plot similarly to other colormap surface plots