...
- ColorMapped and Bubble plots would use categorical value legend by default.(ORG-7356)
Legend Context menu Improvements (ORG-9072)
...
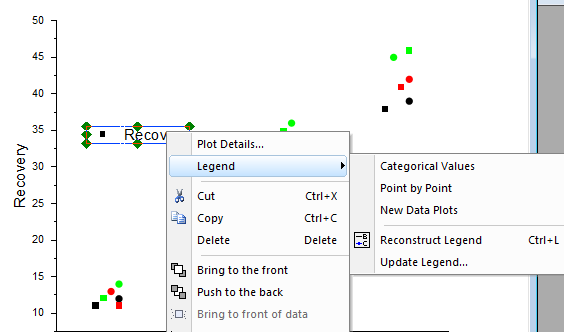
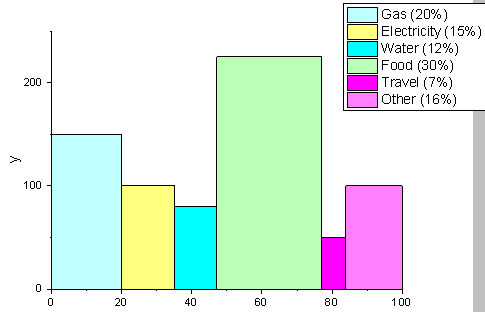
- Categorical Values:
If categorical data is present in a plot, a new context menu named Categorical Values will show. User can choose it to turn regular legend into Categorical legend. It was called Enhanced Legend in the past.


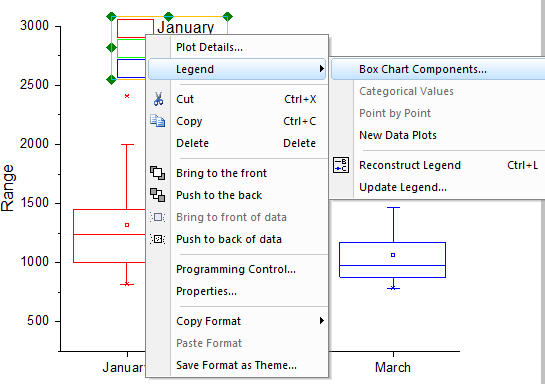
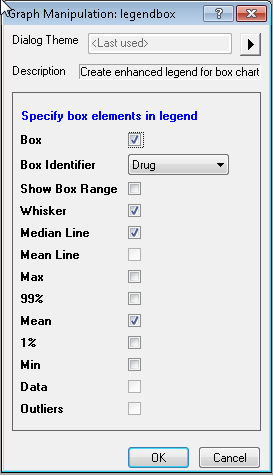
- Box Chart Legend
For box charts, the legend has a new context menu named Box Chart Components... which opens a dialog for user to customize the box chart legend.


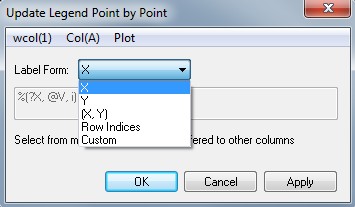
- Point by Point Legend
User can choose Legend: Point by Point context menu to show each point's information in legend in the following cases.- there is color/shape/interior Increment inside one data set, or direct RGB for color
- Using another column for color, sizing, shape, interior There is special points
- If there are more than one plot could be applied Point by Point type of legend, there will be a Legend for option to let user choose to show this type of legend for which plot.
- If choose Custom in Label Form, can use menus (wcol(1), Col(A) and Plot) to help build customized legend.
E.g.


Legend Custom Format Improvements (ORG-7650)
...
- provides a dropdown list populated with some substitution notation examples, such as @WM (worksheet comment); @WS_@LL, (Sheetname_ColumnLongName), etc.
- > button next to the combo box with common substitution notations and explanations. Every time user selects one, it will be appended to the end of the current format. This provides an easy way for user to choose useful info and then customize further.
- User-defined parameters will also show in this > list (ORG-9221).
Note:
- User can press F1 and then see more substitution notations in Help.
...
- The > button also exist in Update Legend dialog & Legend: Box Chart Components dialog, if setting Auto Legend Translation Mode or Box Identifier as Custom.

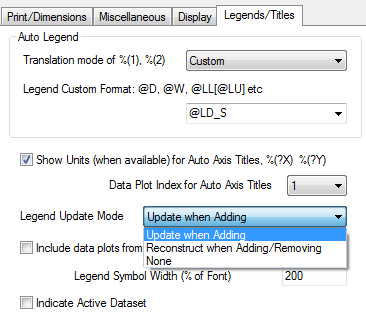
More Legend Update Modes on Legends/Title Tab (ORG-8707)
it used to be a checkbox to Auto Update Legend when Add ore Remove Plots. Now there are 3 options.

Data Plots for the Legend considers Subgrouping (ORG-9275)
...
When mousing over legend border, hand cursor will show so user can select the border and resize it.
Smartly exclude special point when displaying a data plot's legend (ORG-8496)
By default 1st data point's used to represent the data plot in Legend. In 9.1, if the 1st point is customized, 2nd point symbol will be used to represent the data plot.