(ORG-8520) ![]()
Sample OPJ to download to try: Marginal Histogram&Marginal Box Chart.opj
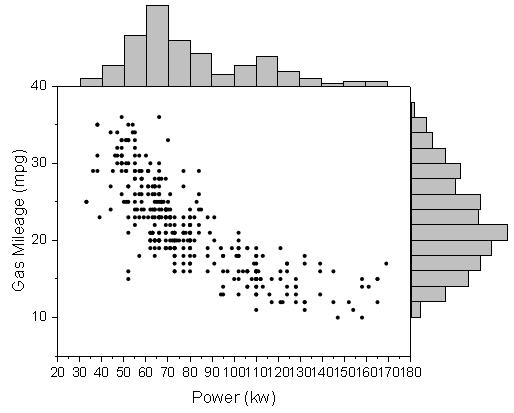
Marginal histograms and box charts have been added. These plots require two columns to be selected. Selection can be non-contiguous.
The menu items can be found under the Plot: Statistics menu entry. Toolbar buttons can be found in the Statistics group of the 2D Graphs toolbar.

|  |
|---|


| 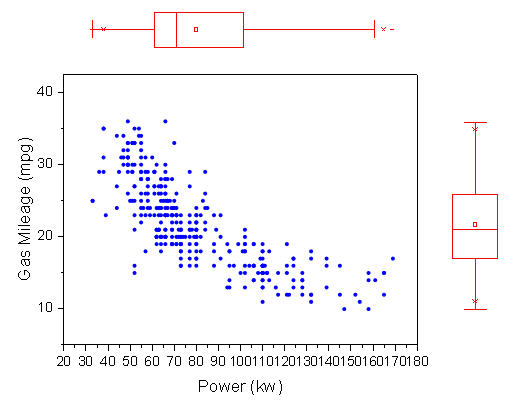 |
 | How to:1. Go to the workbook "automobile". 2. Highligh column C and F (X and Y columns). 3. Select Plot: Statistics: Marginal Histograms or Plot: Statistics: Marginal Box Charts from menu. |