Versions Compared

Key

  • This line was added.
  • This line was removed.
  • Formatting was changed.

(ORG-7889)(star)

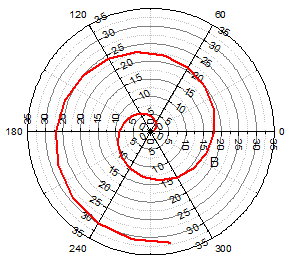
Product Page of Polar Plot

Sample OPJ to download to try:  Polar Graph.opj

Table of Contents

...
minLevel2


Customize Axes (ORG-5420,

...

ORG-8184)

...
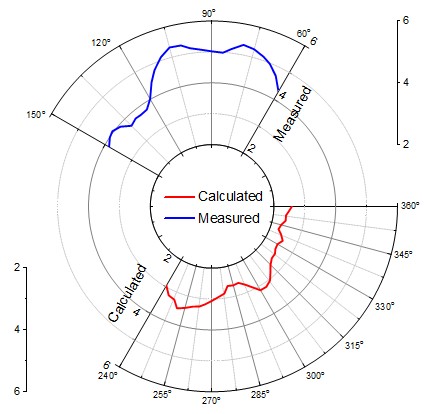
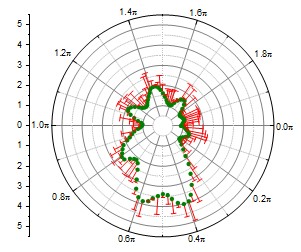
Remove azimuth Azimuth Azimuth Add custom radial buttom In first sample graph, Angles List = 0 90 180 270; or choose custom .


Image AddedImage Added
Image Added

Image Added

Image AddedImage Added

How to:

Turn on/off outer/inner angular axis and grid:

  1. In
  1. Angular Axes node in left panel, uncheck Show Outer/Inner Axis checkbox.
  2. In
  1. Angular Axes: Grids node, uncheck show checkbox for major or minor grids.

Change Radial axis Configuration:

  1. For first sample graph, select <major ticks> for Number of Axes in Radial Axes node.
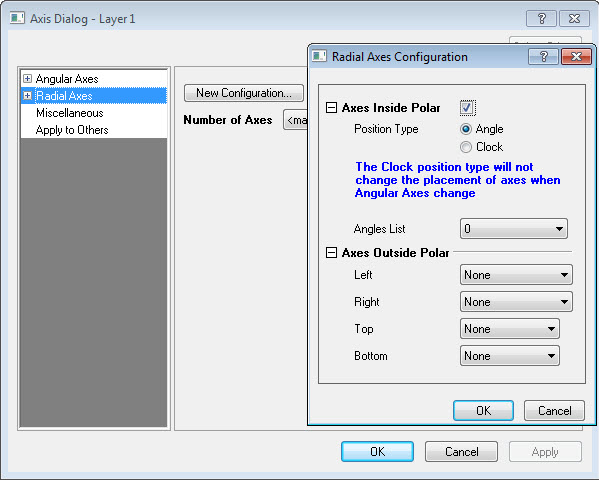
  2. In Radial Axes node, click New Configuration...
  1. button.
  2. Custom your inside/outside axis in the Radial Axes Configuration dialog.
  1.  
    You can also choose custom for Angles List and type in your desired angle with space separate.
  2. You can select each new generated axis node to customize further.
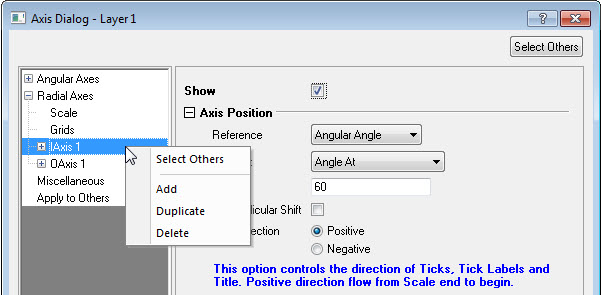
  3. You can also right click the left panel and select Add/Duplicate/Delete
  1. .

Customize Radial Axis:

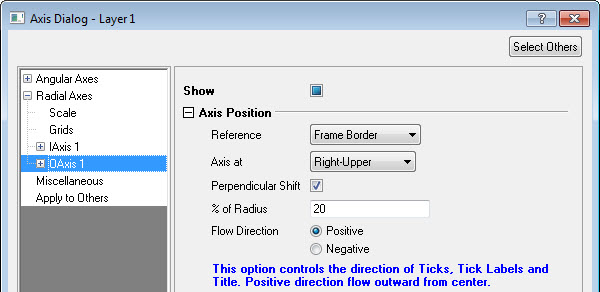
  1. Set axis position by OAxis #/IAxis # node. Node's name would change automatically with Reference.
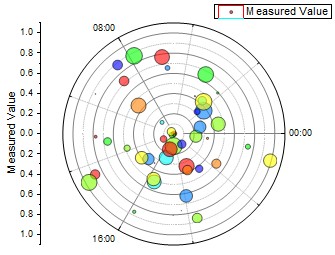
    For inner radial axis, we provide two different Reference methods: Angular Angle and Clock Dial.
    If you choose one radial axis's Reference to be Frame Border, it become a outer axis.
  2. Check Perpendicular Shift checkbox and set % of Radius value if you want axis offset.
  3. Select Flow Direction for tick and labels. See the hint below it with different Reference for more detail.

Different unit support for

...

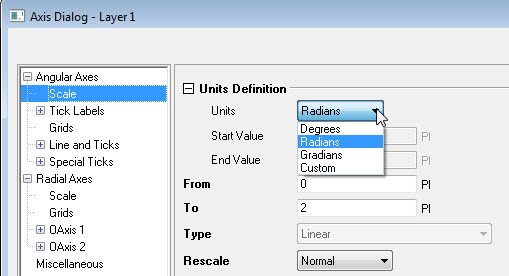
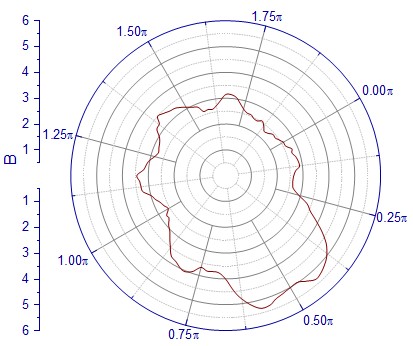
Angular axis (ORG-2267, ORG-8137)

Image RemovedImage AddedImage RemovedImage Added
Image ModifiedImage RemovedImage Added

How to:

In Axis dialog: Azimuth Angular Axes: Scale node. Choose Units dropdown list. It has Degree/Radians/Grdians/Custom options.

If you choose custom scale, you also need to specify the Start/End Value for a whole circle.

Flexible Start Angle&Orientation Combination (ORG-1796, ORG-8735)

Image RemovedImage Added

How to:

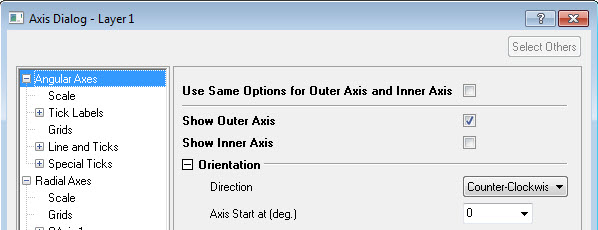
In Axis Dialog: Azimuth Angular Axes: Orientation.

Select Clockwise/Counter-Clockwise in Direction dragdown list.

Choose or input start angle in Axis Start at (deg.) dragdown list.

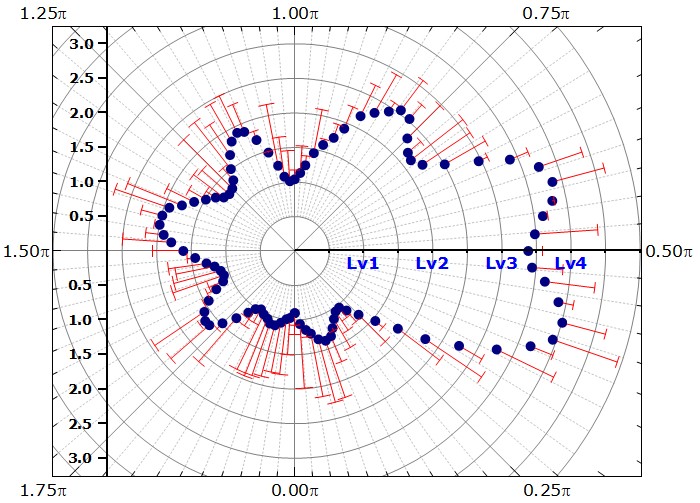
In this example, start angle is 30(deg.) and dirction is clockwise.

Image RemovedImage Added

Crop (ORG-5420)

Image ModifiedImage RemovedImage Added

Image Added

How to:

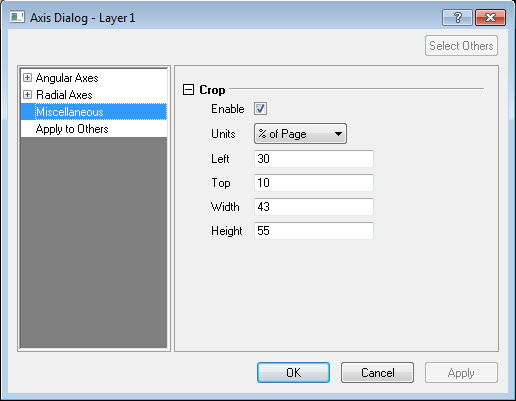
Go to Axis Dialog: Miscellaneous: Crop.

Check Enable checkbox and modify Left/Top/Width/Height to custom your display range.

New control features in

...

Angular grid lines (ORG-1796

...

, ORG-7946, ORG-7895)

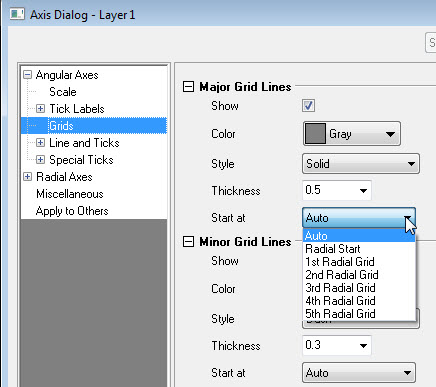
New GUI control to specify the reduction, for both major and minor grid lines. 

Azimuth


Image Added

How to:

  1. Go to Axis Dialog:
  1. Angular axes: Grids
  2. In Start at dragdown list, choose where you want your grids start from.

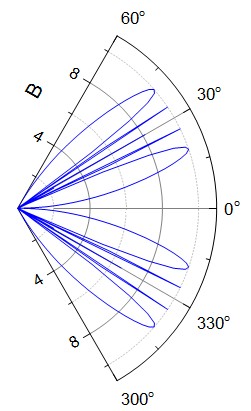
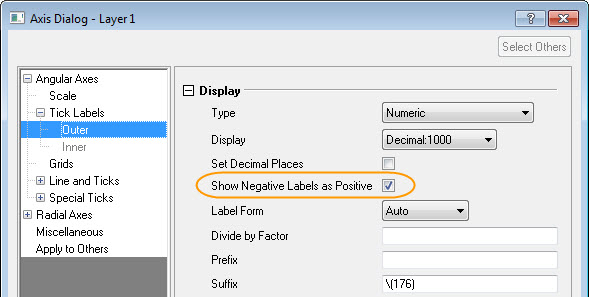
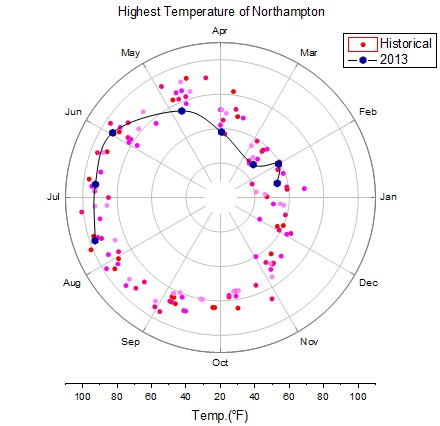
Support From value greater than To in angle axis and show negative labels as positive. (ORG-7892)

Image Removed
Image Added
Image Removed
Image Added
Image Removed
Image Added

How to:

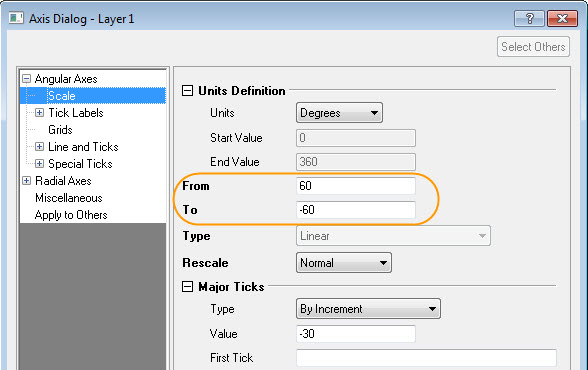
User can now set From value larger than To in Axis Dialog:

Azimuth

Angular axes: Scale now to easier custom the graph display range.

When you do this, if major ticks: Type is set to By increment, value should also be negative.


Check Axis Dialog:

Azimuth

Angular axes: Tick Labels: Outer/Inner, Show Negative Labels as Positive checkbox to let negative labels show as usual value.

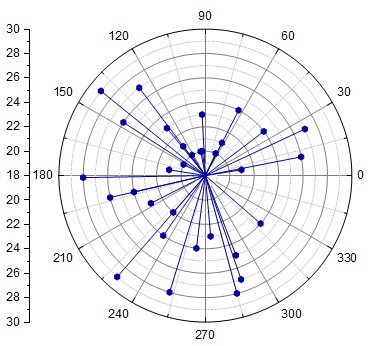
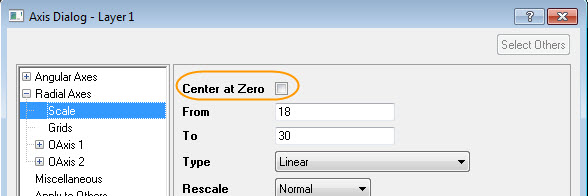
Center at zero on scale tab for Radial Axes (ORG-8552)

Image RemovedImage AddedImage RemovedImage Added
Image RemovedImage Added

How to:

In Axis Dialog: Radial Axes: Scale tab, uncheck Center at Zero checkbox to let all radial axis start at scale From value.

More than One Radial Axes (ORG-8596, ORG-8621)

Image Added

How to:

In Axis Dialog: Radial Axes tab, set the value (or <major ticks>) at the Number of Axes.

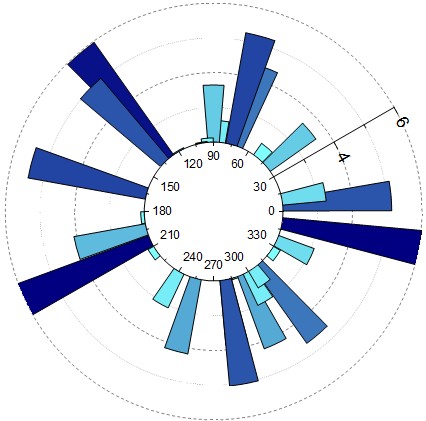
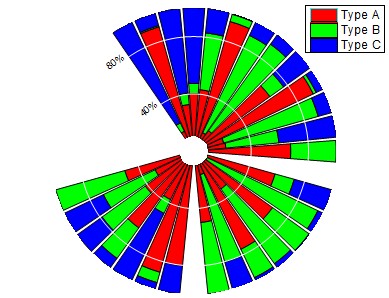
Polar Columns

Image RemovedImage AddedImage RemovedImage Added

How to:

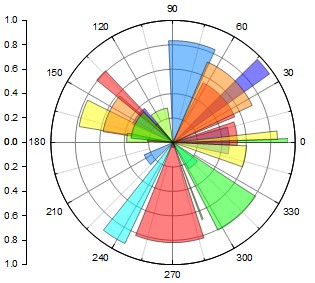
  1. After plot a regular polar graph, you can go to Plot Details dialog and change the plot type to be Column/Bar.

  2. To stack columns: go to Plot Details: Plot level Properties: Group tab, set Subgroup Size
    Then go to Plot Details: Layer level Properties: Stack tab, choose Offset to be Cumulative and check Use Subgroup (in Group tab) for Cumulative checkbox.
  3. To show grid line on top of data, go to Plot Details: Layer level Properties: Display tab, check Grid on Top of Data checkbox.
  4. In Plot Details: Plot Properties: Spacing tab, you can choose a column from the worksheet in Width(in %) dragdown list and let each column width indexed by it.

...