| Table of Contents |
|---|
...
| JIRA | Summary | Details |
|---|---|---|
| Export Geology Pattern as PDF EPS issues related to Third Party dll | We introduced Geology Pattern in Origin 2017 SR0 but the pattern failed to show in exported EPS and PDF files. Fixed in Origin 2017 SR1. The existing system variable @GDIPPM (GDIPlus pattern drawing mode) now has a new default value: 2, it means to use our new solution to fix the issue. | |
The length of grids and axis ticks seem to get shorter on the screen and in exported image in Origin 2017. | Before Origin 2017, axis line has rounded-end. If the line thickness is big, it doesn't look good. Therefore in Origin 2017 Sr0, we added square-ended support and set it as default. Corresponding system variable @lca=2. ORG-11202) Because of this change, the grids and axis ticks seem to get shorter on the screen and in exported image. Fixed in Origin 2017 Sr1 by changing the length of line segment especially in dash automatically. | |
| Sorting of Category values that are all numbers should sort as Nominal | In the past, Origin treated numbers in Categorical column as strings so they were sorted by alphabetical order, e.g., 1, 2, 5, 10 if sorted ascending will be 1, 10, 2, 5. In Origin 2017 Sr1, if all data in categories column are numeric, Origin will sort them as nominal, so 1, 2, 5, 10 if sorted ascending will be 1, 2, 5, 10. From now on, analysis and plotting involving categorical values should work correctly regardless what data are as long as you sort them. | |
| Text and graphic objects on worksheet was misplaced on PC with large DPI | In Origin 2017 SR1, DPI scaling will be taken into consideration when placing text or graphic objects on Worksheet. you can also easily see this by adding a text to the right and attached to page, and then change DPI scale to 200%.
|
Graphing
| JIRA | Summary | Details |
|---|---|---|
| Contour Profile failed to update with change of data | After plotting Contour Profile, if user delete data, or change some data values, the profiles failed to update before Origin 2017 SR1 Note: This update only works with Image/Contour Profile tool on. If you have closed Contour Profile tool so only Profile... button shows in graph, change in data will not update profiles. | |
| Graph in .org file (old Project file format) failed to show | Open org (old project file format) in Origin 2017 sr0. Graphs failed to show. Fixed in Origin 2017 SR1 | |
| Runtime error when right click column header in middle panel of Plot Setup dialog | New issue in Origin 2017 Sr0. Open Plot Setup dialog. Fixed in Origin 2017 SR1 | |
| Use XYZ column dataset plot contour lead crash in Origin 2017 | Highlight XYZ column to plot Contour ==> The project file crash. | |
| Column/Bar graph with variable width failed to draw width correctly for large X scale. | E.g. if X value (position of columns is e.g. 1e6, .... ) and on Spacing tab of Plot Details, set column bar width to be based on 3rd column with big values. Set Scaling Factor to 0 (Use X Unit). The column bars becomes narrow lines. | |
Origin crashes when deleting plots from graph | New issue in Origin 2017 Sr0. Remove 1st plot in graph such as via in Plot Setup or Layer Contents, Object Manager, etc., ==> Origin crashes. Fixed in Origin 2017 SR1 | |
| Error message prompt when set axis scale as discrete for some data | 1. New a wks and fill it with the following data: 1 1 5 2 12 3 14 4 2. Highlight the whole wks and make a scatter plot. 3. Open Axis dialog and go to Scale tab. Set scale type as discrete and click OK. ==> Error message prompt: Encountered an improper argument. And graph becomes blank. Note: 1. The problem exists since Origin 2016 SR2. 2. The problem would not show for some other data. | |
| Extreme Slowdown in Workbook Calculations in Origin 2017 SR0 | Customer found this http://www.originlab.com/forum/topic.asp?TOPIC_ID=22972 but it also make workbook cell data auto update when link source changed, which is fine, but the checking for workbook will slow down Origin heavily, especially for user's opj. So in Origin 2017 SR1, a new system variable is added to control this behavior: @RSL. It combines with 2 bits: 1 for graph, 2 for workbook. Default is 1. Set as 0 can rollback to same as Origin 2016. | |
| Text label is placed at incorrect positition in 9.4 SR0 | Add some text label in Origin 2016 or earlier by the following code. xpos_string=0.424; label -s -a xpos_string 80 -j 0 -n TEST3 TESTLabel; TEST3.rotate = 270; TEST3.X=; Open it in Origin 2017 Sr0. The text position changed. This is because we added we include frame when deciding where the text label anchor point is in Origin 2017 Sr0. In Origin 2017 SR1, system variable @TCC is added and set to 0 so Anchor on Frame is off. This way text object created in Origin 2016 or older will not change position. | |
| Failed to set line with 0 width to make it disappear in graph | E.g. Plot an area graph and on line tab, set line width to 0. Line still showed. This is newly broken in Origin 2017 Sr0. Fixed in Origin 2017 SR1. This also exists in line plot, fill area, and stacked area plot, etc. | |
| Fill Area Under Curve->Fill to next data plot - Above Below Colors is broken when duplicate X values exists | This was a limitation since the pattern above and below feature was introduced in Origin 9.1. We only allowed monotonic data. Removed the limitation in Origin 2017 SR1. | |
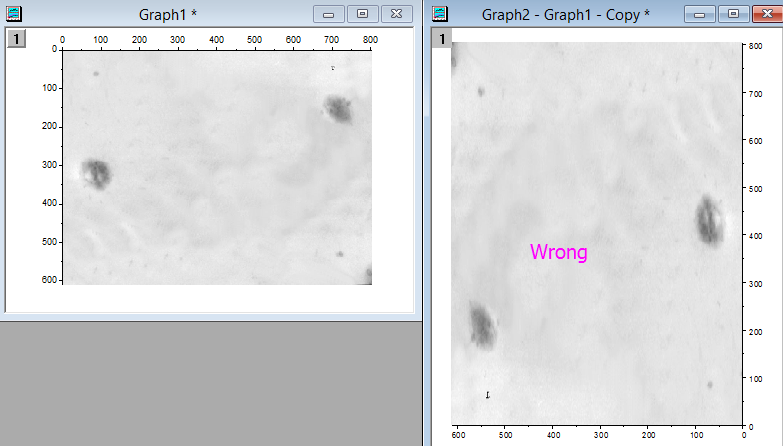
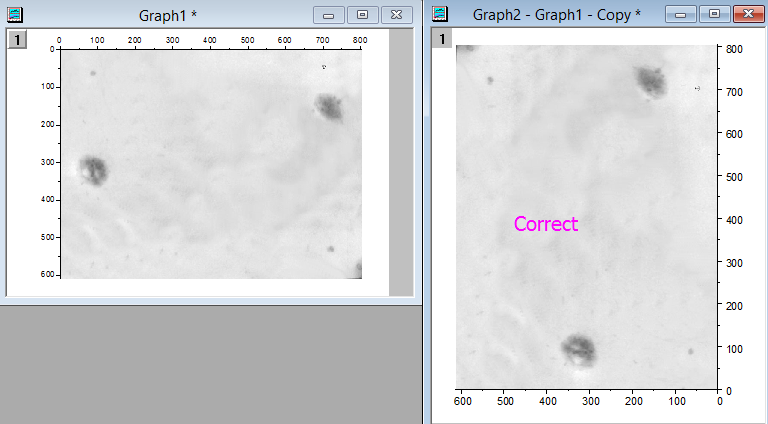
| Image Plot displayed wrong after Exchanging XY Axes | Reported on forum http://originlab.com/forum/topic.asp?TOPIC_ID=22852 Import Image file into Origin and choose Plot: Image Plot. Then choose Graph: Exchange X-Y Axes, ==> Result is wrong since Origin 8.1
Fixed in Origin 2017 SR1. Expected result
| |
| Crash when using large dimension matrix data as colormap value and Fill color with piece by piece mode | 1. New a matrix with 2 objects, set dimension as 1024 * 1024. Note: This problem exists since 92Sr0. Fixed in Origin 2017 SR1. | |
| Fill Area and Line plot draw differently since 2017 sr0 | New issue in Origin 2017 Sr0 but hard to reproduce. The problem could be gone if set @dm=0. Fixed in Origin 2017 SR1.
| |
| 3D XYZ Bar width is too thin for certain data | When deleting some data, all 3D bars became very thin and only gray lines show. This existed since Origin 9.0 and fixed in Origin 2017 SR1. New System Variable is added. @OGLBWF, XYZ Bar width calculation factor, default value is 2, if gridding result >= factor * datasize, we will reset to default size (sqrt(datasize) or datasize if too small). | |
| Issues when customizing same single Point on a plot that is plotted twice | Origin can't add two data labels to one plot. E.g. User as column A(X), B(Y) and other column C for label. If user wants to show both Y values and column C labels in the graph, user has to plot the B data twice. And for each plot, enable Labels, with one label from column C and one label from Y value. Sometimes the data labels overlap so user may need to adjust position of certain label. E.g. Ctrl+select a data label to select it and move it. Before Origin 2017 SR1, the other label of the same data point were moved as well. | |
| Color scale fails to generate for contour plot with colormapped line only | User can customize contour plot to hide color fill and only show colormapped line by
Before Origin 2017 SR1, color scaler failed to show for such graph. | |
The length of grids and axis ticks seem to get shorter on the screen and in exported image in Origin 2017. | Before Origin 2017, axis line has rounded-end. If the line thickness is big, it doesn't look good. Therefore in Origin 2017 Sr0, we added square-ended support and set it as default. Corresponding system variable @lca=2. ORG-11202) Because of this change, the grids and axis ticks seem to get shorter on the screen and in exported image. Fixed in Origin 2017 Sr1 by changing the length of line segment especially in dash automatically. | |
Deleting a Plot From Graph with text object as legend causes crash in Origin 9.4 | New issue in Origin 2017 Sr0.
==> Origin crashes. Fixed in Origin 2017 SR1 | |
| Position Offset Values Not Saved to Annotation Default | Annotation position control is added in Origin 2017 sr0. But the Offset values of annotation position failed to be saved as default for future use. Fixed in Origin 2017 Sr1. |
...
| JIRA | Summary | Details |
|---|---|---|
| Origin crashes when copy long formula from F(x) cell | The crashes happens since Origin 2016 Sr0. It's fixed in Origin 2017 SR1. | |
| Set Column Values Issues with the introduced Spreadsheet Cell Notation in Origin 2017 Sr0. |
| |
| Sorting of Category values that are all numbers should sort as Nominal | In the past, Origin treated numbers in Categorical column as strings so they were sorted by alphabetical order, e.g., 1, 2, 5, 10 if sorted ascending will be 1, 10, 2, 5. In Origin 2017 Sr1, if all data in categories column are numeric, Origin will sort them as nominal, so 1, 2, 5, 10 if sorted ascending will be 1, 2, 5, 10. From now on, analysis and plotting involving categorical values should work correctly regardless what data are as long as you sort them. | |
| Text and graphic objects on worksheet was misplaced on PC with large DPI | In Origin 2017 SR1, DPI scaling will be taken into consideration when placing text or graphic objects on Worksheet. you can also easily see this by adding a text to the right and attached to page, and then change DPI scale to 200%.
| |
| Delete a column with formula and Undo failed to work | Undo only worked for column without formula in the past. Now in Origin 2017 SR1, even if a column is created by set column values formula, delete it. Undo works. |
...