...
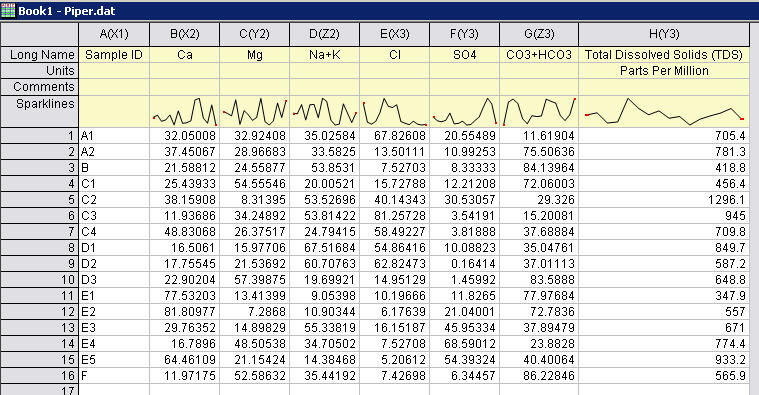
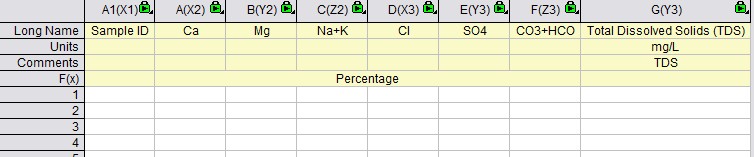
- Data must be organized in Ca, Mg, Na+K, Cl, SO4, CO3+HCO3 and in XYZXYZ column designation. TDS column is optional.
- Data must be percentage to plot Piper Diagram.
  |   |
  |
How to
Sample OPJ to download to try: Piper_Diagrams.opj
- Activate to Book1 and highlight through column B to G, select Plot:Specialized:Piper

 to plot Piper diagram.
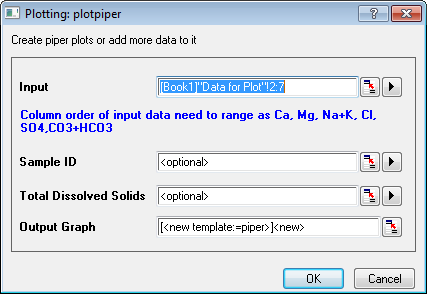
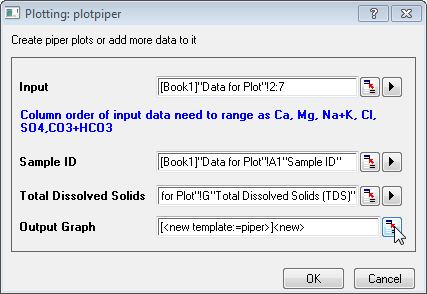
The following dialog will open for user to specify Sample input data, sample ID and TDS.- The selection before openning the dialog will be put in Input box.
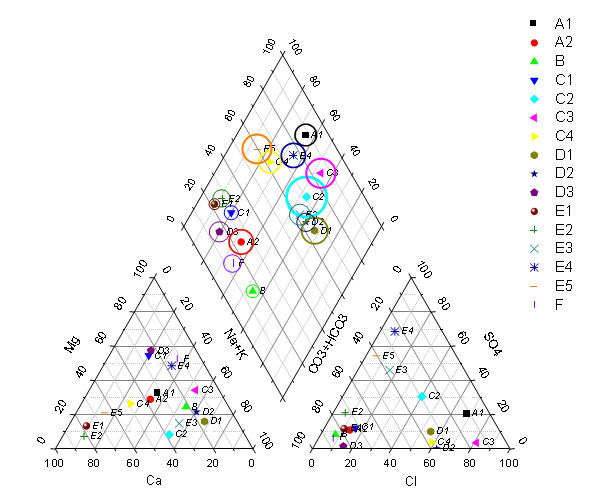
- Sample ID is optional. If Sample ID is specified, then it will be used as symbol color indexing and shape indexing. If not specified, then row indices will be used as color and shape indexing.
- Total Dissolved Solids (TDS) is also optional. If it's specified, an open Circle will draw around the symbol, with TDS column as size indexing.

Built-in Workbook Templates to Convert MEq/PPM to Percentage
There are 3 built-in worksheet templates to convert MEq, mg/L and PPM data to Percentage. Select File: New: From template and choose applicable template.
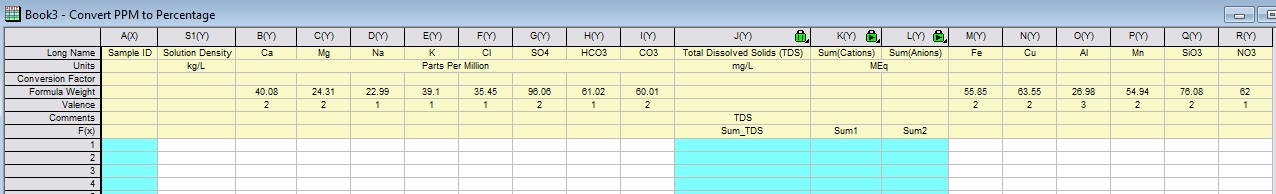
PPM to Percentage

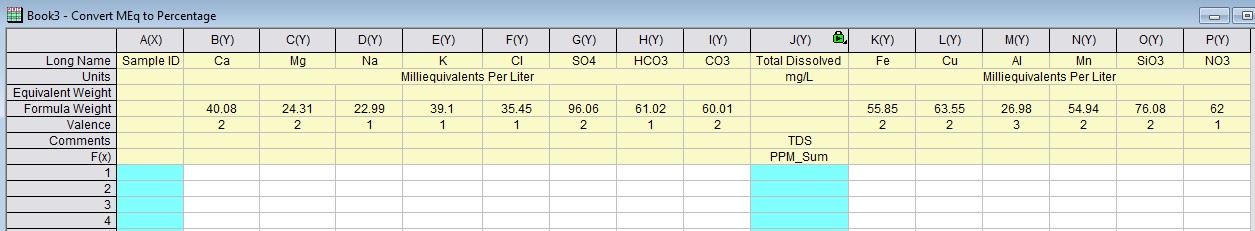
Meq to Percentage

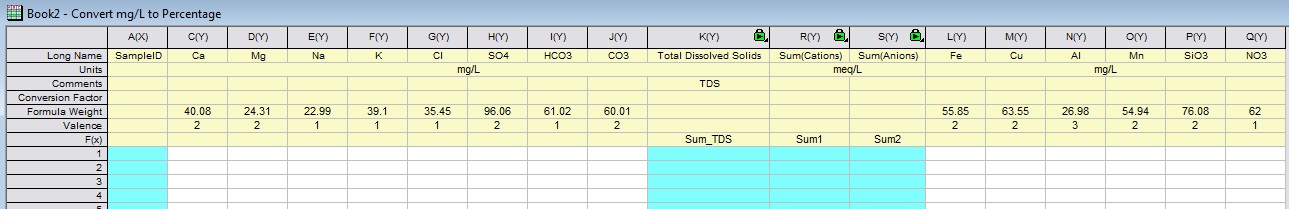
Mg/L to Percentage

Fill Values to Concentration Sheet, Percentage Sheet will be calculated automatically.Then use the Percentage Sheet to plot Piper/Trilinear Diagram.

Easy way to add/remove plot and customize Piper Diagrams
...
- select the new percentage data in XYZXYZ columns first.
- Click Plot: Specialized: Piper Diagram... menu or button again. Specify Input, Sample ID and TDS as needed.
Note: Selected SampleID and TDS must have the same range as input data. - Click Select Graph button

 next to Output Graphs edit box.

--> A Select a Graph window will show.
4. Click an existing Piper Graph window to select it.

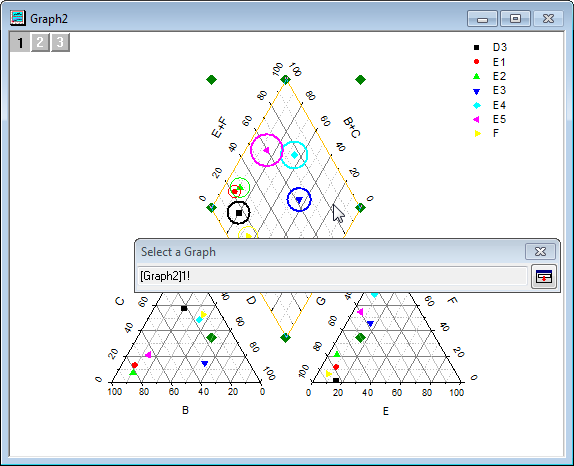
5. Click the button in Select a Graph window to go back to the dialog.
...