Graphing
New Graph Types
...
JIRA | SUMMARY | DESCRIPTION | DETAILS |
|---|---|---|---|
ORG-23858 | Eyedropper on Select Color Control | Eyedropper under Custom group of color control to pick color on screen | Use eye dropper button to create user-defined colors 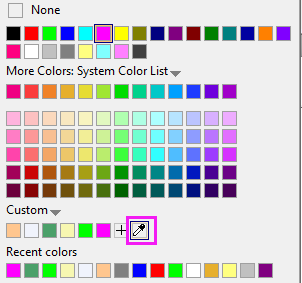 |
ORG-23342 | Show data requirement for templates under main Plot menu | Redesign the tooltip for all templates under main Plot menu to how to arrange data for each graph template. Add basic instructions on some graph templates | When mousing over a plot type under Plot menu, data requirement etc. will show as tooltip 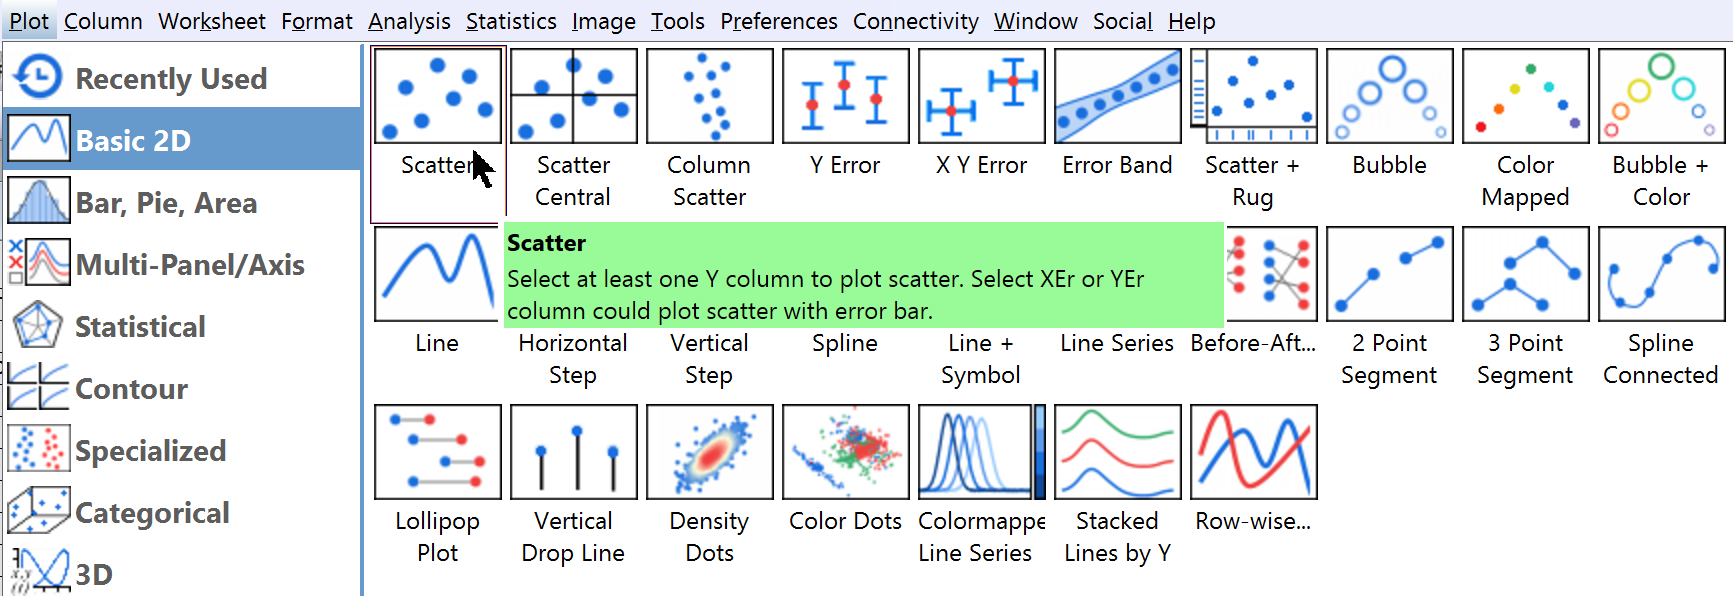  |
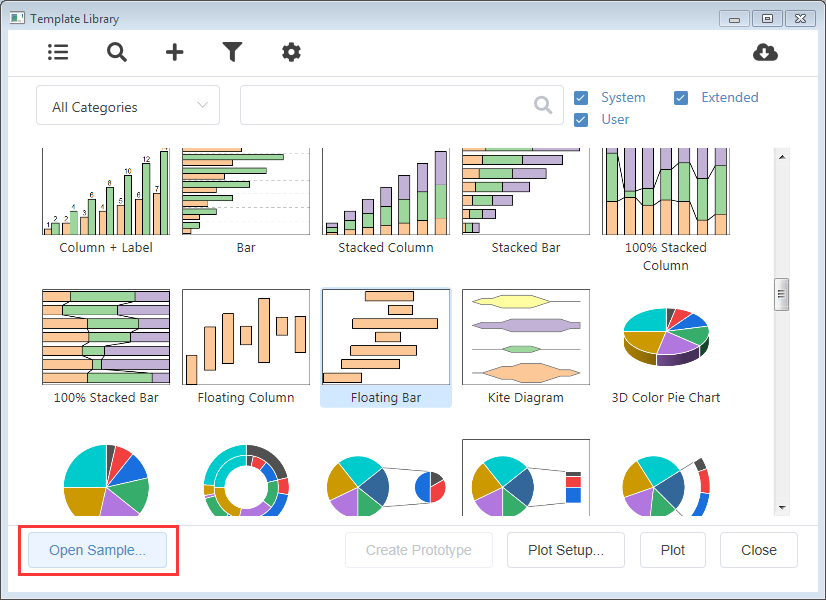
ORG-23754 | Add System Template to Template Library | Support all system template in Template Library, check System checkbox, all system template will show, select one and click Plot menu to plot. | Template Library used to show user-defined graph template only. Now System (built-in) graph template can be listed here as well. 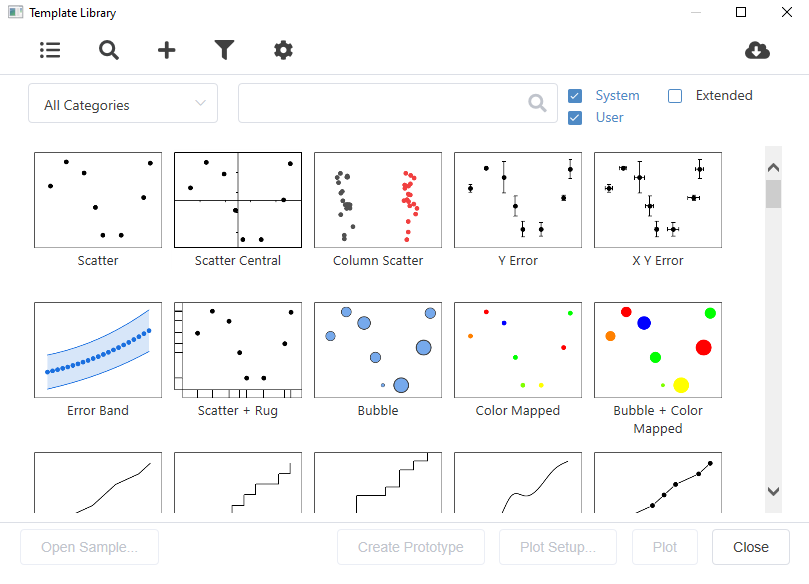  |
ORG-23849 | Extended Graph Templates | More than 40 extended graph templates are added to extend Origin’s graph capabilities | Select Tools:Template Center to view and download those cloud templates. Once downloaded, the graph templates can be accessed by Plot: Template Library dialog  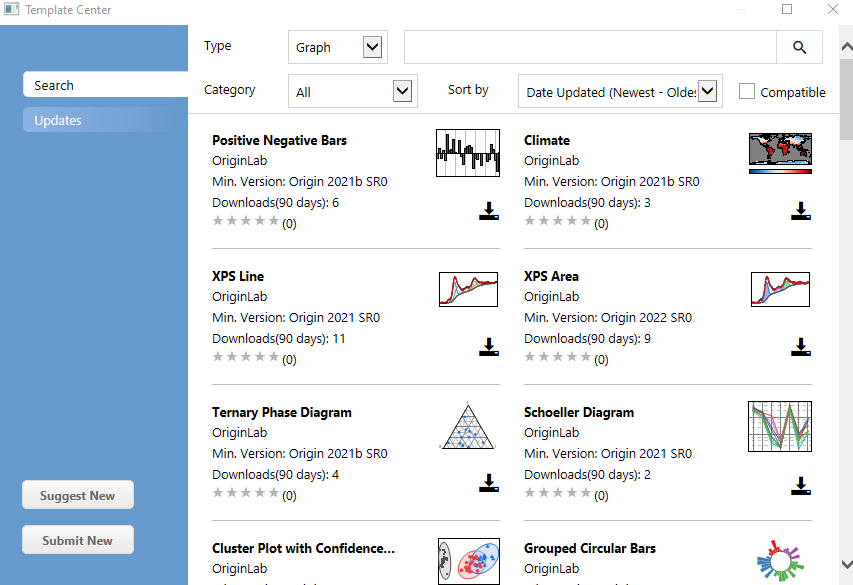 |
ORG-23660 | Provide sample project for system and extended templates in Template Library | Use Open Sample button to open sample project for system and extended templates |
 |
ORG-24044 | Allow deleting Extend Template from Template Library | Support Deleting Extend Template from Template Library and New Book dialog | Extend Template can be deleted in manage mode. After Extend Template is deleted:
|
ORG-21139 | Mini toolbar for data highlighter | Mini toolbar to create sub sheet, delete points, mask/unmask highlighted points, and mask/unmask dimmed points. | 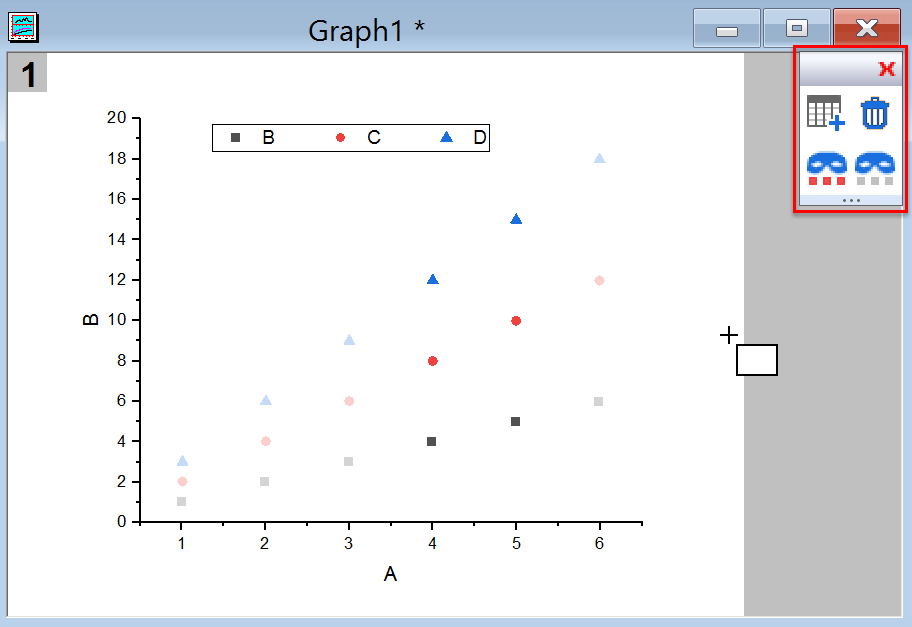 |
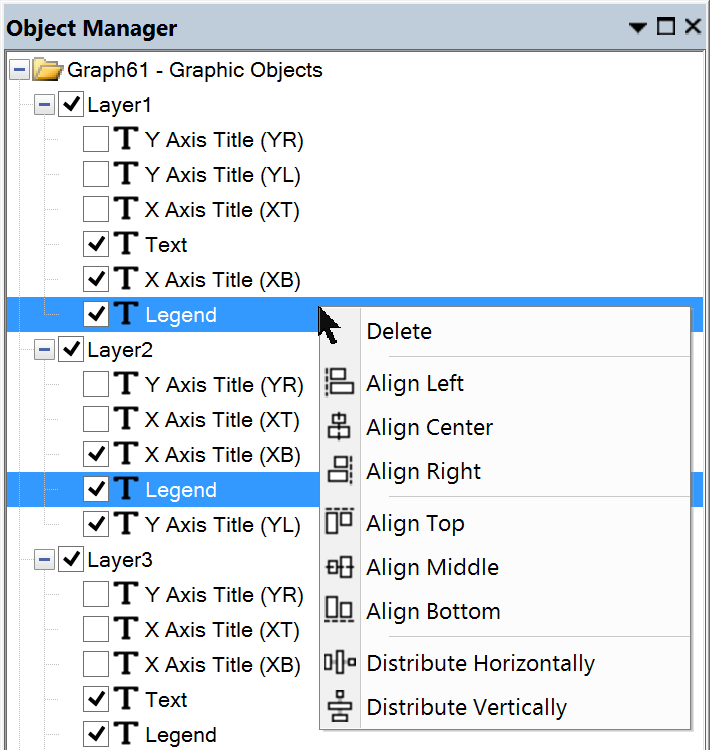
ORG-20667 | Show Mini toolbar in Object manager | Mini toolbar based on selection in Object Manager | Sometimes selecting plot, layer, etc. in graph can be hard. In such case user can pick layer, plot, etc. in Object Manager, based on the selection, mini toolbar will show for quick edit. 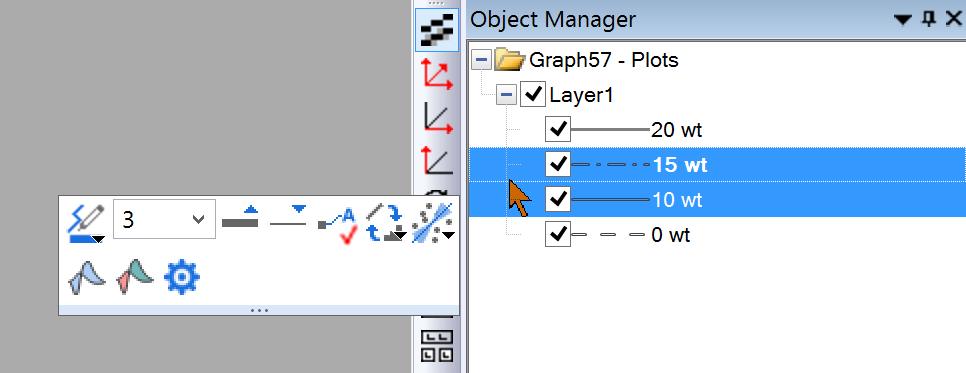 Use System variable @mth to turn off |
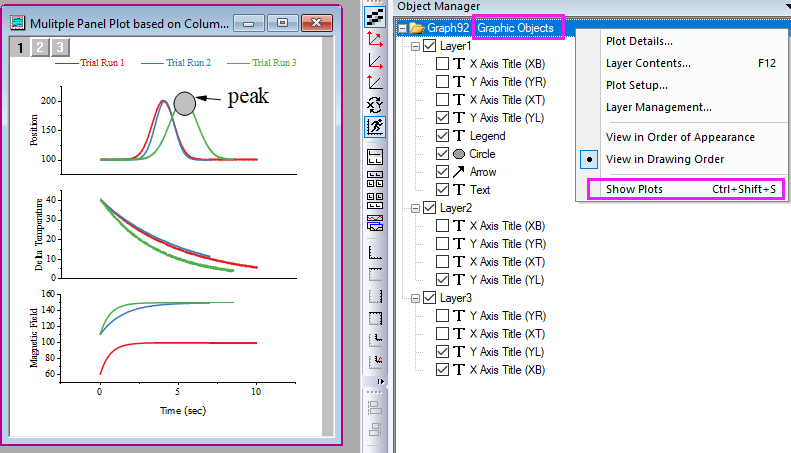
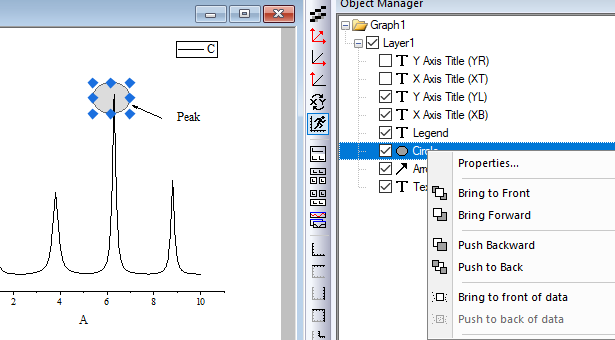
ORG-23882 | Show Graphic Object in Object Manager | Use Object Manger to turn on/off graphic object and change its drawing order | Show Graphic Object /Show Plots toggle (Ctrl+Shift+S) in Object Manager. In Graphic Object mode, user can
|
ORG-23883 | Support Object Manager for Layout Windows | All graph objects can be easily selected in Object Manager, and do further setting like group, align or move the graph object to change its order. | 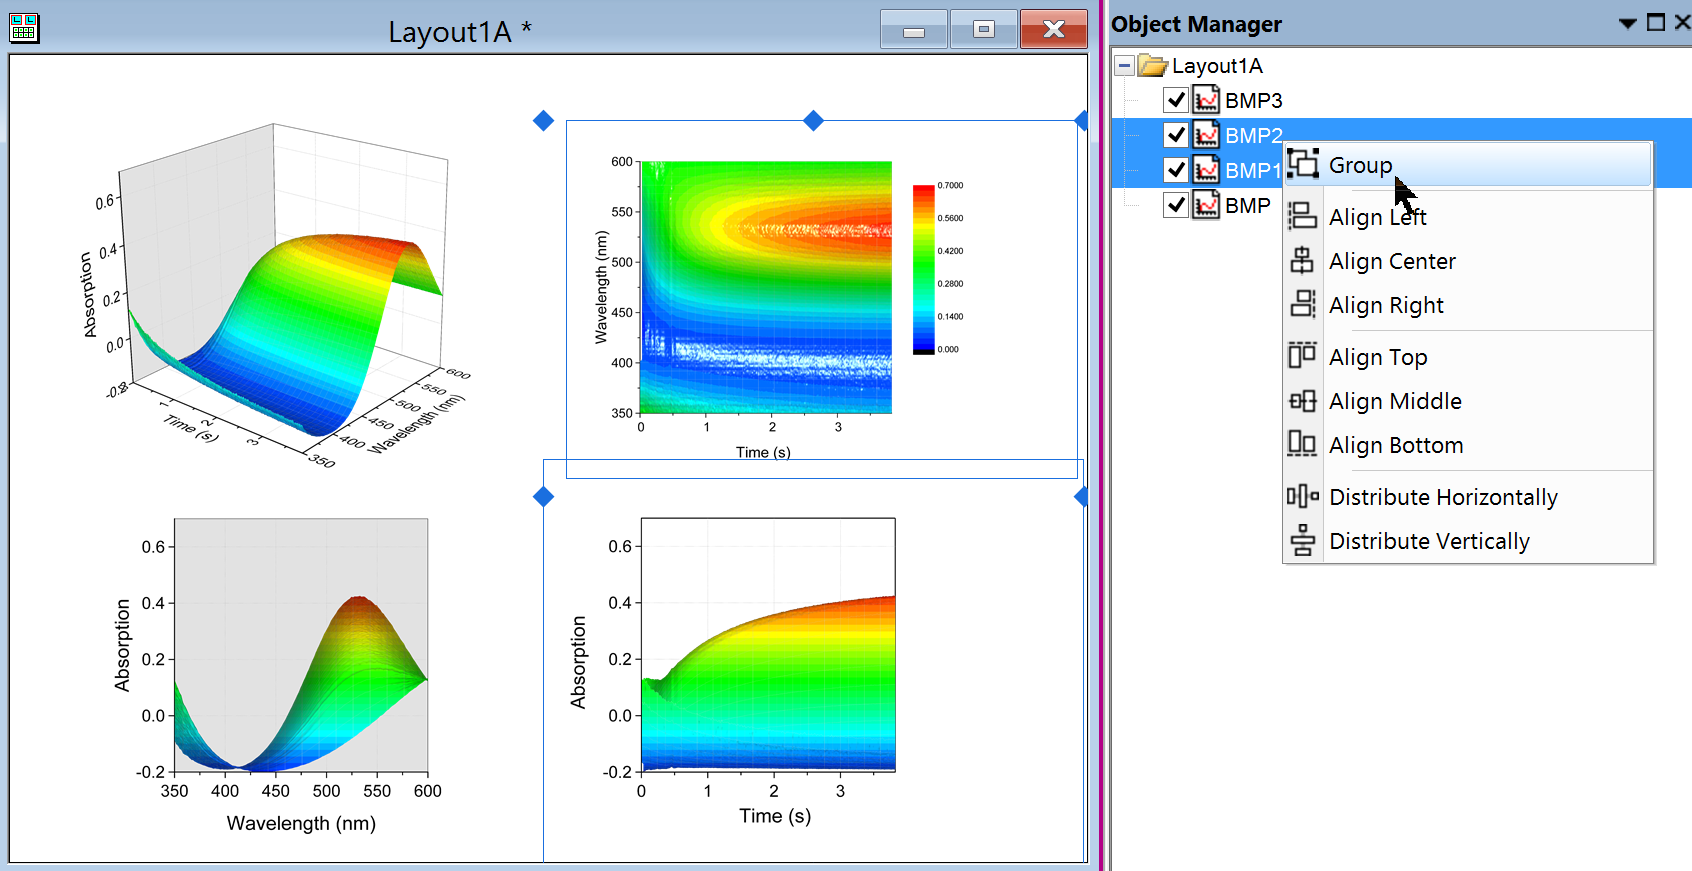 |
ORG-24086 | Customize Page Grid Settings | Make it easy to customize page gridding to easily arrange layers and objects in graph and layout window | Two ways to set Page Grid Settings.
Set the offset and horizontal/vertical spacing of grids in cm or inch. 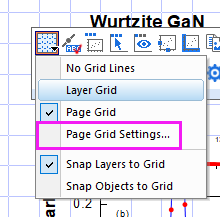 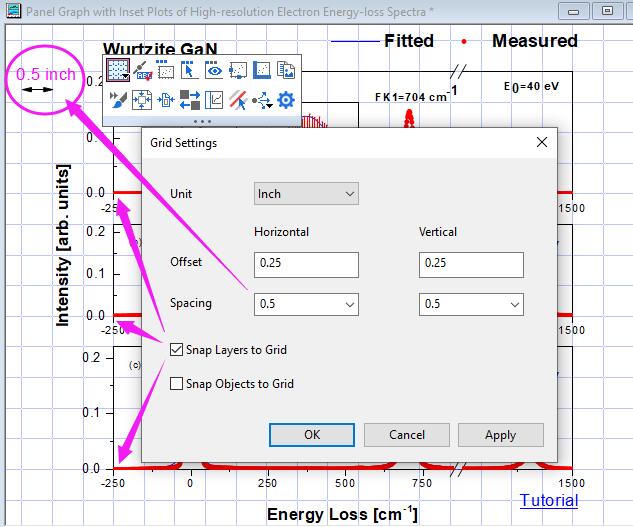 System variables to set grid colors:
Note: the 4th argument in color() function must be 1 to set these system variable with RGB colors. |
ORG-24028 | Graph Annotator | Draw Data tool and Data: Graph Annotator… will use this new tool to pick screen points in graph | Different Add Data mode are supported 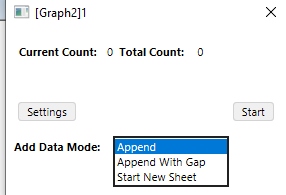 The picked points will be put to Graph Annotator Data book. Set @MDT=0 to revert back to use old tool to draw data. |
ORG-23943 | Adjust windows size and position in Origin according to screen resolution and DPI | Resize and reposition windows to make it display the same layout in workspace in different resolution and DPI by system variable @SRWS | System variable @SRWS 0 (default), old way, means display different layout (both width and height) for project saved and open in different resolution and DPI 1: fit the width, and scale y with x scale; 2: fit the height, and scale x with y scale; 3: fit the width and height, means display same layout (both width and height) for project saved and open in different resolution and DPI |
...
JIRA | SUMMARY | DESCRIPTION | DETAILS |
|---|---|---|---|
ORG-23919 | Simpler Arrange Layers tool | New simplified dialog to change graph to mxn layers | Arrange Layers… is added in Graph menu, layer icon context menu, , graph node context menu of Object manager and page level menu toolbar. Select it will open a dialog to arrange layers in current graph into mxn layers 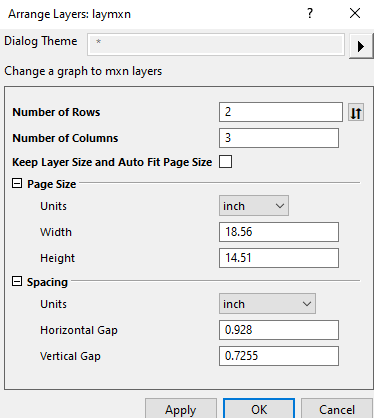 |
ORG-23920 | Spacing improvements in Merge Graphs and Layer Management dialogs | More Spacing units are added in Merge Graphs and Layer Management dialogs | There was only % of page when setting spacing when merging graphs or arrange them in existing graph. More units are added in Origin 2022 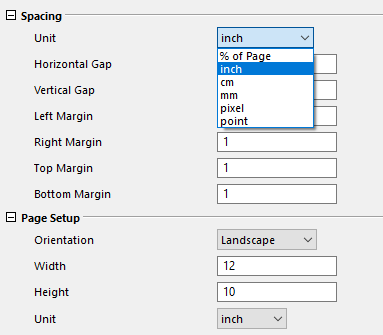 |
ORG-21918 | Select Multiple Plots | Select multiple plots in graph window to edit together | How to select multiple plots:
After selection, use toolbar or mini toolbar to edit them. Note: mini toolbar only shows if all selected plots share the same plot type. 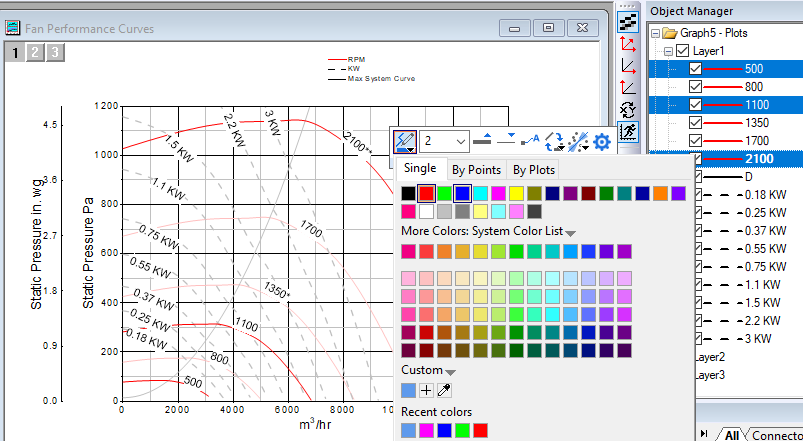 In Object Manager, user can also right click for show/hide, remove, etc. 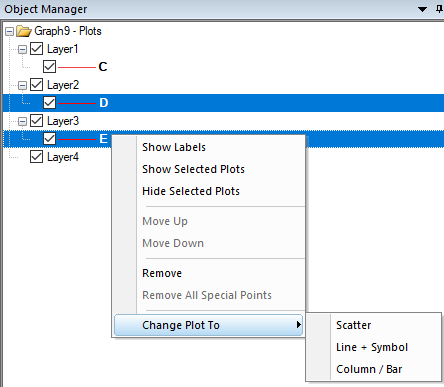 In Object Manager, after selecting multiple plots in same layer, user can press Alt key and drag to change plot order. This way, the plots will draw on top of bar. 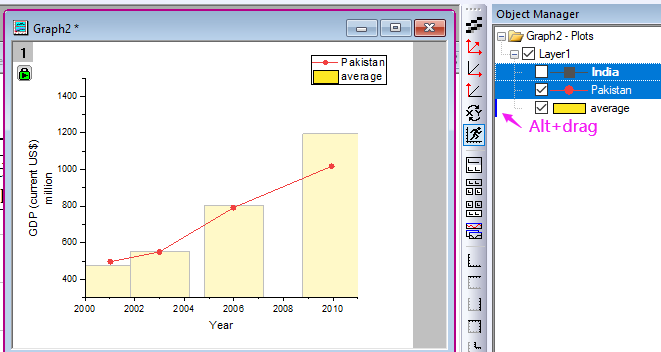 |
ORG-23818 | Scatter Plot Symbol Improvements | User-defined symbol improvements |
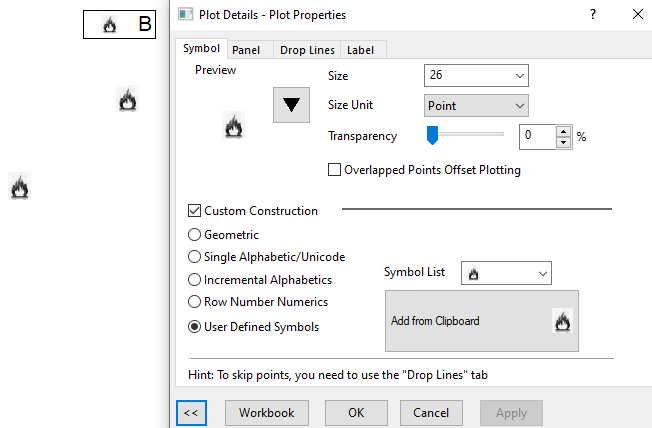
E.g. in Preferences: Options dialog. Go to Graph tab. Choose a blank grid in User Defined Symbols. Ctrl+F to select SVG file and then use it for scatter symbol. 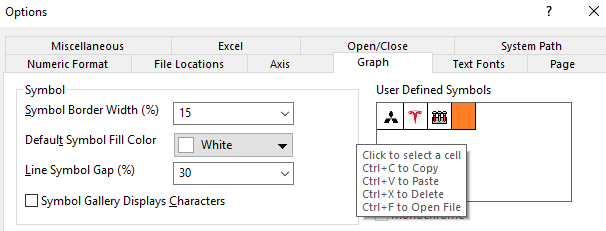 |
Y Value Colormap also support for ungrouped plot | Now Origin support Y value Colormap for single plot. | In the past for single plot, or multiple plot but ungrouped, user couldn’t set Y Value colormap. It’s supported in Origin 2022 now. | |
ORG-23102 | Data Plot legend use default symbol size in bubble graph | Use default symbol size for data plot legend in bubble plot | We used to show 1st point’s symbol in data plot legend of bubble graph. For graphs with multiple bubble plot, some plot’s first symbol size may be very small and hard to be seen in legend. So we changed in Origin 2022 to show same symbol size for data plot legend in bubble graph. |
ORG-22094 | Insert Map To Graph | Support World Map on range (0 360) and add Europe Map | In Origin2021b, we support Insert World Map on range (-180 180), in Origin2022, support World Map on range (0 360) Support Europe Map if in the range of European latitude and longitude |
ORG-23815 | Improvements to adding Function Plots | Insert: Function Plot will open Create Function Plot dialog to add multiple function plots to current graph window | 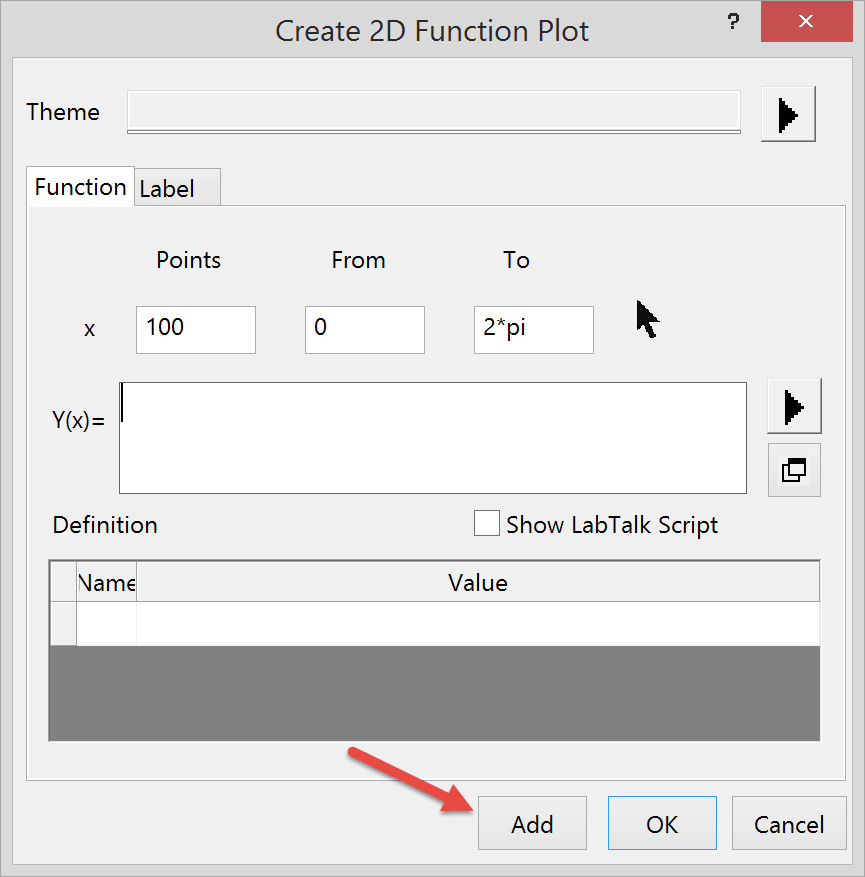 |
ORG-23448 | Gradient fill for drawing object such as rectangle and circle | Support gradient fill for Rectangle, Circle, Polygon and Region tool. | 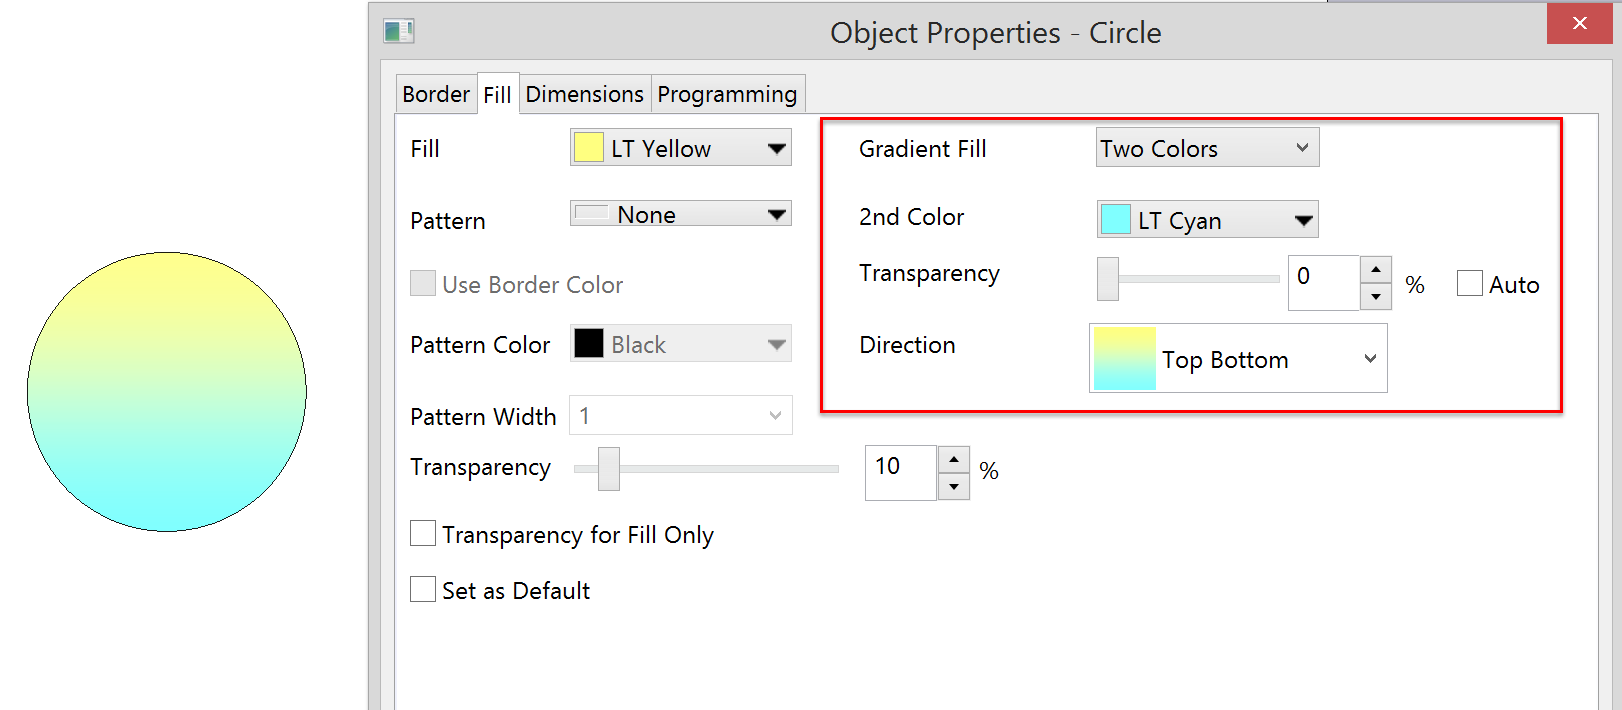 |
Insert SVG Image to graph | Support inserting SVG image to graph | Choose Insert: Image From Files… menu to insert *.SVG image to graph or layout window. | |
S3 | Paste PNG to Origin Graphs | Paste PNG to Origin Graphs, by default "keep aspect ratio" will be checked. | In earlier Origin versions, Paste PNG to Origin Graphs, by default "keep aspect ratio" is unchecked. In Origin 2022, it will be checked by default. |
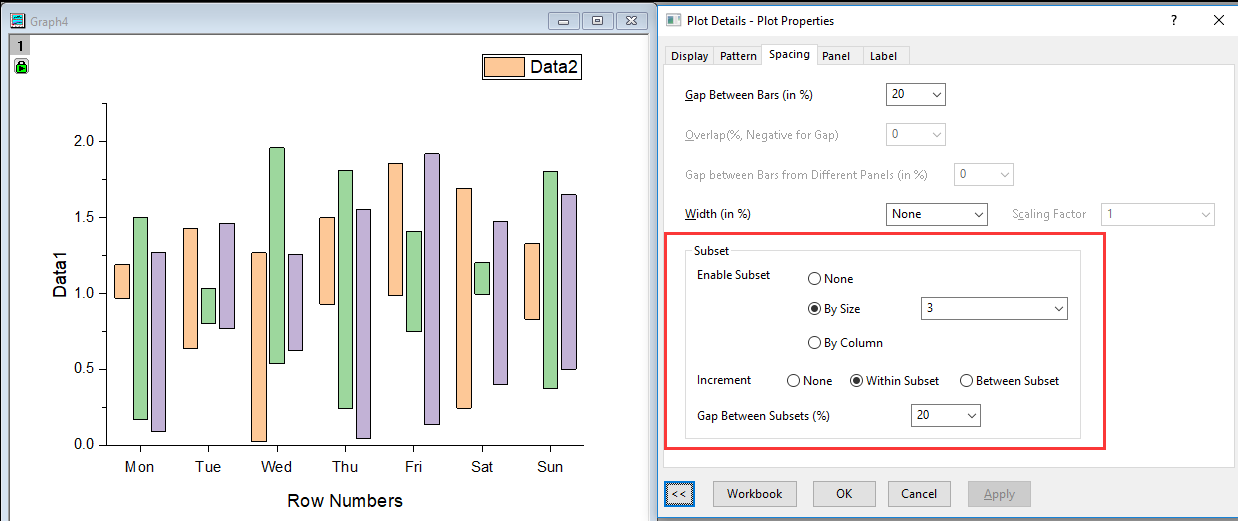
Support Spacing Between Subsets For Floating Column/Bar Plot | New Graph template Grouped Floating Bar allowing setting space between groups of floating bars/columns. |
| |
ORG-23686 | Make it easier to edit legend margin in 3D graphs | Click border of legend in 3D graphs same as the one in 2D graphs | When mousing over border of legend in 3D graph, the cursor will change into hand shape. Click it enter edit margin mode. Drag border to adjust margin. |
ORG-17261 | Fill pattern for 3D bars | Set Fill pattern on Patterns tab of Plot Details dialog | 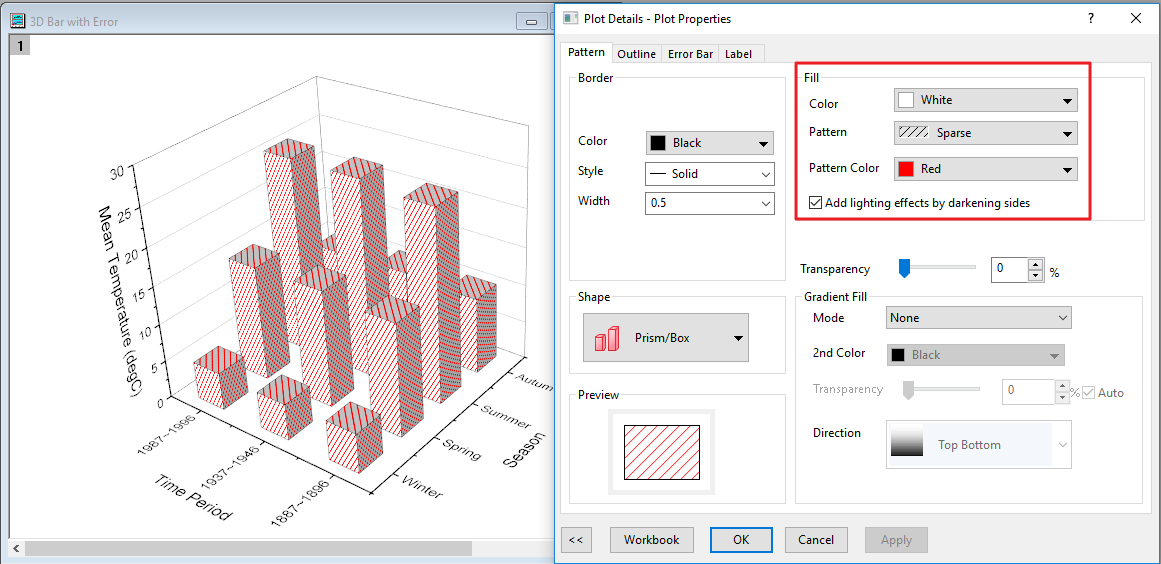 |
ORG-22963 | 3D Bar from Top plane | Support Maximum as Base Plane | There were only Zero and Minimum in the past. 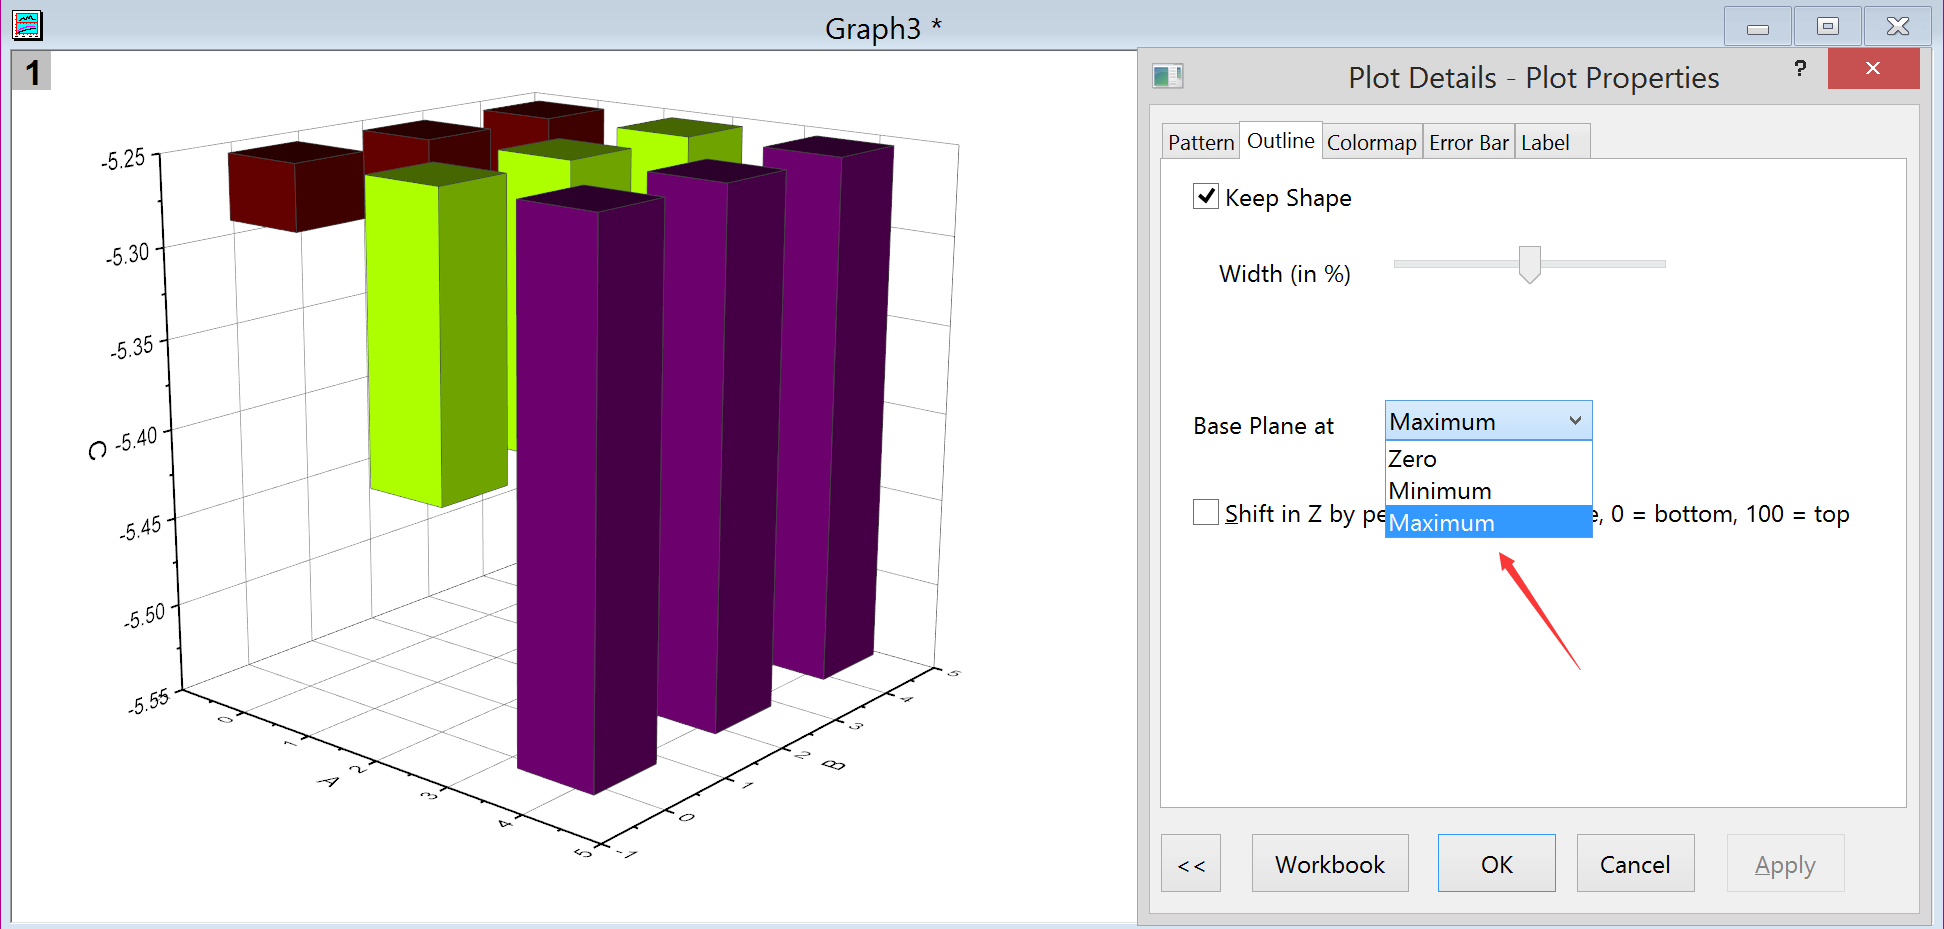 |
ORG-22817 | Support Data Point Tooltip for 3D graphs | Support show data point tooltip for 3D Scatter, XYZ Bar, XYY Bar plot | 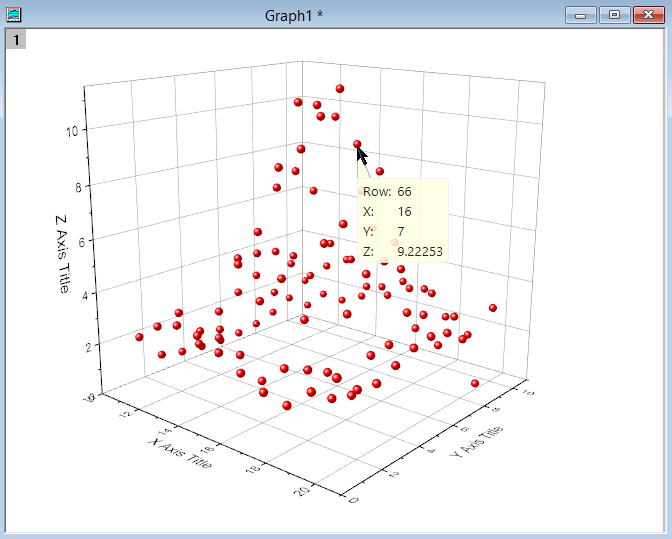 |
Crop and Clip of region of interest in Image | For images inserted in graph/layout, user can either crop or clip to only show region of interest in image | This only works for images not inserted as layer background.
| |
Images in Graph and Image Window Improvements | Improvements on editing images in graph with new image window |
| |
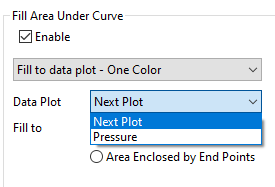
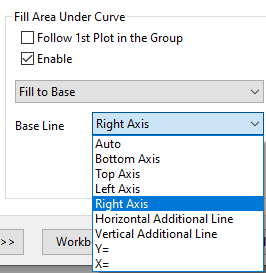
More Options for Fill Area Under Curve | User can fill area under a curve to specified plot or any axis or specified straight line. T |
With the above improvements, Origin can easily plot phase diagram as follows 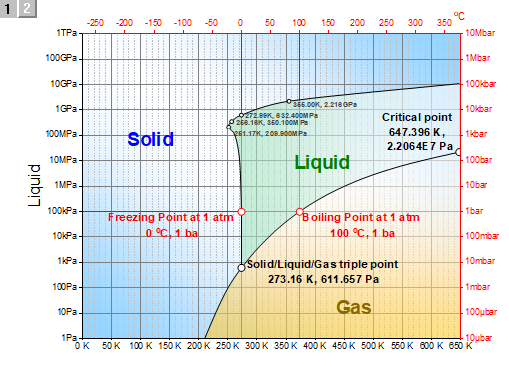
| |
ORG-21932 | Fill to Next Plot for radar plot | If plotting two curves in radar plot, user can fill from one plot to next with one color or two colors | 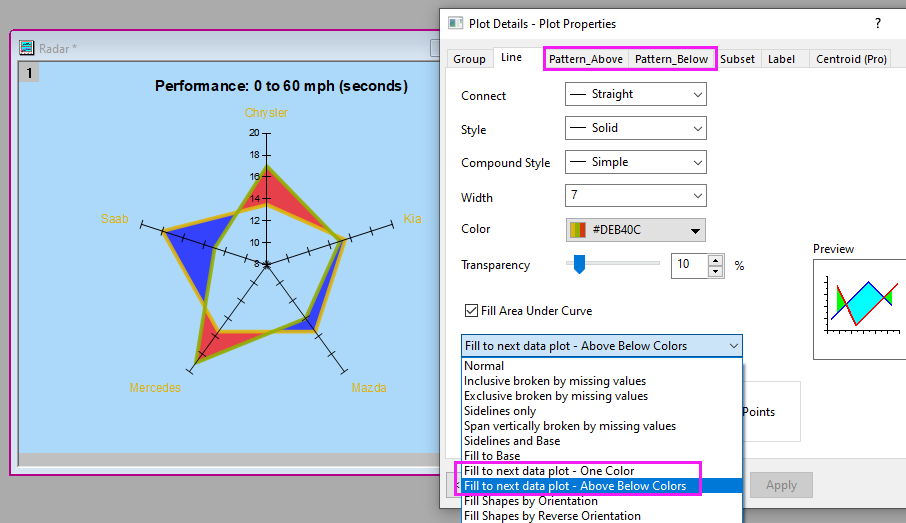 |
ORG-24081 | Connect Lines within Subset | Easier way to plot grouped line+symbol plots | User can easily plot grouped line+symbol plot based on subset and connect line within subset improvements in Plot Details dialog 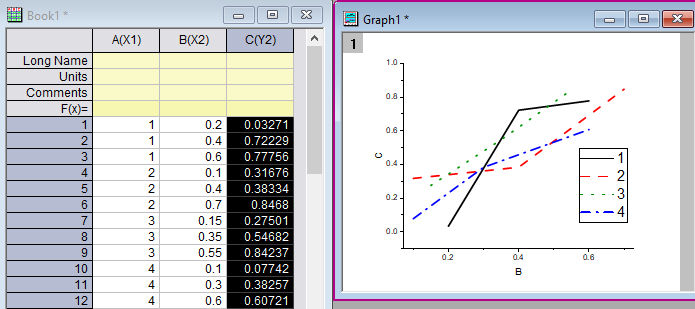 Subset tab is added in Plot Details to specify how to create subset. 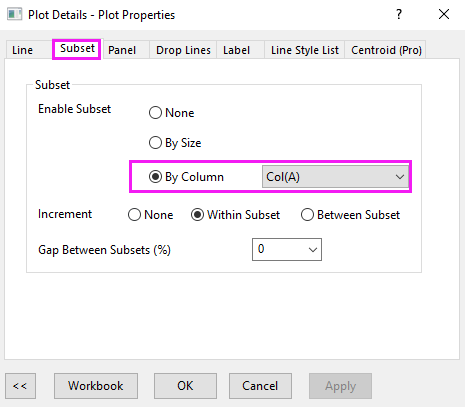 Then check Connect Line within Subset on Lines tab and index color and style accordingly. 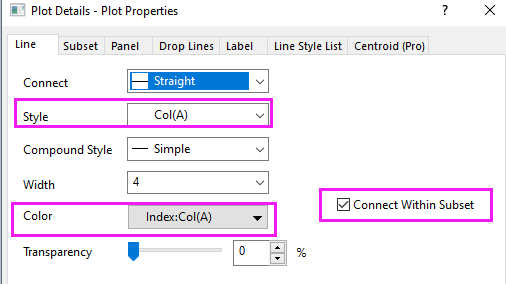 |
ORG-10799 | Tick Label Table Improvements | Wrap text and drag to resize each tick table row height | Use mini toolbar to turn on/off wrapping text of tick label table. Further wrap settings on Tick labels → Format tab of Axis dialog. 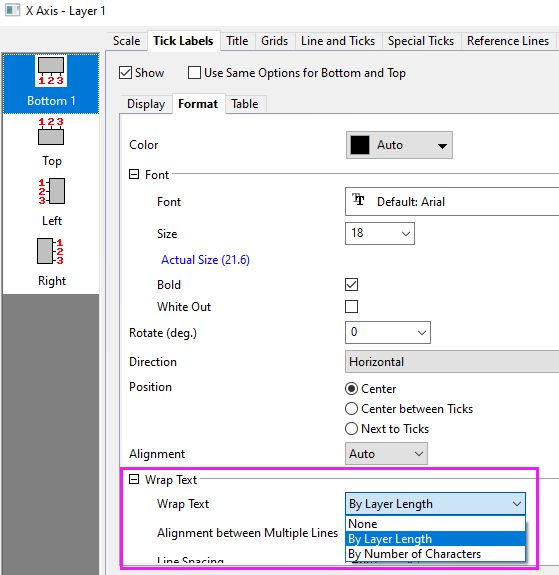 In the past, all table rows share the same margin and couldn’t be resized individually. In Origin 2022, when clicking on tick label table, handles will show below each row to resize. 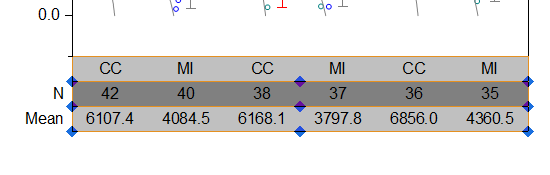 |
Overlap points offset plot on Polar graph should be along the angular direction | Support offset points in polar coordinate to be along angular and radial direction. | On Symbol tab of Plot Details dialog 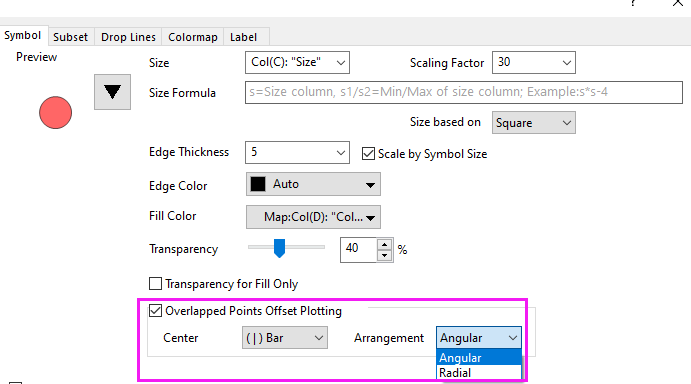 | |
Matrix Contour Plot Ease of Use improvement | Check matrix units to set isometric, increase speed mode | Add a new system variable @MXY (default value 30, in 1/1000), it means the varientation to satisfy abs(x_to - x_from) / (columns-1)= abs(y_to - y_from) / (rows-1). If you want to make contour plot with isometric, you can change @MXY value. | |
Inner Border of Bottom 2 follow Bottom 1 in Axis | Add checkbox Extend Inside Border for each table row under Inside Border, in Axis dialog's table tab. | Select it should extend inside border to other table rows. Note inside border will not extend within merged cell. | |
Allow to change Gap between symbols and arrows on Lollipop graph | Add option Arrow Offset in Plot Detail dialog’s Drop Lines tab, unit is point(same as symbol size) | Positive value means offset arrow away from symbol. So offset of arrow can be set properly. | |
ORG-23376 | Mini Toolbar to Make Double-X Plot Easier | Support Add Secondary Axis button in Axes mini toolbar to make Double-X plot easier | 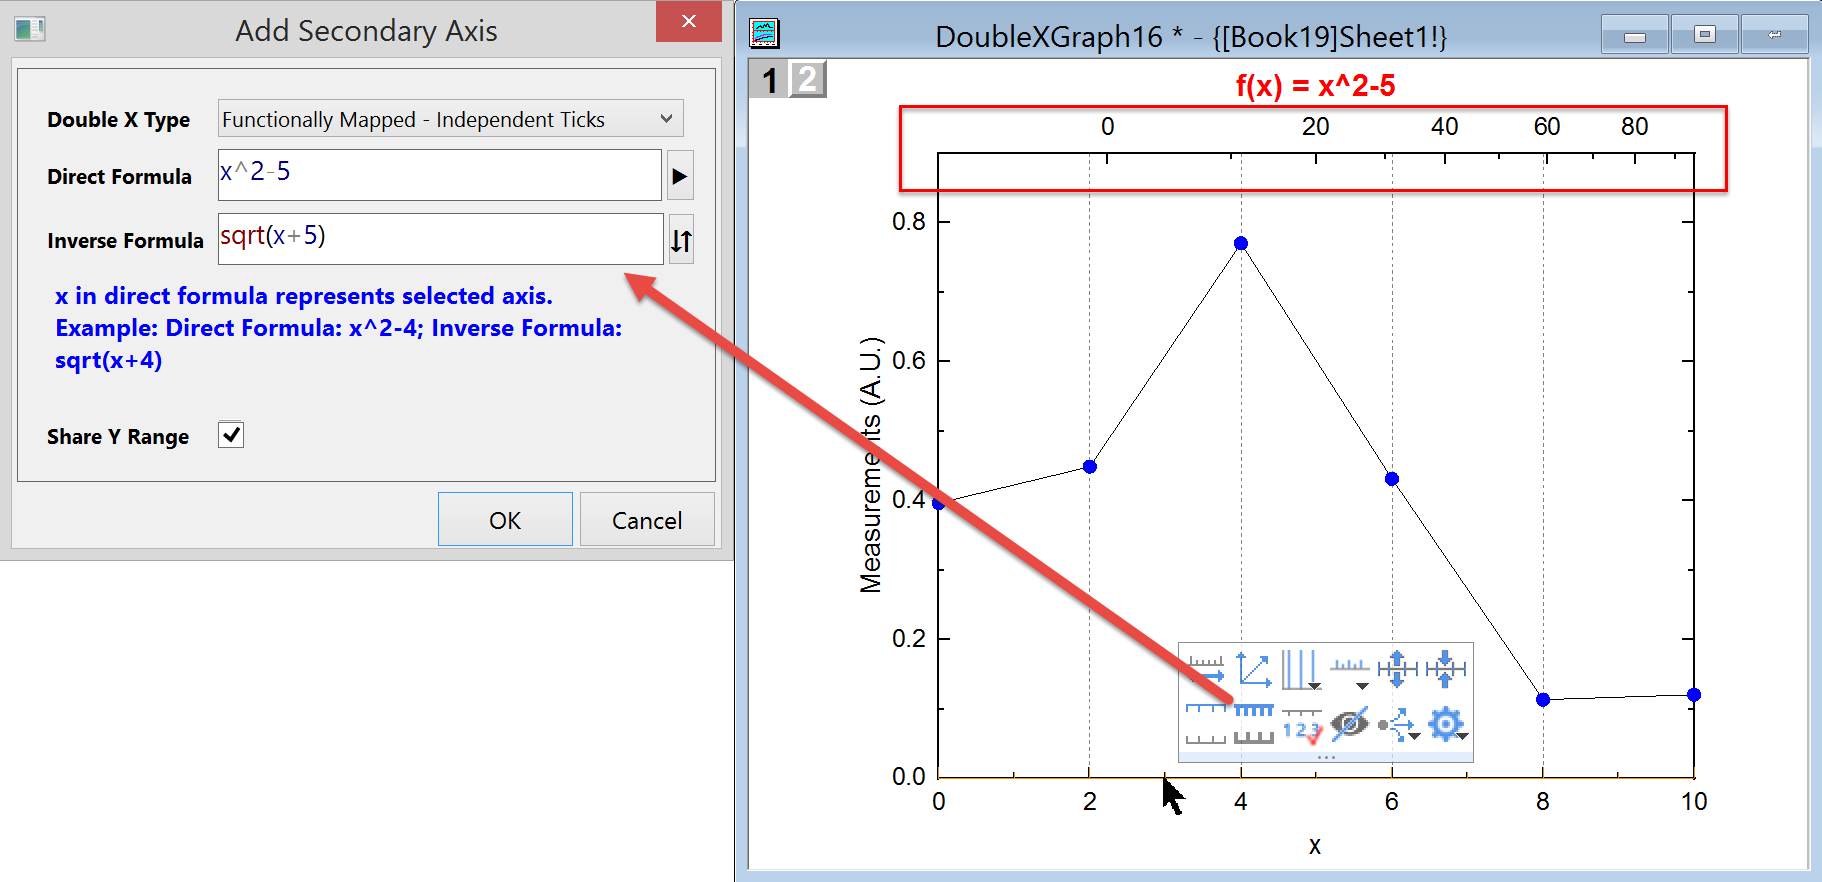 |
Add context menu to copy legend text | Add Copy as Text under Copy in Legend’s context menu | Copy the text that is rendered/visible in the legend, to be able to paste that in outside applications. | |
More Label Position for Reference Line | Add Middle - Above, Middle - Below option for axis reference line’s label position | Add Middle - Above, Middle - Below option for axis reference line’s label position | |
ORG-23706 | Vertical writing in axis label for Japanese/Chinese | This is special for Japanese and Chinese characters. | Add Text Direction option, include Horizontal, Vertical, Stacked, Horizontal Letters and Numbers in Vertical Text (1~3 digits letter or number run horizontally within the vertical flow) |
ORG-24035 | Support recession bar by Span Vertically Pairwise | Make it easy to add recession bar by pairwise start and end x value of each region | This is an alternative of using Span Vertically by Missing Value option. First add any plot with zone’s begin and end X value info. as X data. Then set Span Vertically Pairwise in Plot Details dialog. Use Pattern tab to specify fill color for each bar and use Label tab to turn on the label. 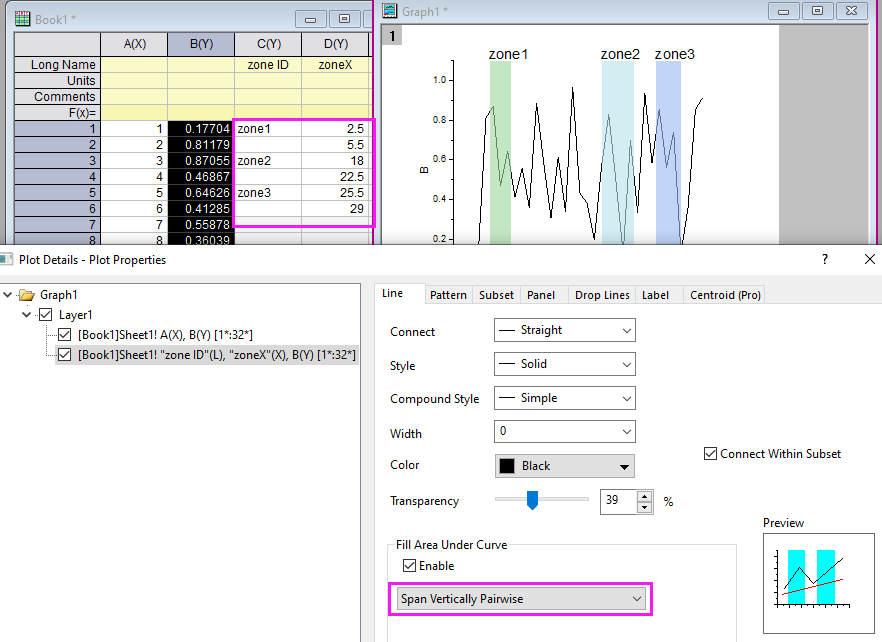 |
ORG-24209 | Plot multi-panel graph by X | Make multi-panel graph by number of X columns | If there are Y column against many X columns in worksheet, user can select Plot: Multi-Panel/Axis: Multiple Panels by … Click > next to Input and choose Select from Worksheet by X to select the X and Y columns Origin will build number of plots based on number of X columns. Then set Group by as X Column 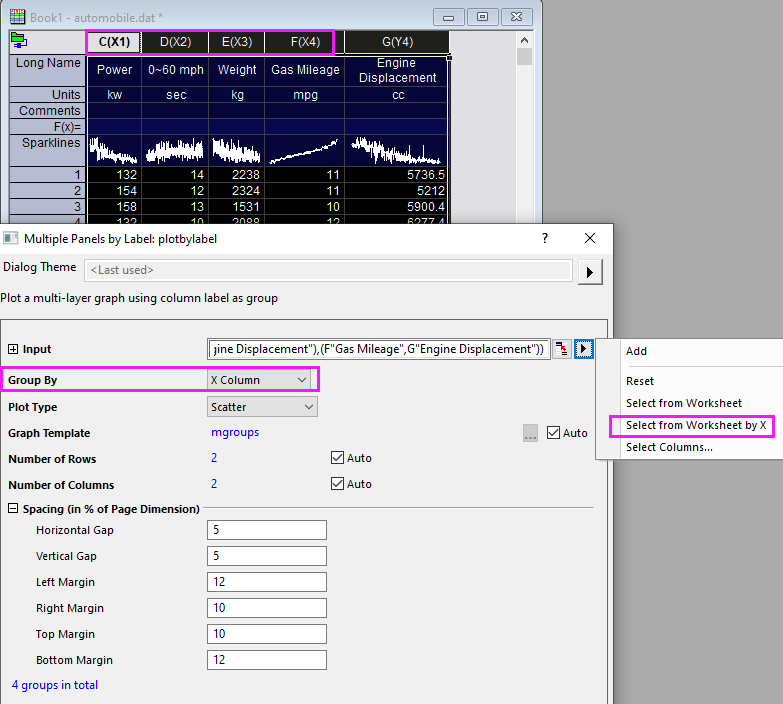 It will plot panels based on number of X columns 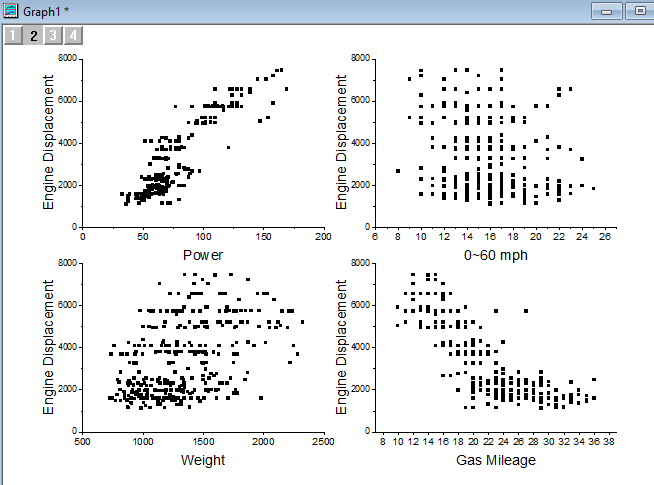 |
ORG-22719 | Mini Toolbar for Controlling Reference Lines | Support mini toolbar for reference lines and fill of reference lines | Click the reference line to show reference line mini toolbar, click the fill area of reference line to show fill of reference line mini toolbar 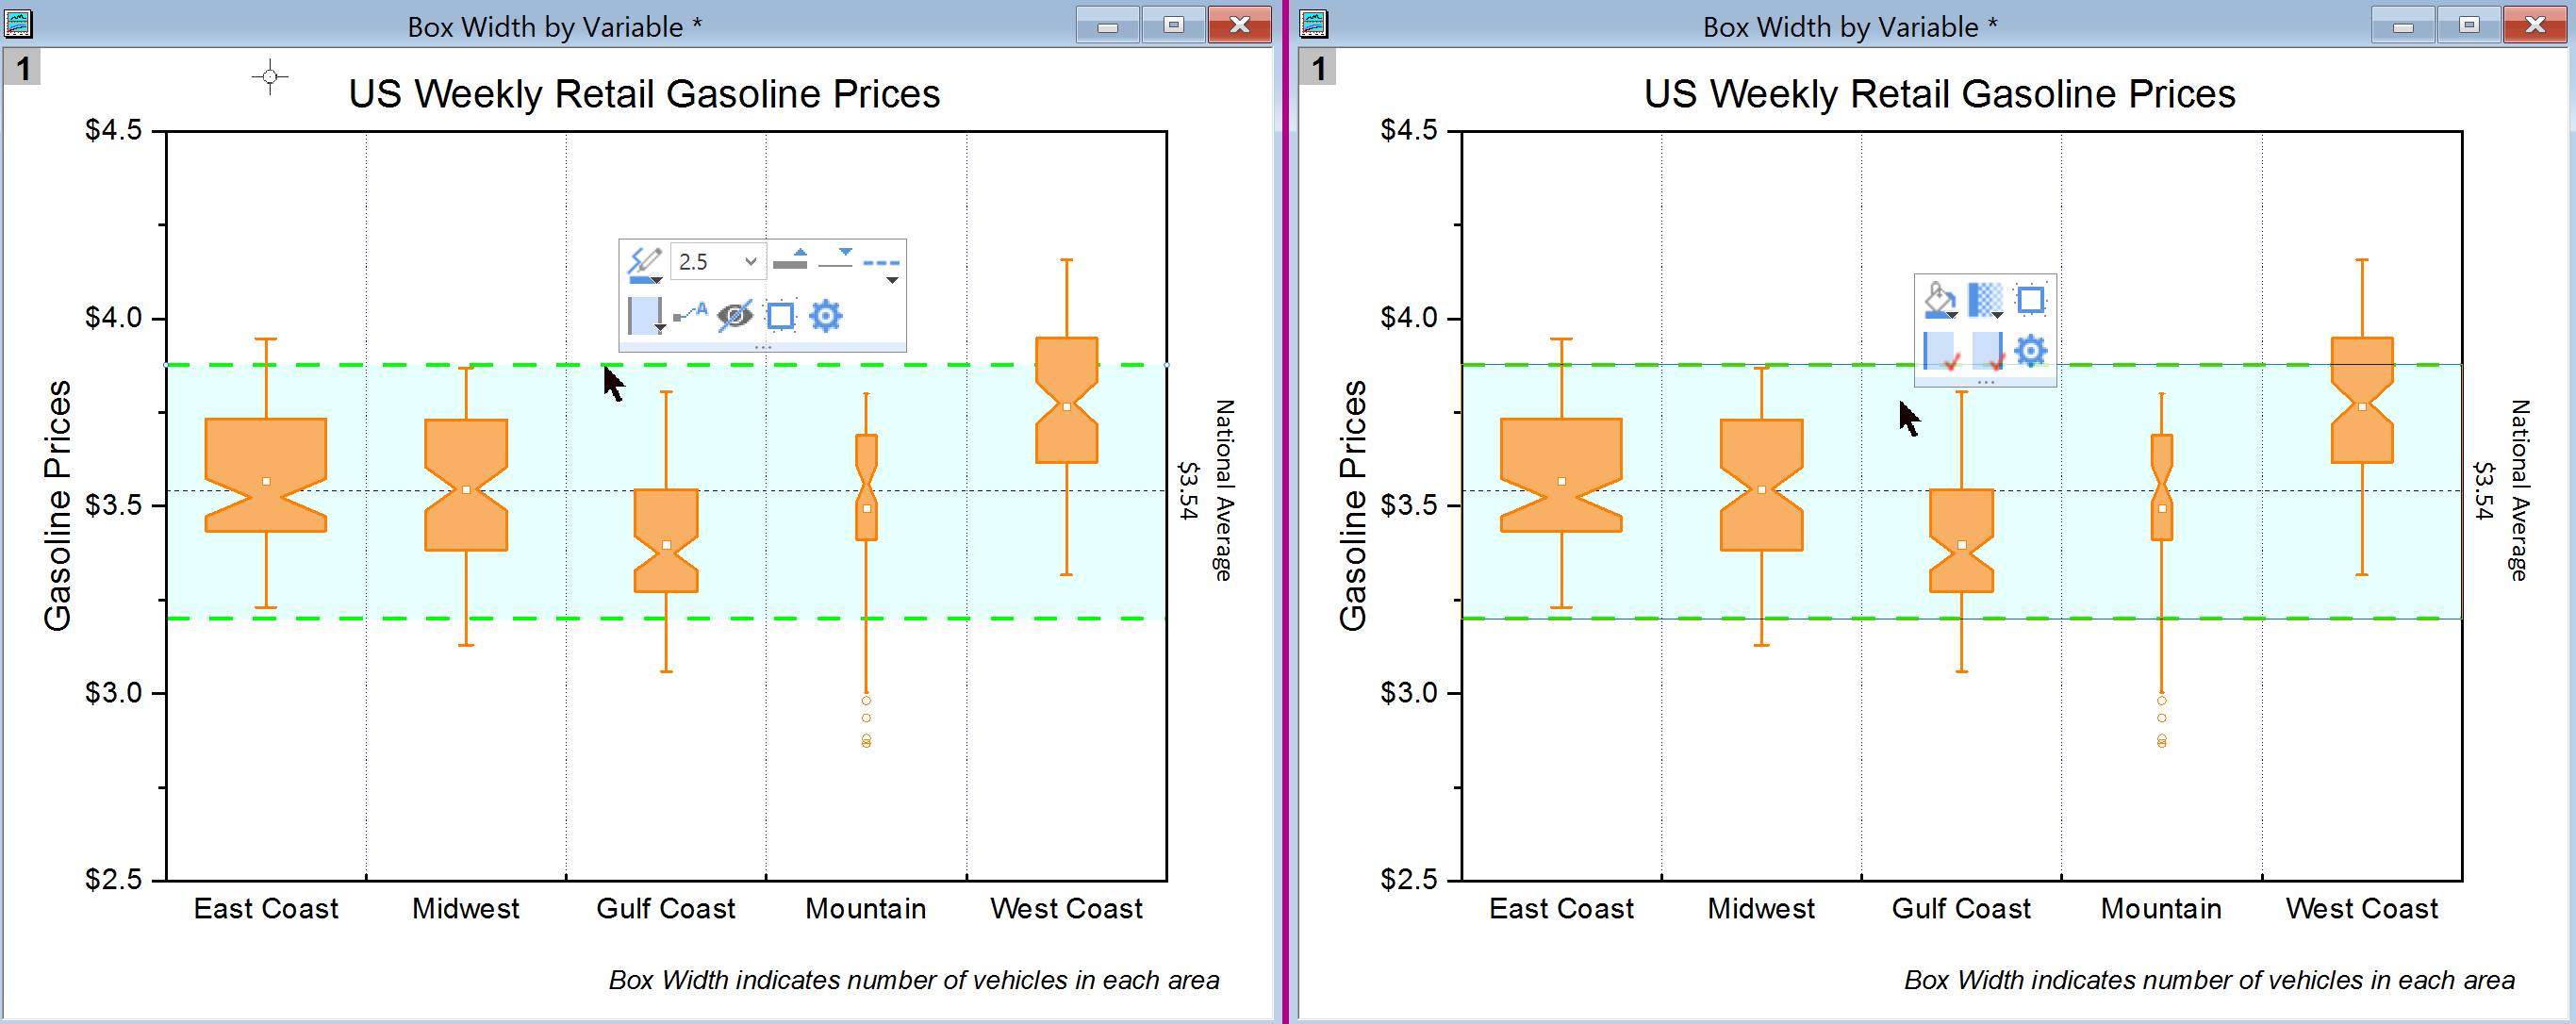 |
Contour support multiple labels on one contour line | Add control in Plot Detail’s Label tab: Repeat Labels checkbox and Distance Between Labels(%) | 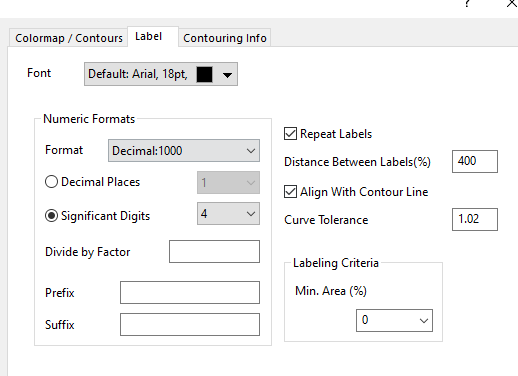 | |
Contour Label follow the flow of contour line | Add control in Plot Detail’s Label tab: Align with Contour Line and Curve Tolerance. | Select Align with Contour Line, label will follow the flow of contour line. Curve Tolerance is the distance along contour line/straight line distance between the end points of the contour label. It decides the maximum amount of contour curvature allowed when placing labels on contour lines. So curvature of contour line bigger than curve tolerance, we will not place label. | |
Contour profile/Image profile improvements | Contour profile/Image profile line and text label more control |
| |
ORG-24090 | Right align Color Scale Tick Labels | Tick Labels for Color Scale was always left-aligned automatically in the past. | There was an Alignment dropdown list in the past but it was actually for tick position. So it’s renamed as Position. New Alignment dropdown list is added 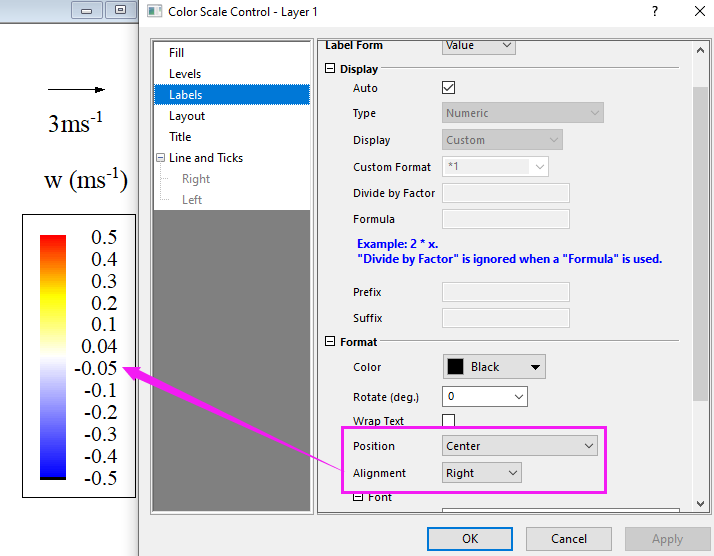 |
Sankey support connect style of the link | Add a checkbox Step-Horz Connect with a editbox under Curvature | When there is enough gap between nodes, Origin would use step-horz connect; but when there is not enough gap, it use current link. | |
Support Y Value Colormap for Violin | In Ridgeline Chart, we support Y value colormap fill. We could support it too for violin plot. | Add Colormap option in Violin’s Distribution: Fill Control | |
Add Bend Link after Node(%) control to avoid overlapped link for Sankey plot | When source or target node is flipped or rotate=180, special point link would show Bend Link after Node(%) in Link tab. Default is 50. | It means bend link after 50% of distance between nodes of neighbor level. User could be able to ctrl click to add special point link, and drag and drop the vertical section to change this value. | |
ORG-24448 | Show dx and dy info. for Graphic objects | When draw a graph object like Line, click it and show dx and dy info. on status bar (bottom right corner of Origin) | 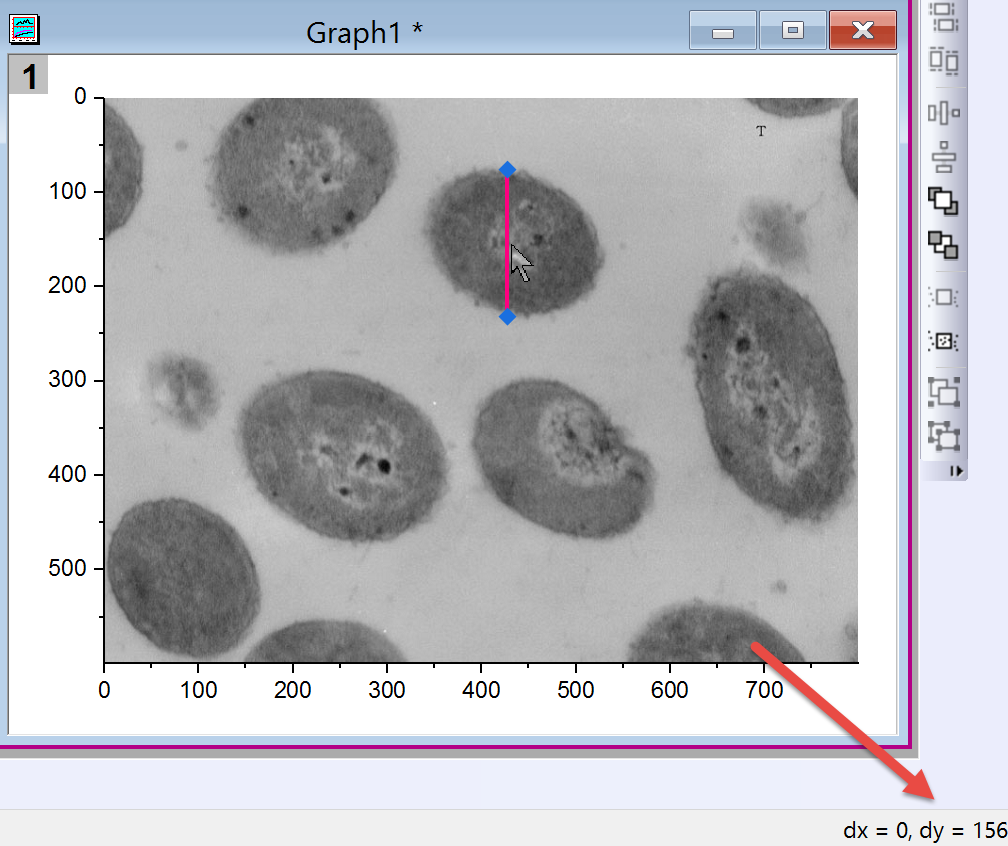 |
Merge Graph Auto Page Size Like Layout | Get auto page size according to graph size and graph arrangement like Merge Graph to Layout. And after the change, merge graph dialog could align layer frame properly. | Also allow m*n to be less than number of graphs/layers. | |
New Smooth Method XYZ Contour and 3D Plotting | Previously, there was a limitation on the maximum number of points that could be smoothed in a contour plot or 3D surface plot. A new NAG function e02jdc (dim2_spline_ts_sctr) increases the number of smoothable points. | This change may alter the appearance of some XYZ graphs made with earlier versions of Origin. Users who need control over the maximum number of smoothable points in XYZ graphs can use LabTalk system variable @TCS. @TCS = // specifies the maximum number of points for tri-contour smoothing beyond which no smoothing will be done. Default = 100000. |
Export
JIRA | SUMMARY | DESCRIPTION | DETAILS | ||
|---|---|---|---|---|---|
ORG-20443 | Export Margin Offsets Improvements | Improve the ease of use of Set Margin Offset in Graph |
| ||
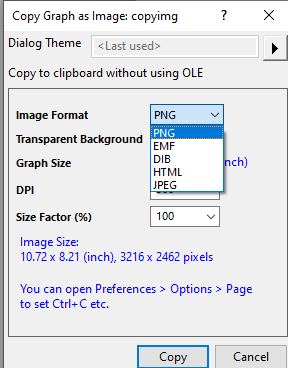
ORG-22778 | New Simple Graph Export tool | More image type plus actual size and dpi settings |
| ||
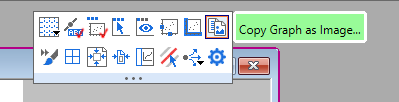
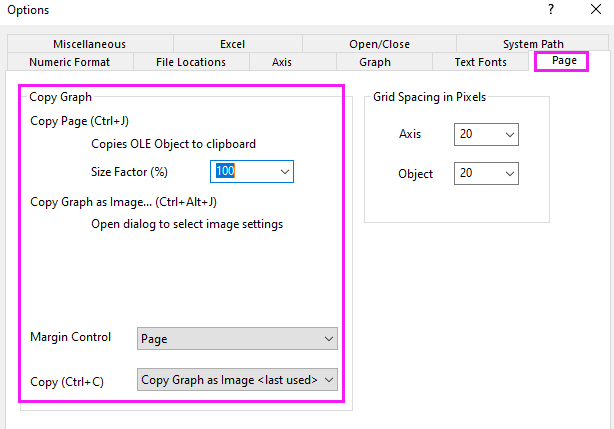
ORG-16812 | Make it easier to copy graph as OLE vs PNG/HTML etc. | Changes made to Page tab of Options dialog, and to Edit menu. |
| ||
ORG-24033 | Export embedded graph with Book and sheet name in File name | Improvements on exporting embedded graphs and sending embedded graphs to powerpoint naming syntax to allow using graph sheet name, etc. | 1.Add notations to use embedded graph’s book and holder sheet name.
2.Add above notation to Send Graphs to PowerPoint tool. 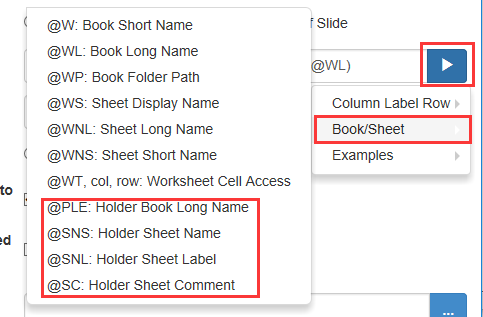 |
...