...
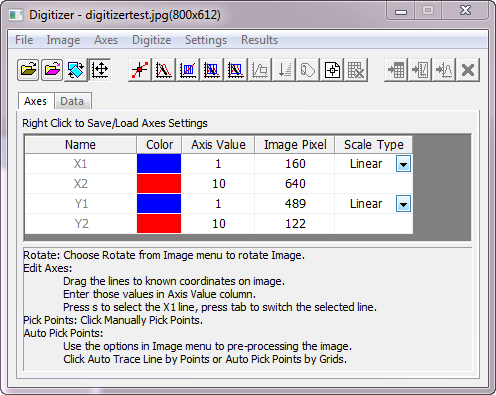
- Menus are added
- Relevant buttons are grouped
- Axes tab and Data Tabs to show Axis settings and picked data values.
- More hints

Auto Trace
These four new methods help customers digitize line object more simple and convenient.
- Auto Trace Line by Points
- Auto Pick Point by Grids
- Area Auto Trace
- Boundary-limited Area Auto Trace
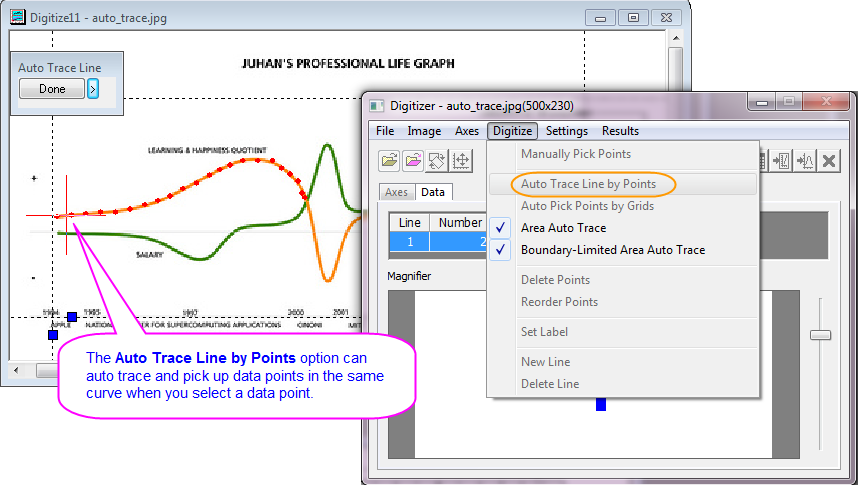
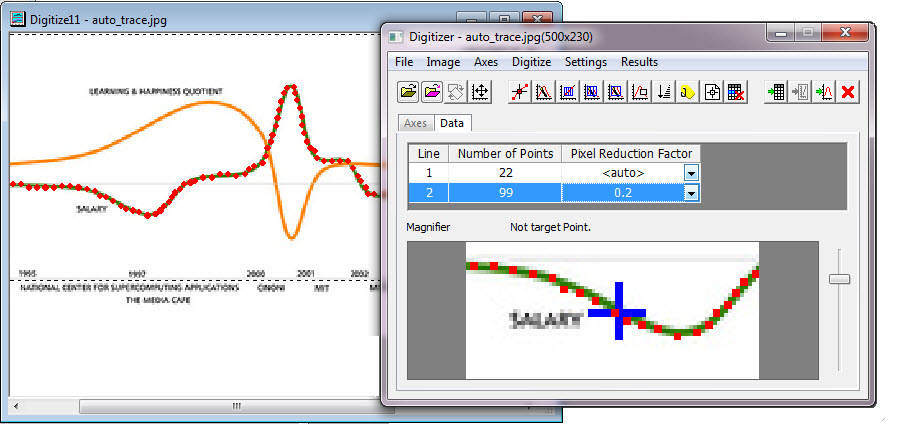
Auto Trace Line by Points
...
To use this, click the ![]() button, or use the Digitize:Auto Trace Line by Points menu items. Then select a target point from the image by double click. When finished, click Done button or Ctrl+Enter. In the Data tab, you can specify whether to reduce the result data points of each line by Pixel Reduction Factor. Select Settings: Digitize Settings to bring up the dialog, go to Auto Trace branch to change the default value of Pixel Reduction Factor.
button, or use the Digitize:Auto Trace Line by Points menu items. Then select a target point from the image by double click. When finished, click Done button or Ctrl+Enter. In the Data tab, you can specify whether to reduce the result data points of each line by Pixel Reduction Factor. Select Settings: Digitize Settings to bring up the dialog, go to Auto Trace branch to change the default value of Pixel Reduction Factor.

Auto Pick Point by Grids
...
If the result point is not on the curve, click 
 button, or the Digitize: Delete Points menu item, then in the original image, click and drag the cursor to select the area of the target points.
In order to reorder the points of the result graph, click 
 button, or the Digitize: Reorder Points menu item to reorder the points.
...
In order to change the grid direction and density, you need to select Settings:Digitize Settings from the menu item and do the settings in the Digitize Settings dialog in advance:

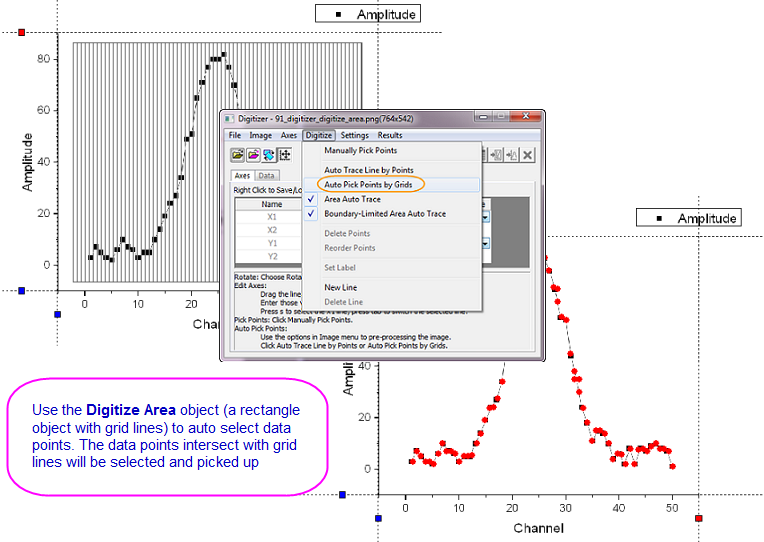
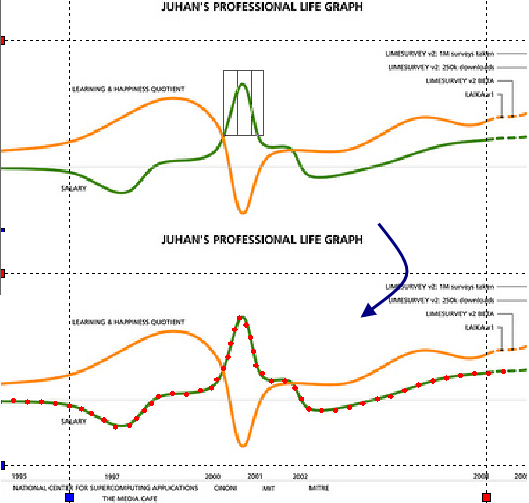
Area Auto Trace
Use the Area Auto Trace object (a rectangle object with grid lines in either X or Y directions) to auto trace line. The data points intersect with grid lines will be selected as the target point, the other data points in the same curve (or more accurate, the same part of the curve) will be auto traced and picked up.
To use this tool, click the  button, or the Digitize:Area Auto Trace menu items to enable, then in the original image, click and drag the cursor to select the area of the target points.

In order to change the grid direction and density, you need to select Settings:Digitize Settings from the menu item and do the settings in the Digitize Settings dialog in advance
In the Data tab, you can specify whether to reduce the result data points of each line by Pixel Reduction Factor. Select Settings: Digitize Settings to bring up the dialog, go to Auto Trace branch to change the default value of Pixel Reduction Factor.

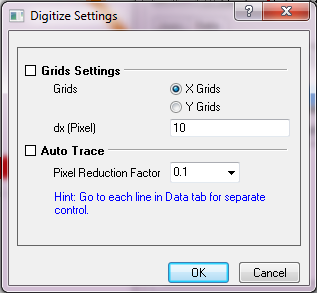
Image Pre-processing
...
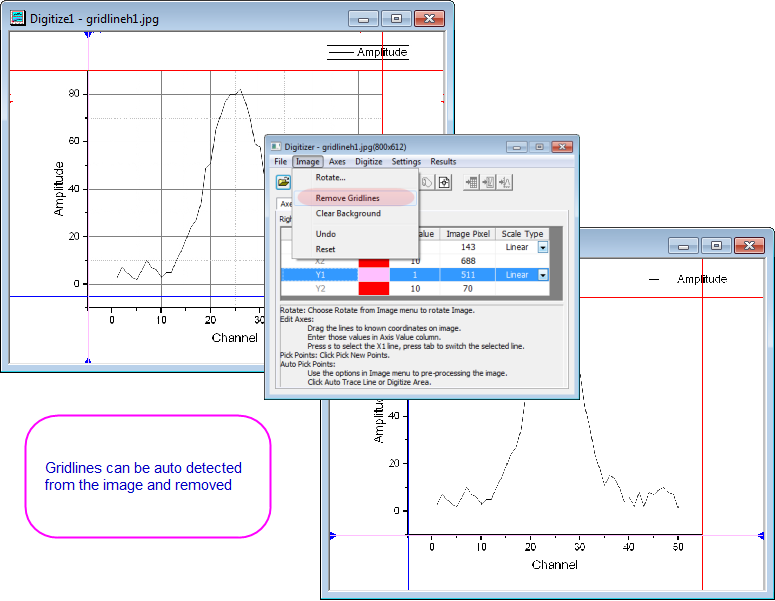
To use the option, select Image: Remove Cartesian Gridlines from the Digitizer menu. You can Undo or Reset the image if the output is not what you want.

Remove Background
...
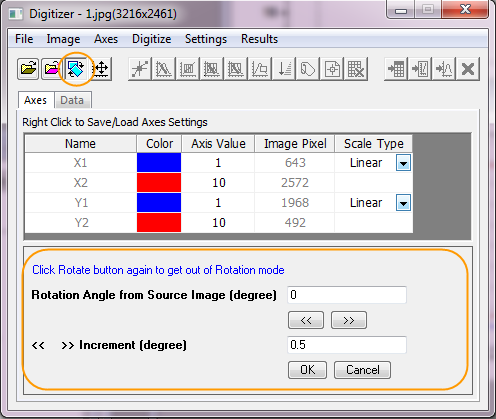
To use the option, click the button, or select Image: Rotate from the Digitizer menu.

Ternary and Polar coordinate
...
Now Origin can not only digitize cartesian coordinate graphs, but also polar and ternary
Ternary Coordinate
To digitize a graph in ternary coordinate system, you should define the coordinate first.
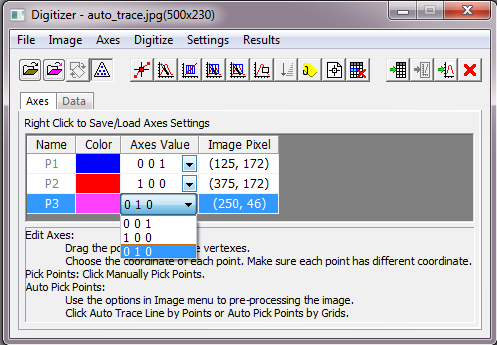
- Click the menu items Axes:Ternary Coordinate...,
- Ternary Coordinate Settings dialog pops up for you to define the axes orientation in the imported image, either counter-clockwise or clockwise. Click OK to apply the settings and close dialog
- When the Ternary coordinate system is chosen, and the
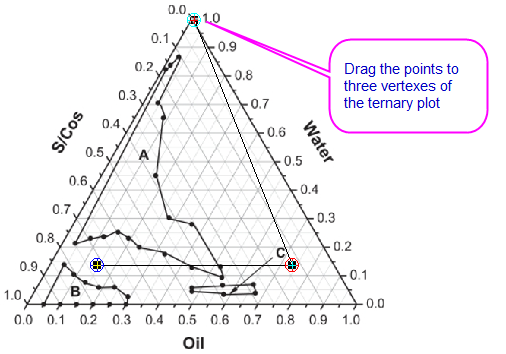
 button is clicked, three reference points (P1, P2 and P3) are shown in the image. Drag the points to three vertexes of the ternary plot, and set the corresponding axes value


Polar Coordinate
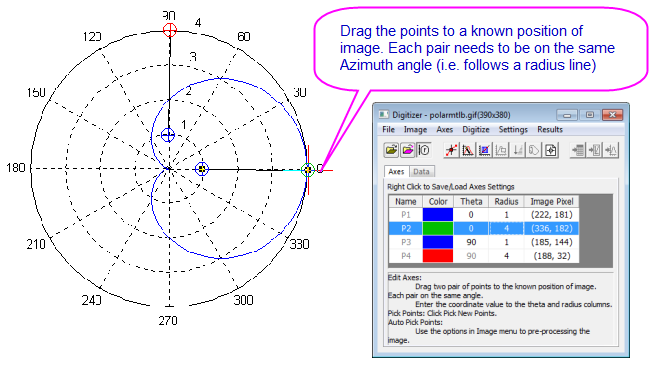
To digitize a graph in polar coordinate system, you should define the coordinate first.
- Click the menu item Axes: Polar Coordinate...,
- Polar Coordinate Settings pops up for you to define the axes orientation in the imported image, either counter-clockwise or clockwise. Click OK to apply the settings and close dialog
- When the Polar coordinate system is chosen, and the
 button is clicked, two pairs of points (P1, P2 and P3, P4) are shown in the image as reference. Drag the points to a known position of image. Each pair needs to be on the same Azimuth angle (i.e. follows a radius line). Then enter the coordinate values to the theta and raidus columns. Image Pixel column shows the point position in the image by pixel.
Digitizing Multiple Curves
...
Select Settings: Options from the Digitizer menu, You can change the color, shape and size for digitize symbol.

Magnifier
(ORG-8801)
...