How to: - Menus and toolbar buttons added Plot: Column/Bar/Pie: menu
 Image Removed Image Removed Image Added Image Added
 Image Removed Image Removed Image Added Image Added
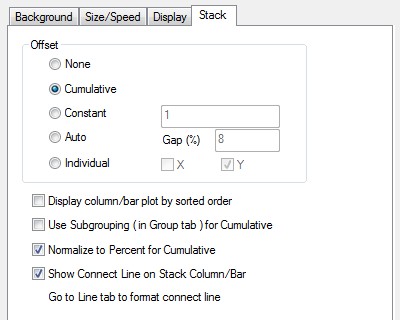
- Controls on Stack tab of Layer level in Plot Details dialog:
Normalize to Percent for Cumulative checkbox
Show Connect Line on Stack Column/Bar checkbox to control connecting stacked column/bars with line or not. A new Line tab will show in Plot Properties level.
Note: When Use Subgrouping (in Group tab) for Cumulative is checked, Show Connect Line on Stack Column/Bar checkbox would be disabled.
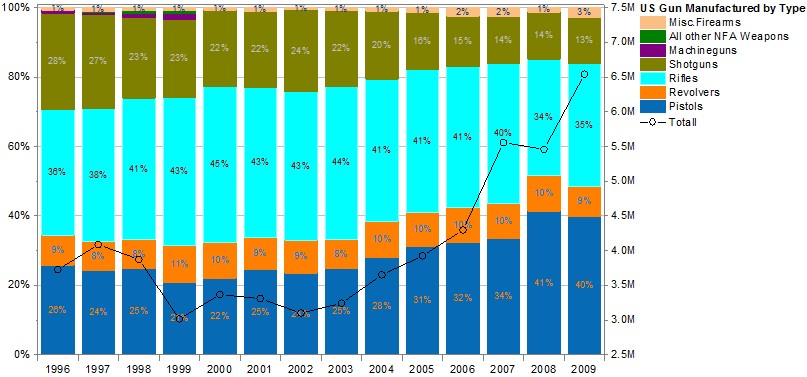
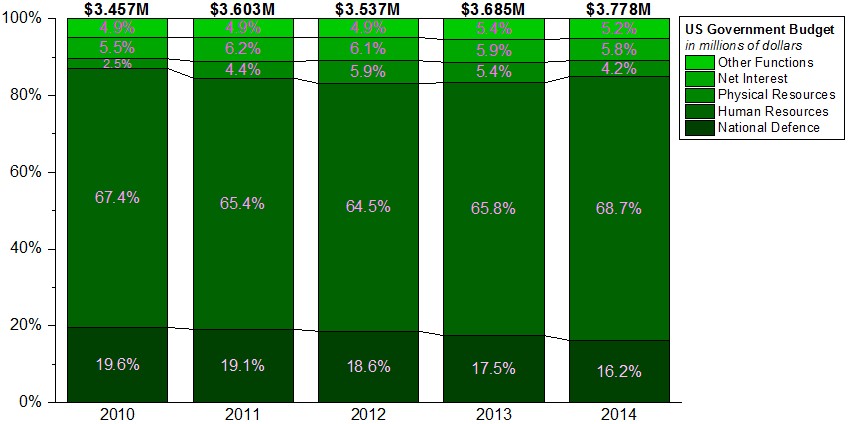
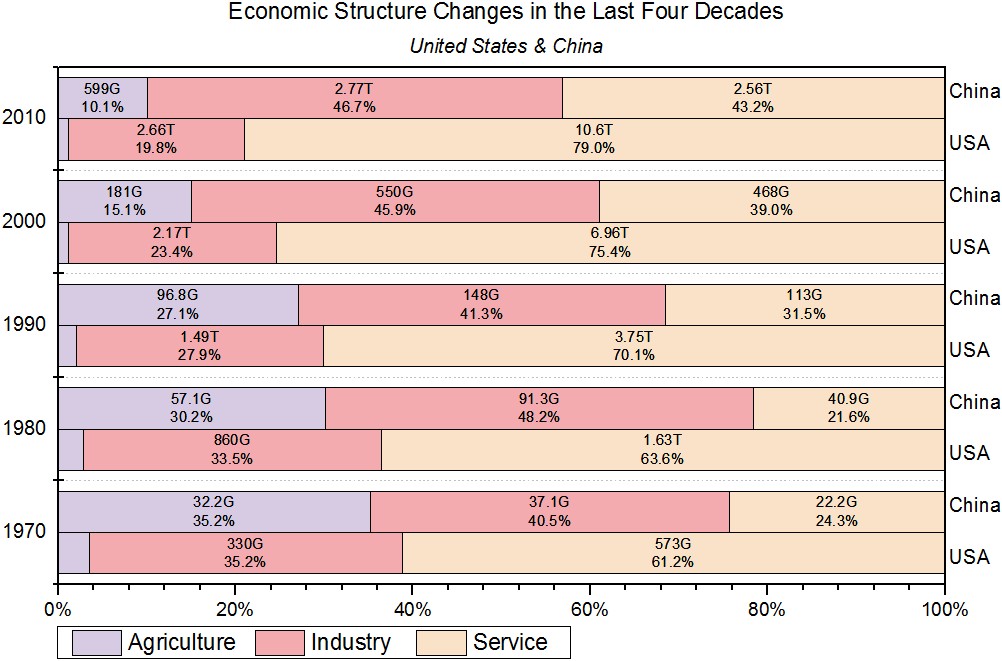
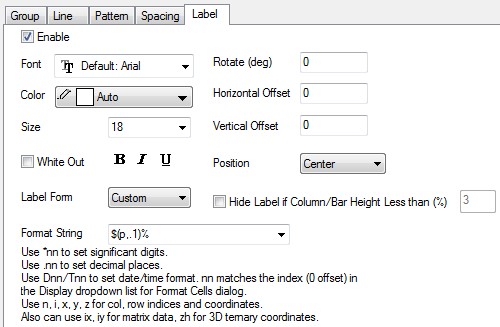
- To show data labels as percentage
go to Labels tab and set Label Form to be Custom. Format String to be $(p,.1)%, .1 means one decimal places.
If want to show both percentage and actual value, set Format String to be $(Y,E*3)%(CRLF)$(p,.1)%. E*3 means using engineering type and keep 3 sigificant digits.
- To Hide small labels
Go to Labels tab and check Hide label if Column/Bar Height Less than (%) check box and set the value.
|