Download 92DemoGraphing.opj and Try with C4 folder
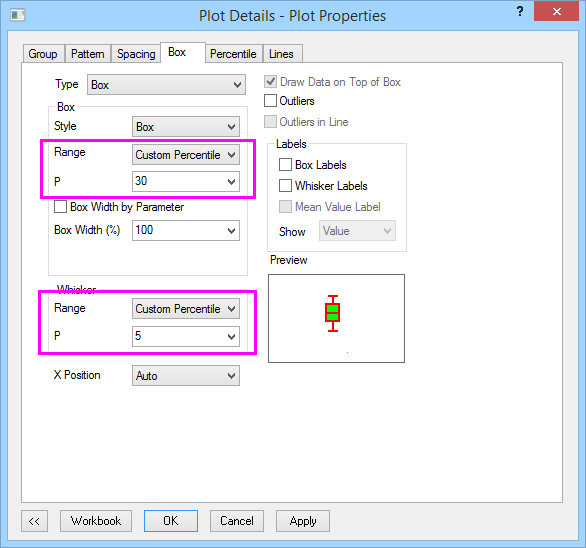
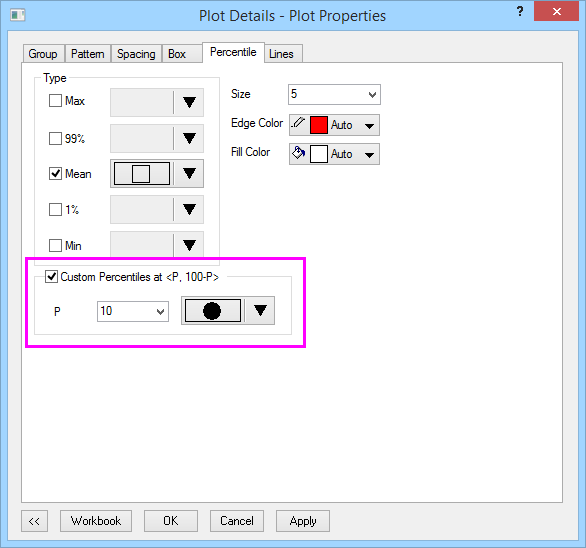
| Custom percentile range of the box and Whisker | |
|---|---|
| ORG-4432 | |
  | |
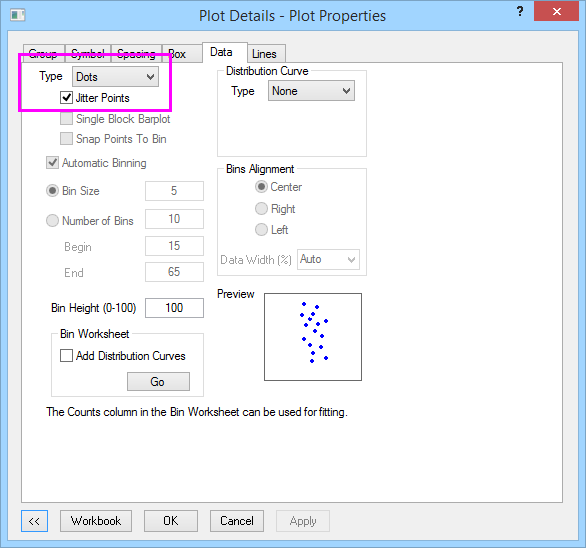
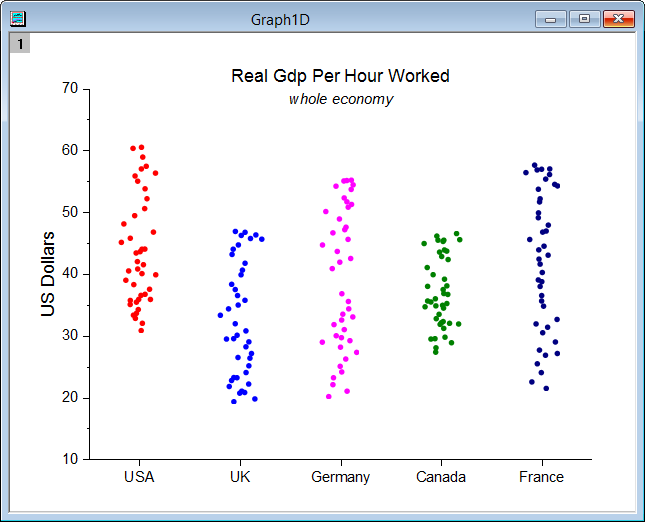
| Jitter data in box plot | |
| ORG-7738 | |
This above graph could be also plotted by select columns and select Plot: Symbol: Column Scatter. Note: To plot group column scatter, go to Plot: Statistics: Group Box Charts-Indexed Data/Raw Data, select Box_column scatter for Graph Theme. | |
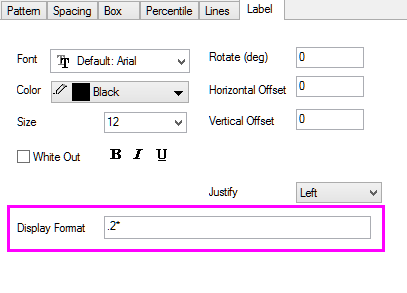
| Related Box Chart Component dialog improvement | Box Chart Label Format Display Control |
| ORG-7738 | ORG-11225 |
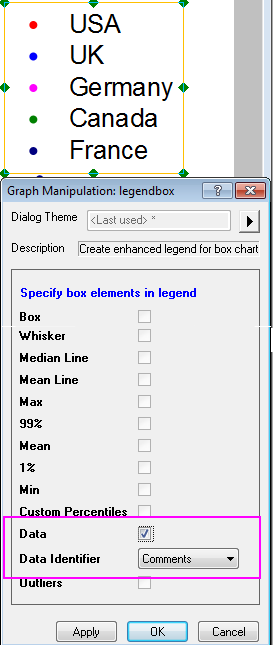 |  |
| Data reader in box plot | |
| ORG-10256 | |