Origin 2015 Features
Origin 2015 Highlights
The table below only lists some highlights of Origin 2015. To see more features in 2015, please use the navigation bar on the left panel of this page.
Origin Interface
JIRA | SUMMARY | DETAILS |
|---|---|---|
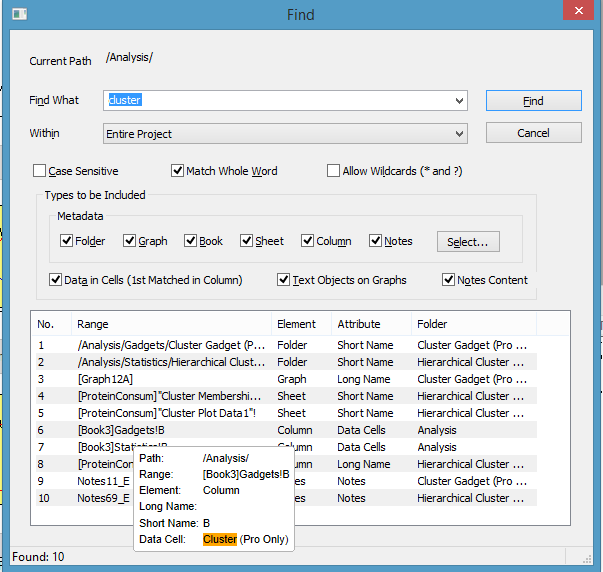
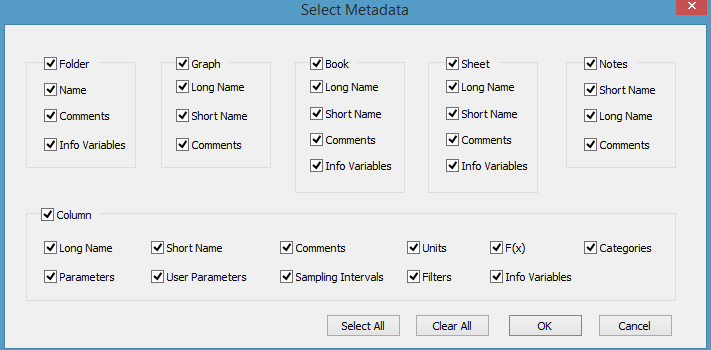
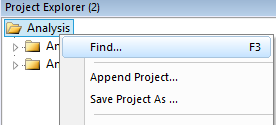
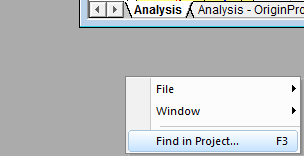
| ORG-9847 | Find Metadata in Project | Sample OPJ to try: Choose menu "File: Open Sample OPJs: Analysis" Find in Projects Dialog
Menu and Context menu open Find in Project (F3)
Tooltip and Context menu for findings
|
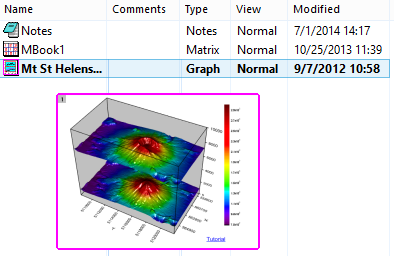
| Project Explorer Improvement: Graph Previews in Project Explorer | Graph Preview When Moussing Over
Extra Large Icons to Show Graph Previews
Note:
| |
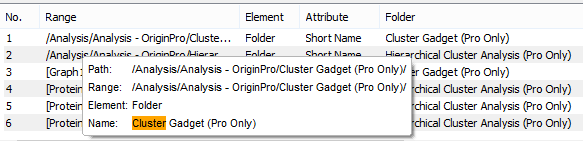
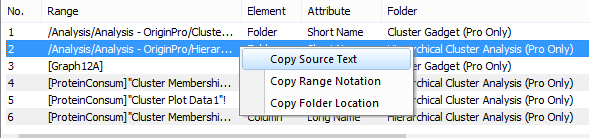
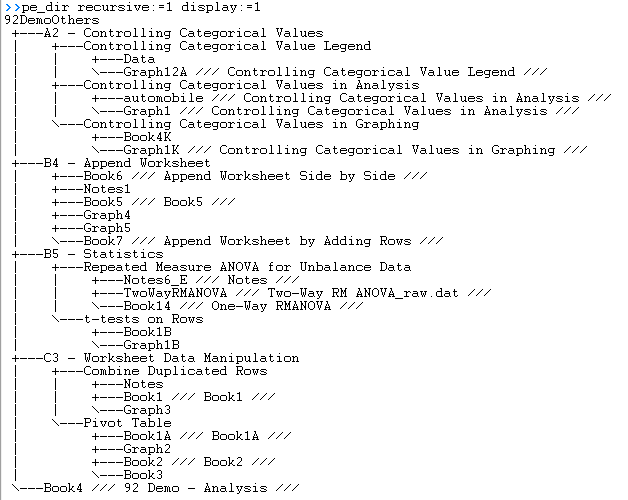
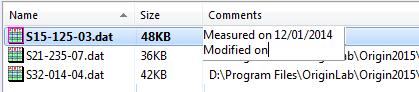
| ORG-10413 | Project Explorer Improvement: Folder Comments | Project Explorer Folders now support comments just like books or graphs. The ability to dump folder tree with descriptions has also been added to the pe_dir X-Function. The following new variables were added to pd_dir: 1. "recursive" for searching subfolders. 2. "display", only useful when recursive=1. It has 3 options: tree, tree with description (for folder, it is Comments; for window, it is LongName), and flat (separate with CRLF) 3. "sensitive" for case sensitive.
|
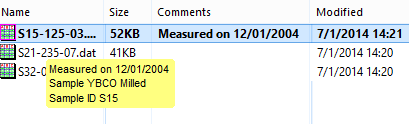
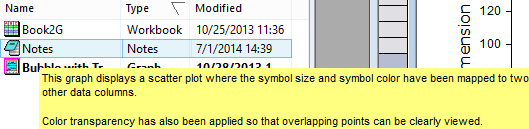
| ORG-11067 | Project Explorer Improvement: Comments tooltip when Moussing over Folder/Windows | Tooltips to Show Comments from Folders and Windows
Tooltips to Show Notes Window Contents
|
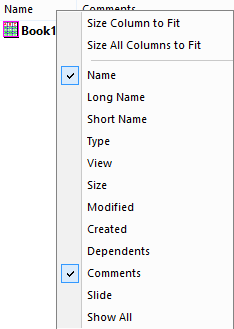
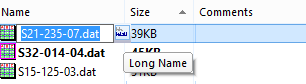
| ORG-7727 | Project Explorer Improvement: Show/Hide Column context menu | Details view in PE is now similar to Explorer and right-click will allow easy control of which column to display.
You can now also show Name column together with Long Name and Short Name.
|
| ORG-11432 | Project Explorer Improvement: In-Place Edit of Comments, Long Name, Short Name | Support in-place edit of Name, Long Name, Short Name and Comments columns in PE.
Edit both short name and long name in in-place edit mode of Name column.
|
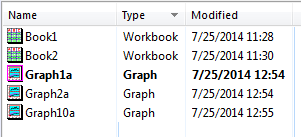
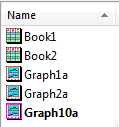
| Other Improvements in Project Explorer | Bold Active Window Line Easy to tell which window is active.
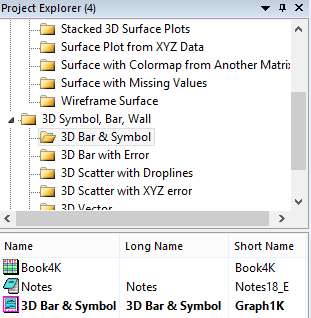
Follow Windows Text Sorting Criteria In the past, sorting only takes care of numbers at the end of name. Now even names like Graph10a, Graph1a, Graph2a will sort properly.
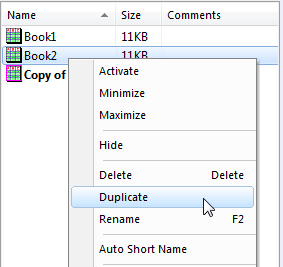
Duplicate Window in PE
| |
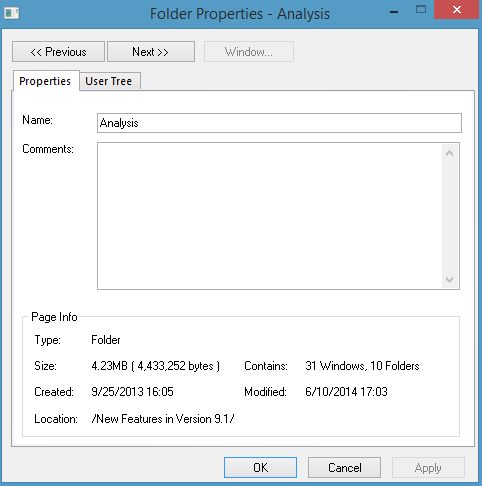
| Window/Folder Properties dialog Improvement | Meta data support for PE folder (Comment, User Tree) Right click folder and choose Properties to add comments and user tree
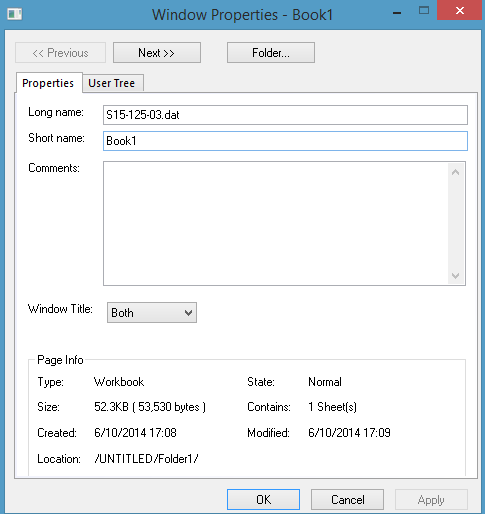
Window Properties dialog with more common options like user variables
| |
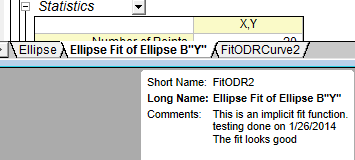
| ORG-10962 | Sheet Comments | When right click sheet name, we used to have a Comments... context menu to edit comments. We have changed it to Name and Comments... context menu. It opens a new dialog to edit Short Name, Long Name and Comments. When hover over sheet tab, Short name, long name and comments all show as tooltip. It also indicates what the display name is in bold in tooltip.
|
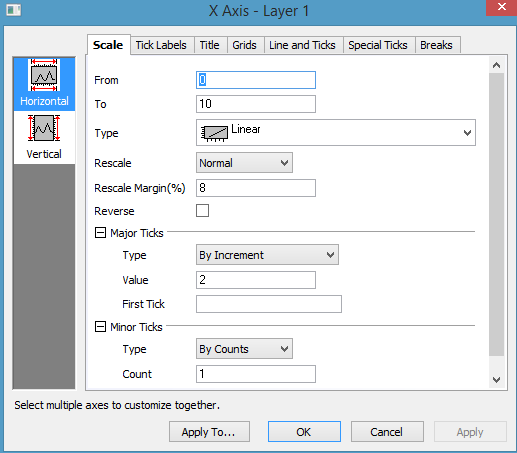
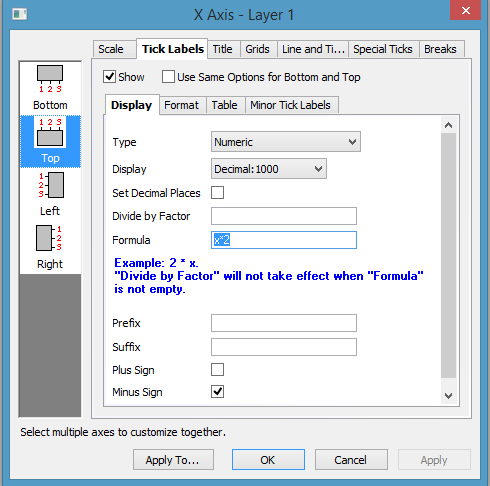
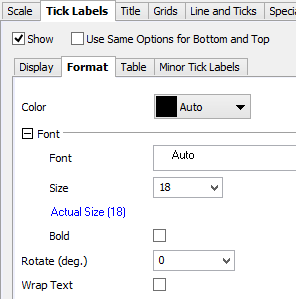
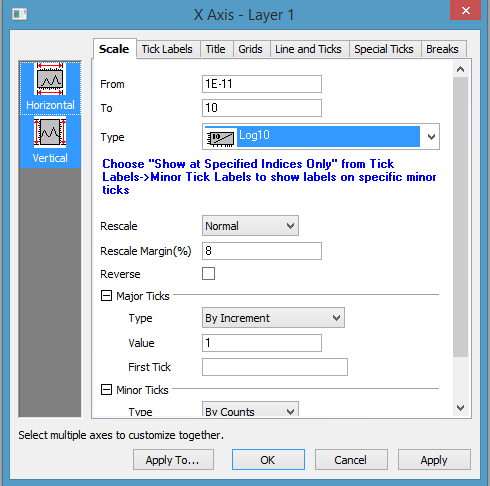
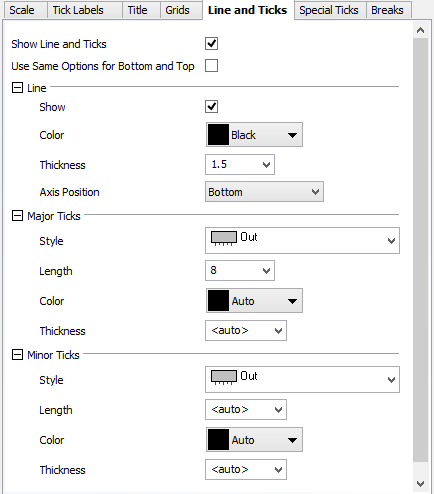
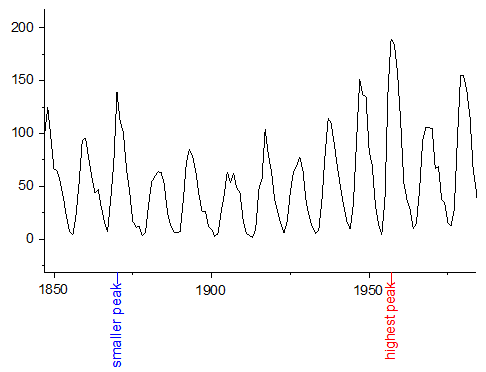
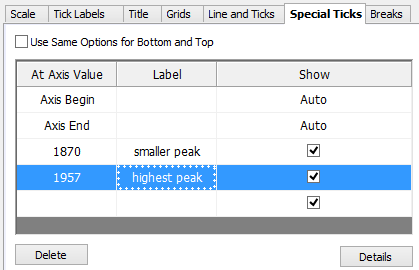
| ORG-10198,ORG-9668, ORG-10524, ORG-11534, ORG-11132, ORG-104, ORG-10180, ORG-10277, ORG-10312 | Axis dialog Improvements | Better Layout of the Axis Dialog
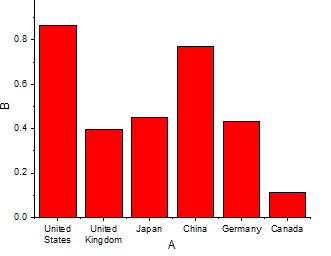
Wrap Tick Labels
Customize Multiple Axes Together E.g. highlight both Horizontal and Vertical icons on the left, Set both Scale Type to Log10 together.
|
| ORG-10999, ORG-11246, ORG-10701, ORG-9126, ORG-11670 | Other GUI Changes in Origin 2015 | Graphing and Plotting
|
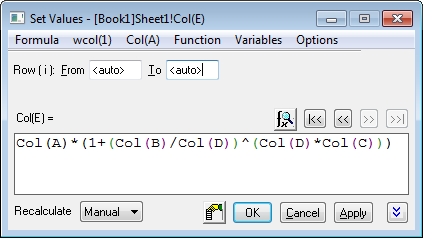
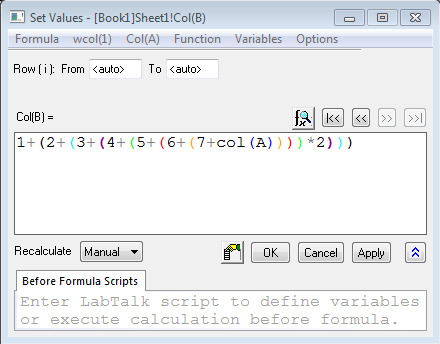
| ORG-10749 | Colored Paires of Parentheses in Function Formula | Origin colors the parentheses in a formula, that both closing and opening are the same color. This helps you see which ")" goes with which "(":
This is supported in dialogs that accept a formula such as:
|
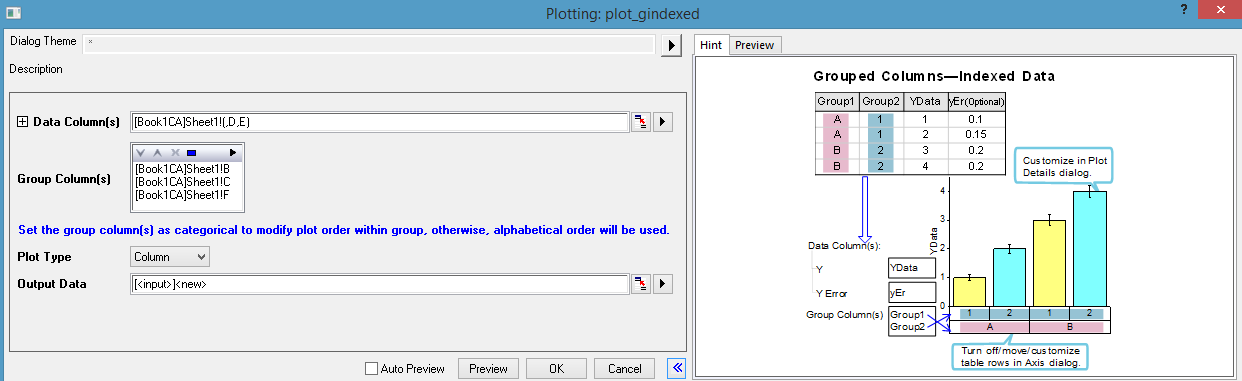
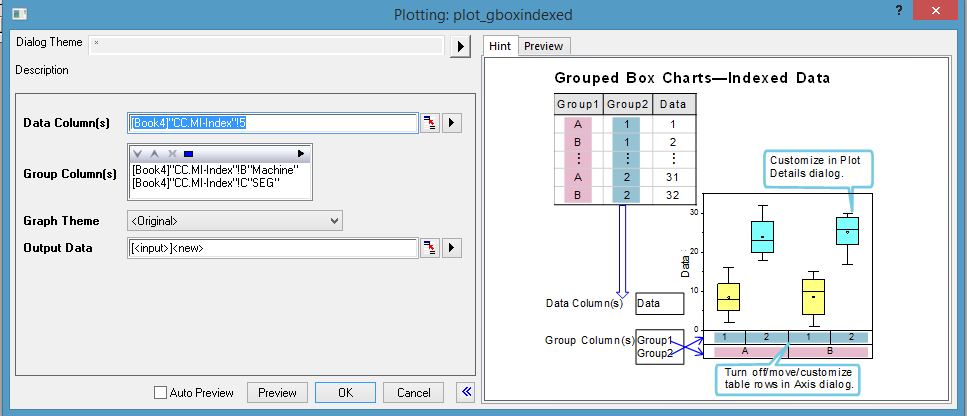
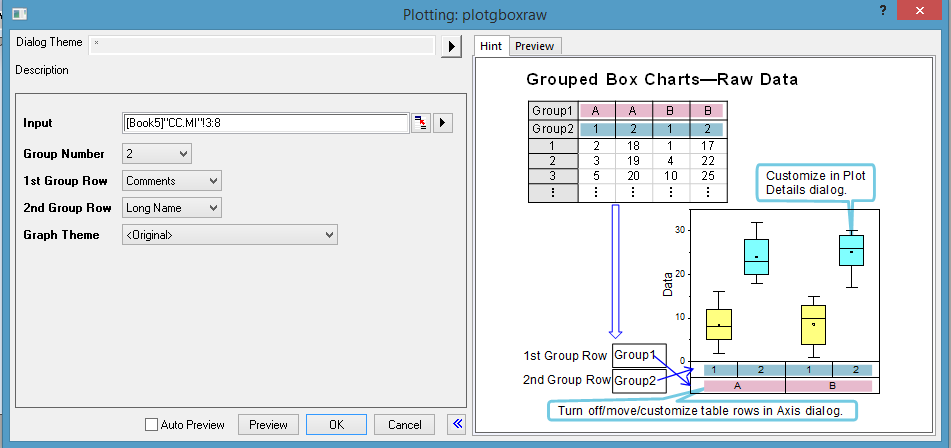
| ORG-11522 | Grouped Plot dialog | Hint tab added in Grouped Column Plot, Grouped Box Chart dialogs. Labels are improved in the dialogs. Grouped Column Plot - Indexed Data
Grouped Box Chart - Indexed Data
Grouped Box Chart - Raw Data
|
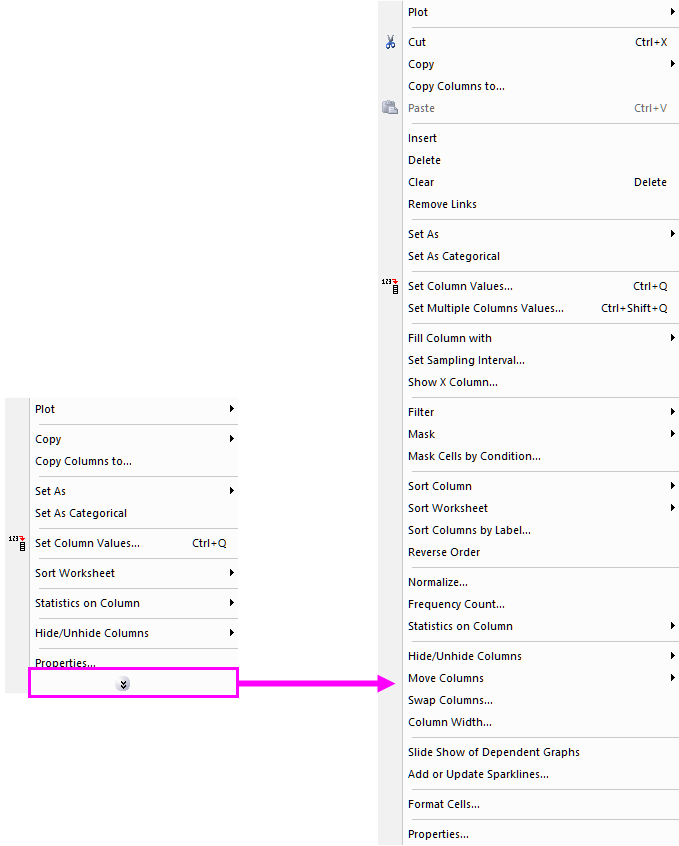
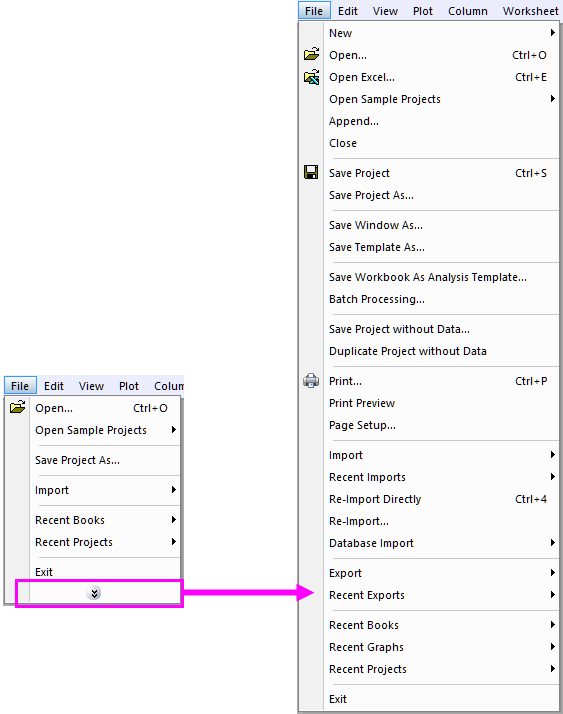
| ORG-11596 | Collapsible Menu and Context Menus | Now most of the menu/context menu will be collapsible so user do not need to go through all options every time. Note: To turn off the collapsible menus and show full menus, please look at the page below http://www.originlab.com/doc/Quick-Help/collapsible-menu
Note: Once the hidden menu is selected, it will be shown as the commonly used ones in the collapsible menu in the next time. |
| ORG-11612 | Data Info. Improvements | Go to Worksheet context menu in Data Info/Data Display windowWith Graph window active, choosing Go to Worksheet context menu in Data Info. and Data Display window will highlight corresponding row in worksheet. Go to Graph context menu in Data Info. windowWith worksheet active, choosing Go to Graph context menu in Data Info. window will go back to Graph window. |
| ORG-11637 | PE: View Extra Large Icons context menu is added (SR1) | In Details view of bottom panel in Project Explorer, if there are many windows and they fill up the space, right click will not show View context menu to switch view mode. show View context menu to change |
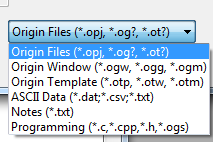
| ORG-12155 | Combine entries in File Types dropdown list of File: Open dialog. (SR1) | Customer complained there are too many entries in File Types dropdown list which isn't convenient to use. Some entries are combined so user doesn't need to switch File Types that often. |
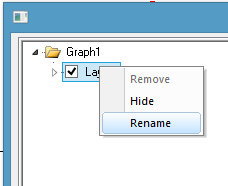
| ORG-12196 | In Project Explorer, when click on the worksheet to rename we add a bigger toggle button and a hot-key to control to either rename Short Name or Long Name (SR1) |
|
| ORG-12366 | Control font in Script Window (SR1) | E.g. in [Font] section of Origin.ini in your Origin's User Files Folder, add ScriptWindowFontHeight=24 |
| ORG-12576 | Options to control the tooltip for windows in PE (SR2) | Set @PESH=0 to disable book comment tooltip. Set @PESS=-1 to show preview as Comments-style tooltip. |
| ORG-3691 | Project Explorer: When it's unpinned, click X button on top of PE will hide instead of close PE by default. (SR2) | In the past, X will close PE and sometimes user doesn't know how to turn it on. So we changed the default behavior to be Hide PE if it's unpinned. System Variable @FDPC to control this: 0 : old way, close |
| ORG-12644 | Menu File: Import: Customize... is renamed to File: Import: Add/Remove File Types... (SR2) | Make it clearer that our File: Import: menus is customizable. |
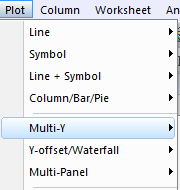
Graphing
New Graph Types
JIRA | SUMMARY | DETAILS | |||
|---|---|---|---|---|---|
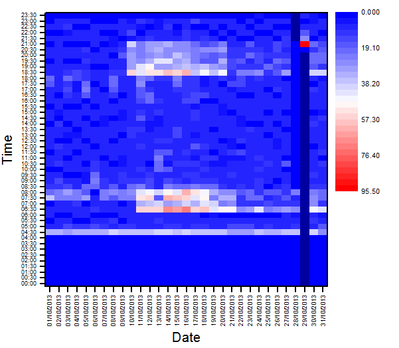
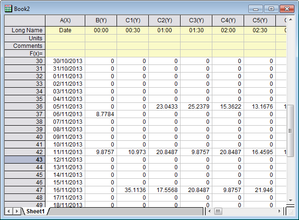
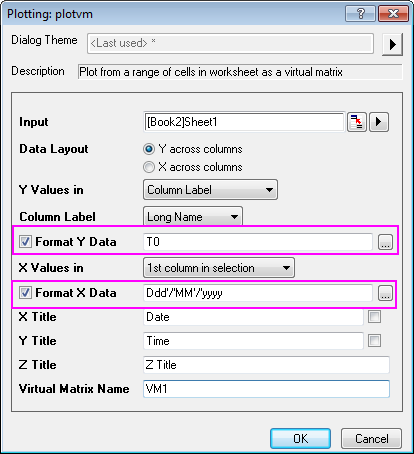
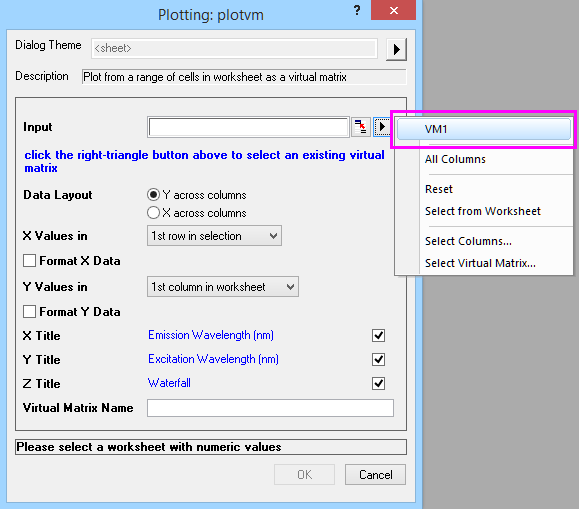
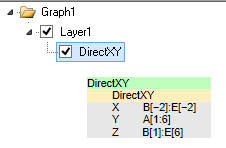
| ORG-10164 | Heatmap Plot | Menu to plot heatmap is Plot: Contour/Heat Map: Heat Map. Toolbar button can be found in the Contour group of 3D and Contour Graphs toolbar. (XYZ data is not supported yet)
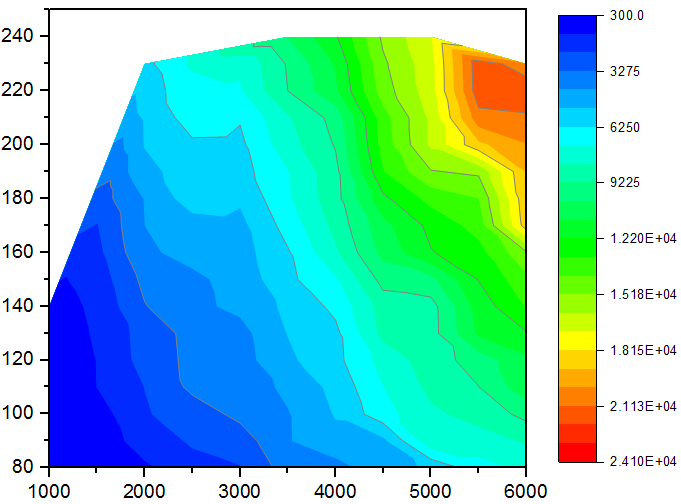
The plotvm dialog to plot heatmap and contour plot with virtual matrix is improved.
| |||
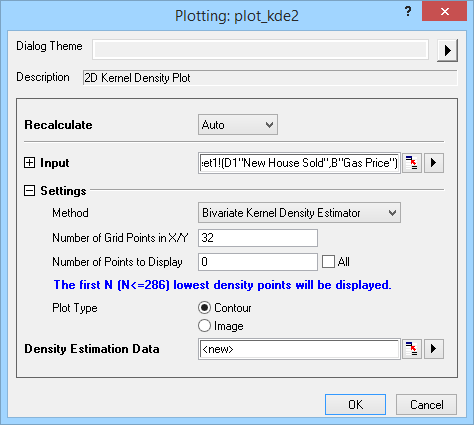
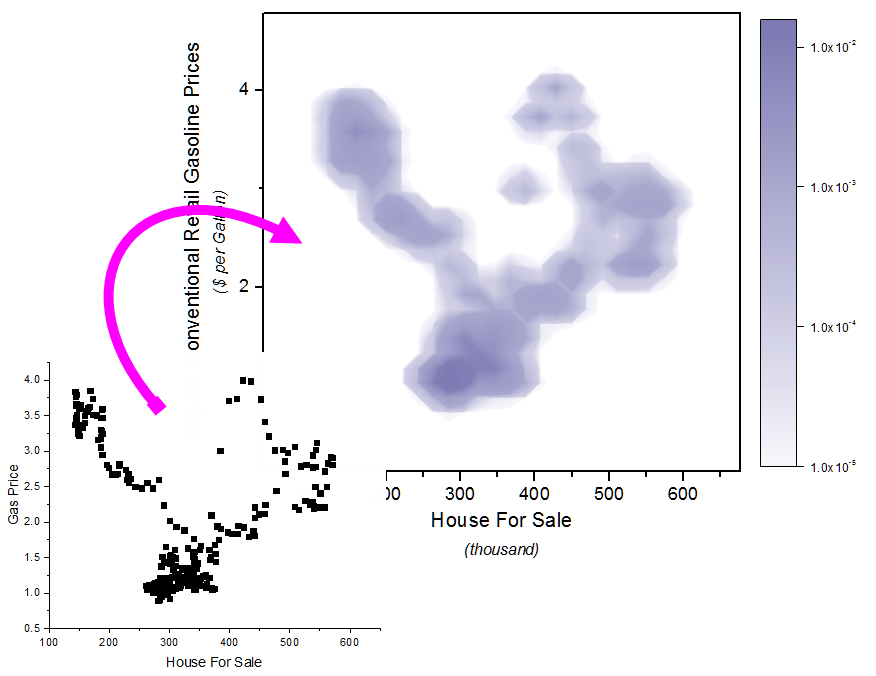
| ORG-11099 | 2D Kernel Density Plot | Plot: Statistics: 2D Kernel Density...
|
Labels, Legend, Color Scale and Bubble Scale
| JIRA | SUMMARY | DETAILS |
|---|---|---|
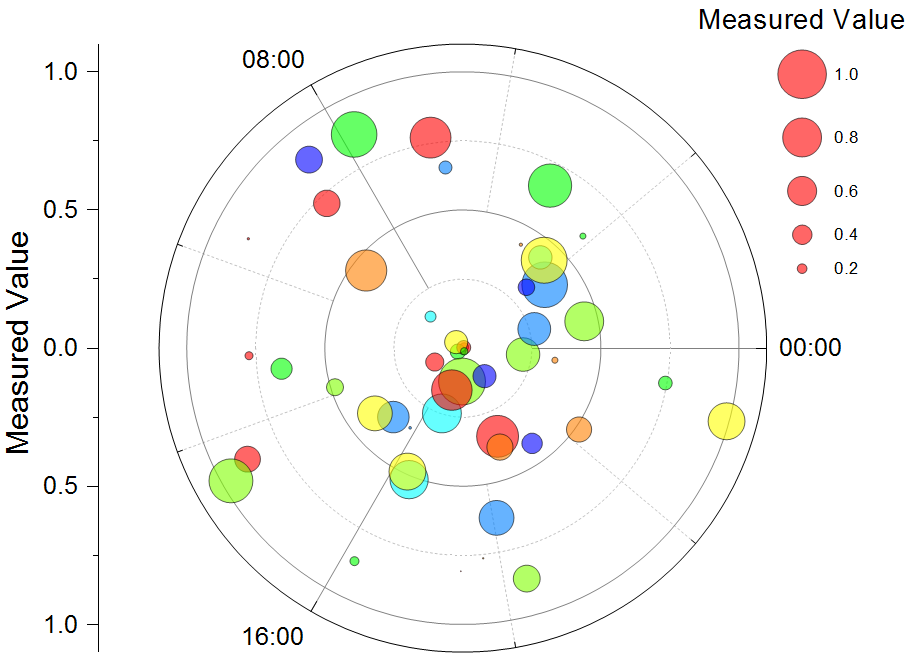
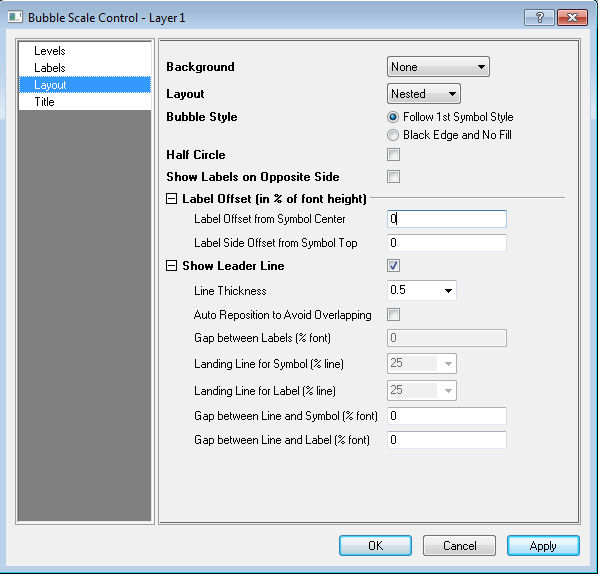
| ORG-10026 | Bubble Plot Legend Support | Note we will show a nested bubble scale legend by default when there is column selected for Total Dissolved Solids in plotpiper dialog.
|
| Color Scale Improvements in Origin 2015 |
| |
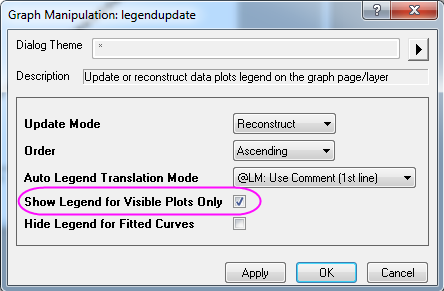
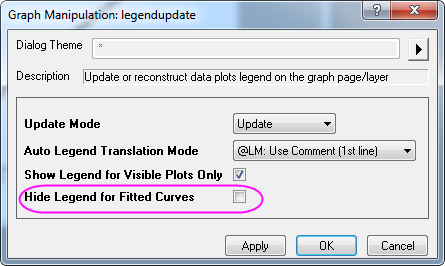
| ORG-10823 | Hide legend of hidden plots | Click Reconstruct Legend button will hide legends of hidden plots. Right click Legend and choose Show Legend for Visible Plots Only, or open Update Legend dialog, specify show/hide legend of hidden plots
|
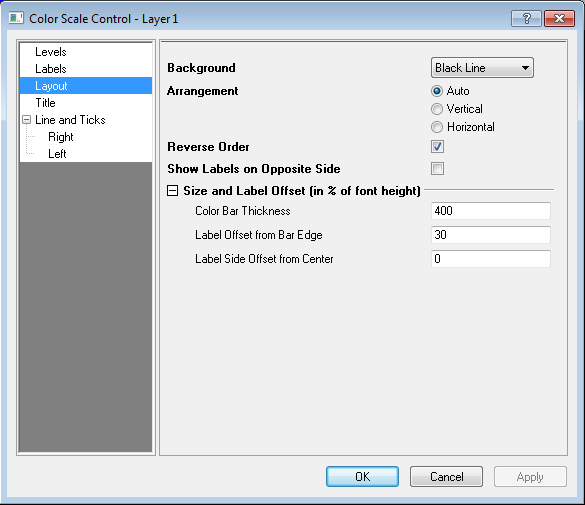
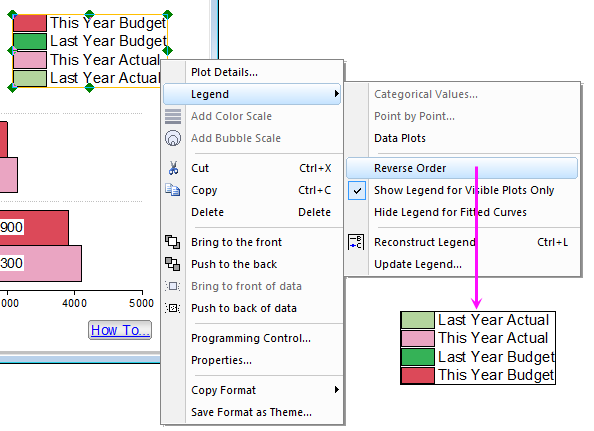
| ORG-11601 | Reverse Legend Order | Right click Legend and choose Reverse Order.
|
| ORG-11650 | Hide Legend for Fitted Curves | Right click Legend and choose Hide Legend for Fitted Curves, or open Update Legend dialog, specify show/hide legend of Fitted Curves
|
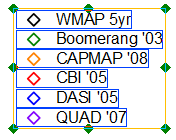
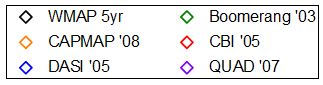
| ORG-11611 | Drag and Drop to to arrange legend entries in multiple columns | Select the legend, drag and drop the legend border while pressing Ctrl button, when the horizontal space is enough for more column, the arrangement will change.
|

Plot Manipulation
JIRA | SUMMARY | DETAILS |
|---|---|---|
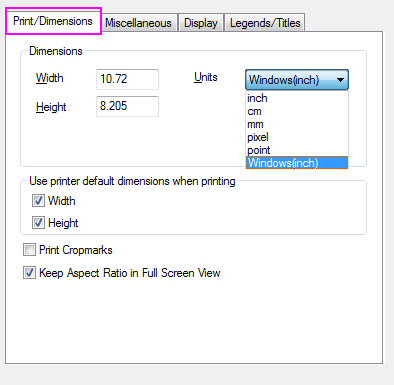
| ORG-11808 | Allow users outside US to see graph page dimension in mm | In graph (Plot Details) Print/Dimensions Tab, the default value of the Units is Window(unit), which will be altered according to Windows: Customize Format: Measurement system:U.S./Metric.(To set this value, click Control Panel\Clock, Language, and Region,\Formats tab\Additional Settings.) Specifically, for United State and Great Britain, the default value would be Window(inch); for the rest of the world, the default value is Window(mm)
|
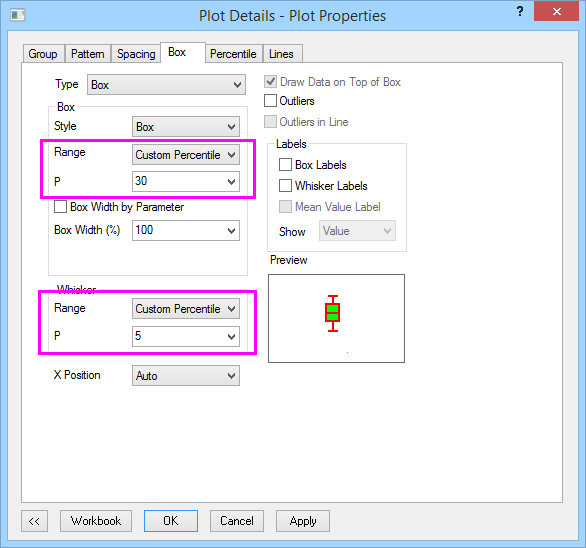
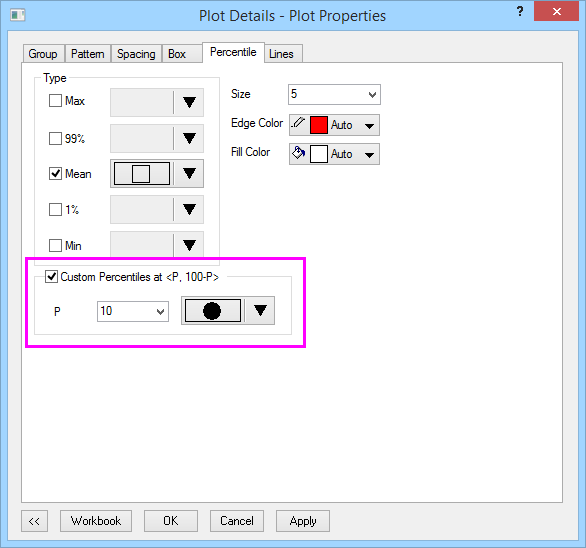
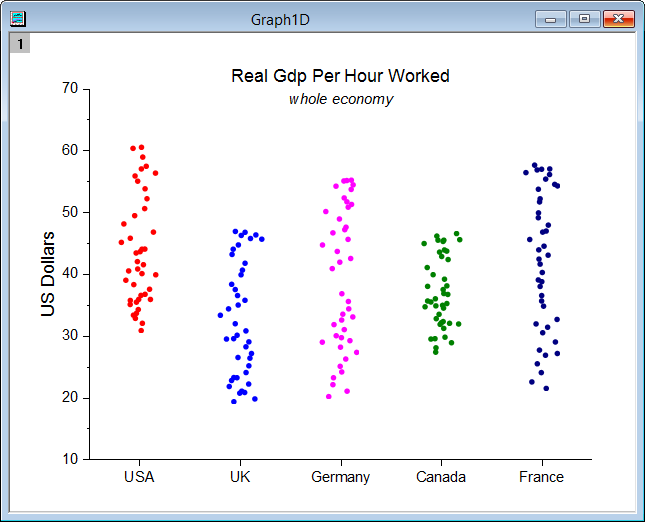
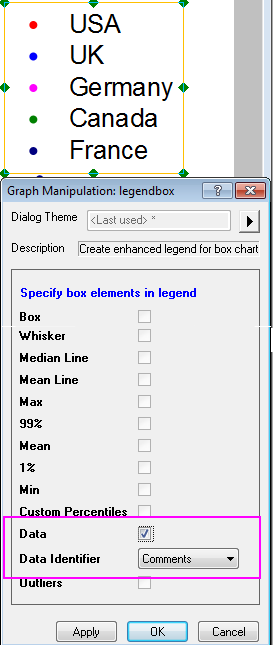
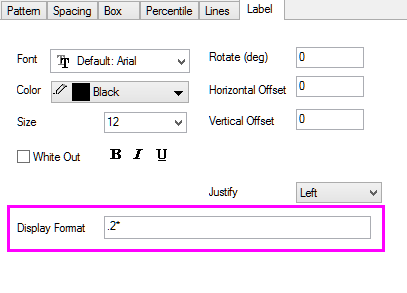
| Box Chart Improvement | Custom percentile range of the box and Whisker
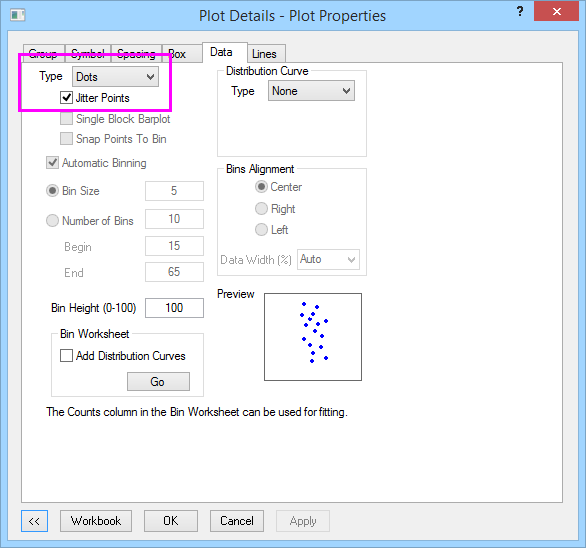
Jitter data in box plot This graph could be also plotted by select columns and select Plot: Symbol: Column Scatter. Note: To plot group column scatter, go to Plot: Statistics: Group Box Charts-Indexed Data/Raw Data, select Box_column scatter for Graph Theme.
Related Box Chart Component dialog improvement
Box Chart Label Format Display Control
Data reader in box plot | |
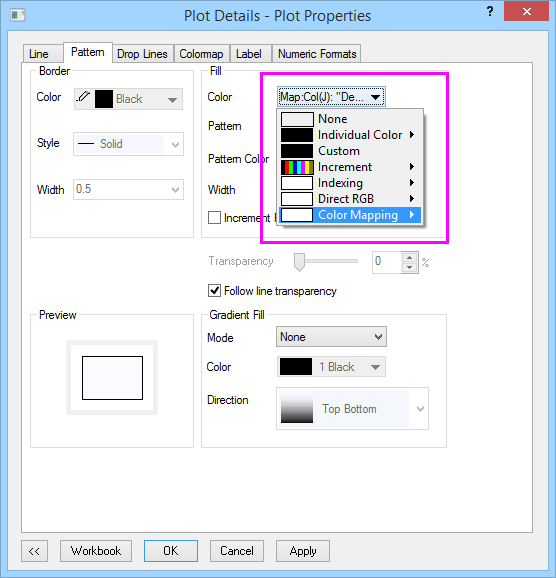
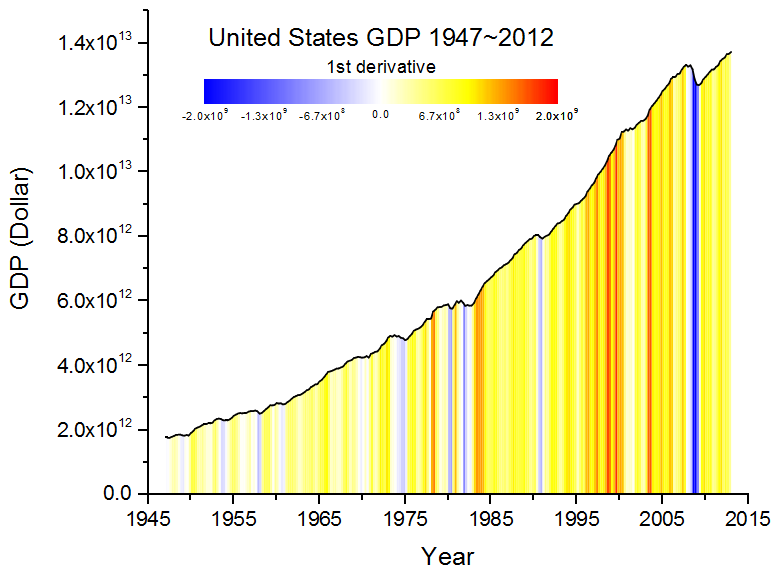
| ORG-11059 | ColorMapped Fill Color under Curve | Advanced Fill Area Pattern
|
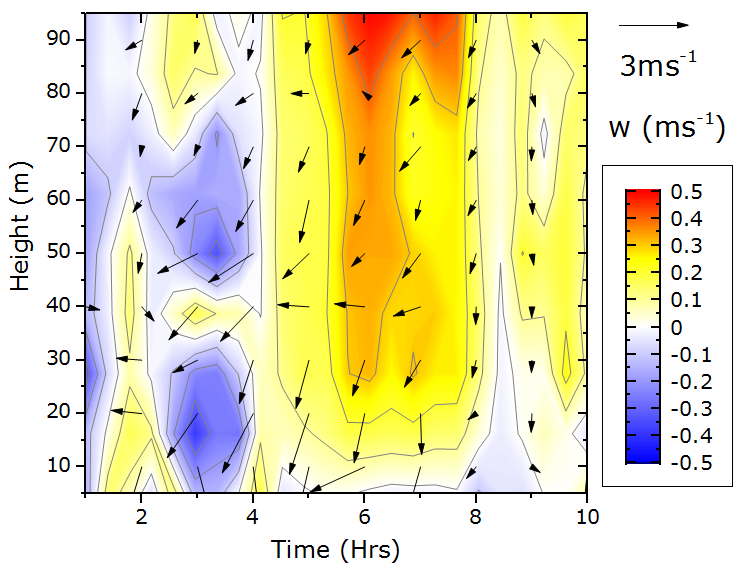
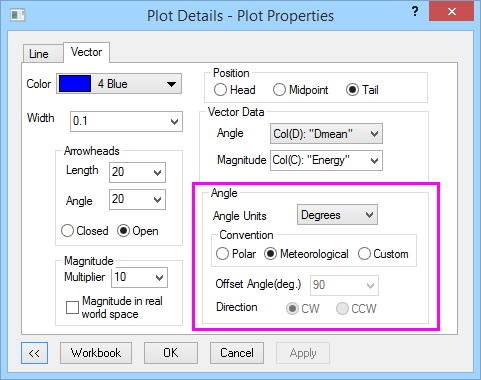
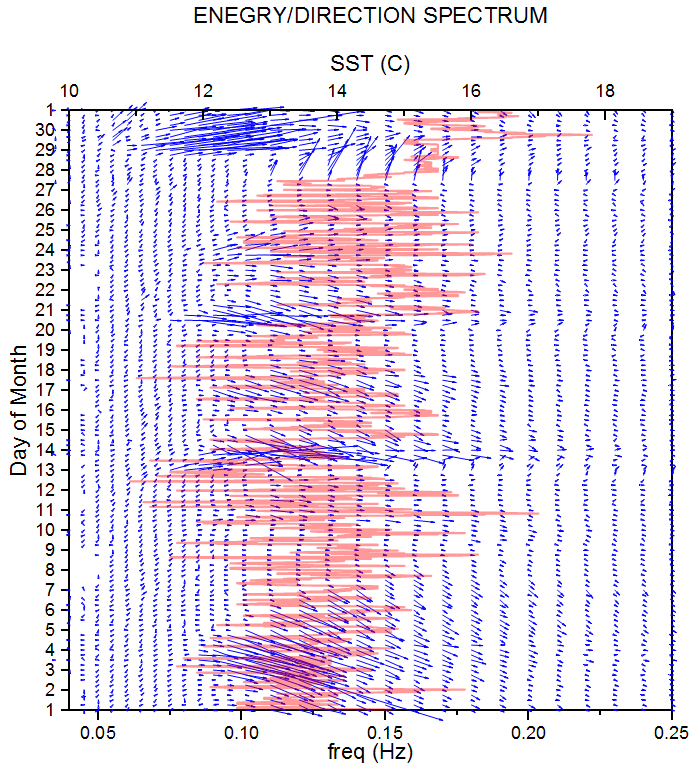
| ORG-7804 | Meteorological convention for XYAM Vector Plot | Polar/Meteorological/Custom Vector Convention
|
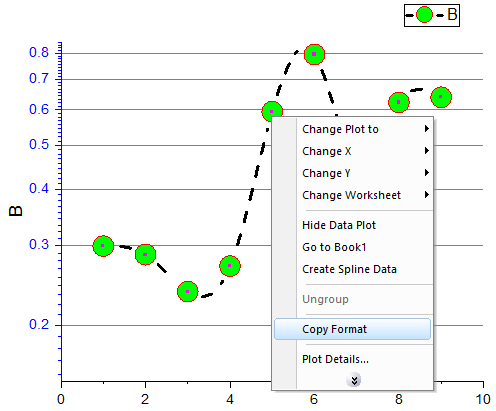
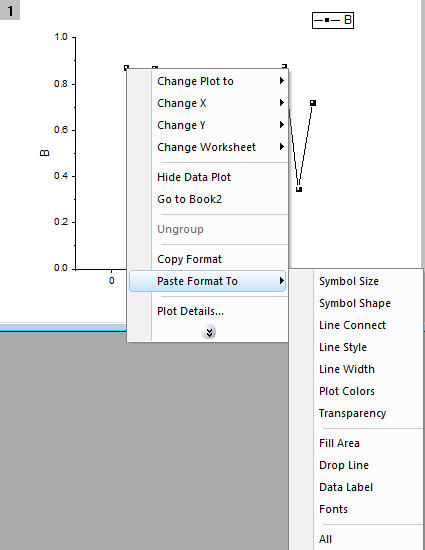
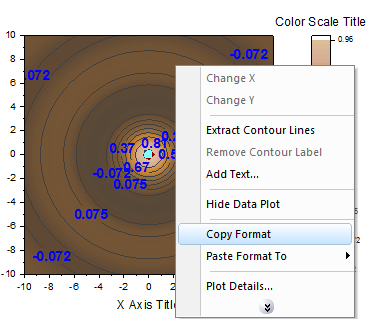
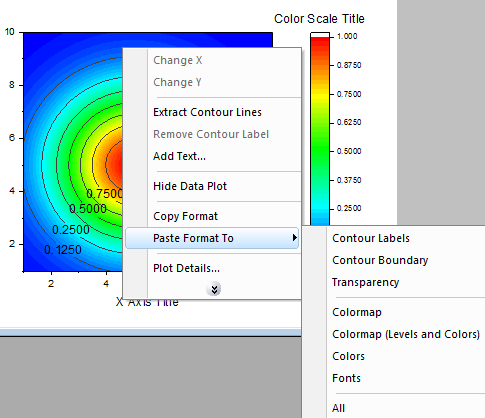
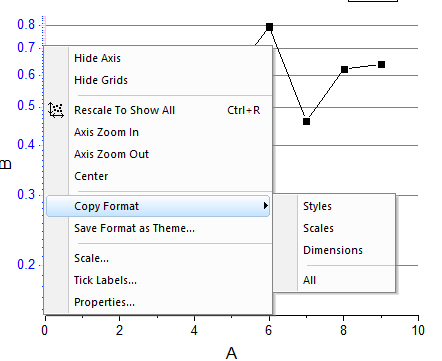
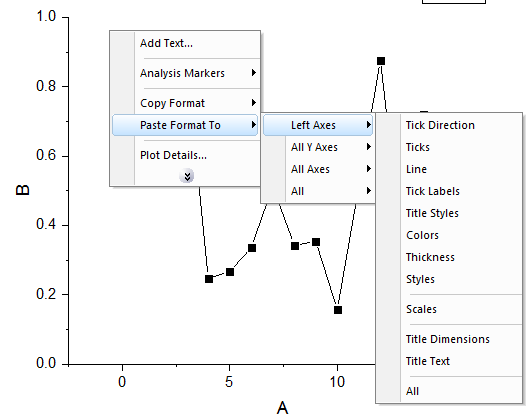
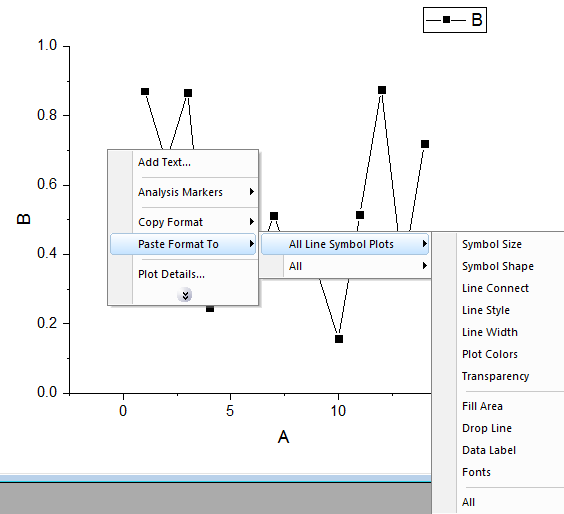
| ORG-10640 | Improvements on Copy Format and Paste Format context menus | In the past, people complained that we gave too many options when copying format. Sometimes it's confusing and hard to tell which format to copy. If user chooses the wrong format to copy, he/she has to copy format again before pasting again. Therefore we changed the design so that when copying format, show no options for less less options, while when pasting format, give more options so user can decide later what to paste and paste multiple times. 450pxE.g. Copy and Paste Format on Line+Symbol plots:
New Paste Format To Context MenuThis is used to better deal with when right click in page/layer level to paste format to.
E.g. if right clicking on axis and choosing Copy Format, and then right click in blank area of another graph, Paste Format To context menu will show, allowing user to what format/style to apply. E.g. if right clicking on line+symbol plot instead and choosing Copy format, Paste Format To will show different target and format/styles.
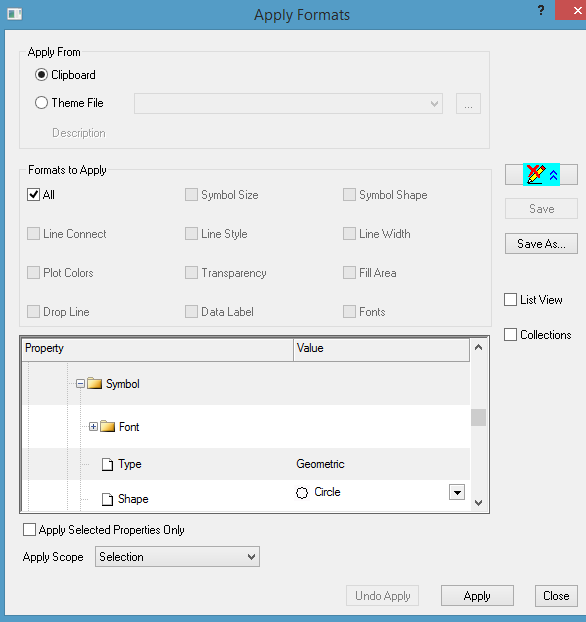
Improvements on Apply Formats dialog via Edit: Paste Format... menuIn the past, after copying format, user can choose Edit: Paste Format... to edit the format on clipboard and where to apply to.
|
| ORG-11202 | Square-ended XY Scale object | New system varialbe @LCG added.If set @LCG=1, then lines in XY Scale will be square-ended. |
| ORG-5705 | Actively update floating graphs when data is changed in worksheet | View: Actively Update Plots menu is checked by default in 9.2 |
| ORG-11245 | Ctrl+P or Ctrl+', or Ctrl+" to add bigger and closer prime symbols | In the past, when adding prime symbols ' or " in superscript, they were tiny and too far away from the text. For some foreign keyboard, ' and " may not be in the same location as English keyboard. So we added hotkey Ctrl+P |
| ORG-11765 | More Distribution Curve types in Histogram | Gamma, Kernel Smooth, and Binomial distribution curve types are added. |
| ORG-11000 | Scatter Matrix by template/theme | Template entries been added on dialog to allow users specify its own templates |
| ORG-9234 | Skipped Points would not break the connect line | In line+symbol plot, you no long need to set Gap to Symbol to avoid line broken by skipped points. |
| ORG-9458 | Improve Histogram+Probability Plot | Showing overlaid plots with double y axis instead of stacked 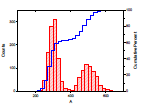 |
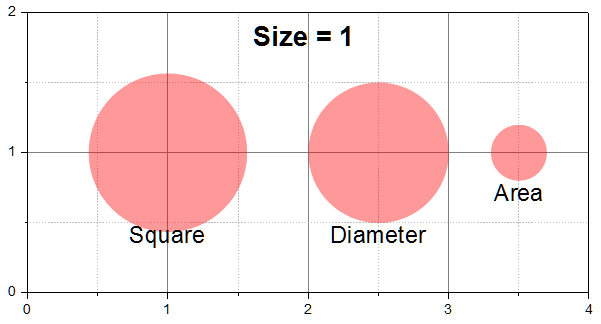
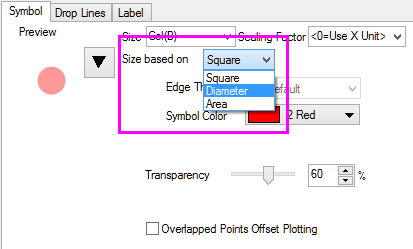
| Square/Diameter/Area Based Symbol Size Mapping | When using size mapped symbols with shape of Circle/Triangles/diamond/Hexagon/Star/Pentagon, an extra drag-down list will appear asking for size drawing definition.
| |
| ORG-11202 | Need square ended graphing object (SR1) | Introduce system variable @LCG to specify the line cape type for XY scale, arrow, line and polyline object square end: 0 = Line cap round 1 = Line cap square 2 = Line cap flat |
| ORG-12545 | Support repeated offset pattern for Stacked Plot (SR2) | Set Offset in Plot Detail dialog's Stack tab to be Constant and fill edit box like 0 10, the offset will like 0 0 10 10 20 20... |
Graph Page and Layer
| JIRA | SUMMARY | DETAILS |
|---|---|---|
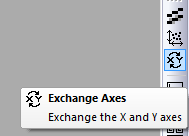
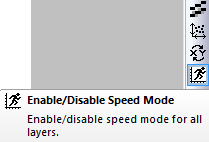
| ORG-11670 | Speed mode ON/OFF toggle on Graph toolbar | Easy way to toggle speed mode on or off for all layers in active graph. |
| ORG-4229 | Support reorder when swapping layers | A checkbox is added to layer management dialog so user can swap both layer position and index. |
| ORG-10202 | Turn on/off layer frame by Plot Details dialog | Layer Frame is now included in Plot Details (layer) dialog, display tab, Show Elements group. |
| ORG-11382 | Using 1st Layer's poperty in System Theme when adding new layers | Controlled by system variable @LST If @LST=1, when adding new layer, it will use system theme's 1st layer/consolidated layer's property from the system theme |
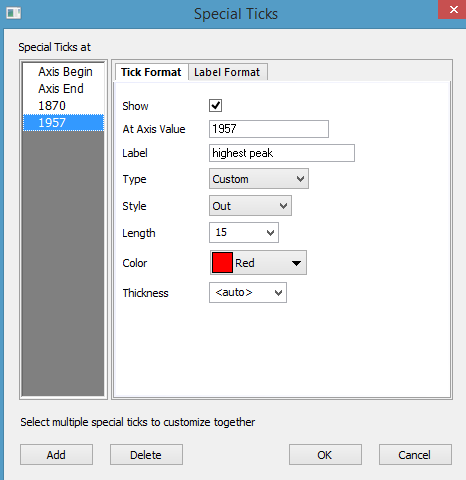
Axis
| JIRA | SUMMARY | DETAILS |
|---|---|---|
| ORG-11932 | Auto set Y axis tick labels to Time if Y column is Time | Y axis tick label will be set to time if Y column is Time format. You can use @TLD=0 to disable the feature. |
3D and Contour
JIRA | SUMMARY | DETAILS |
|---|---|---|
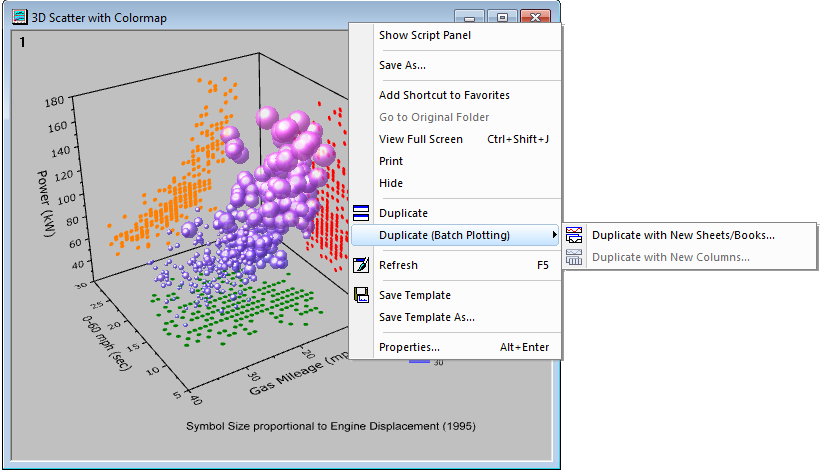
| ORG-9828, ORG-9940 | Batch Plotting for 3D and Contour Graphs | Batch plotting in Origin 2015 also supports 3D and contour graphs from XYZ data How to:
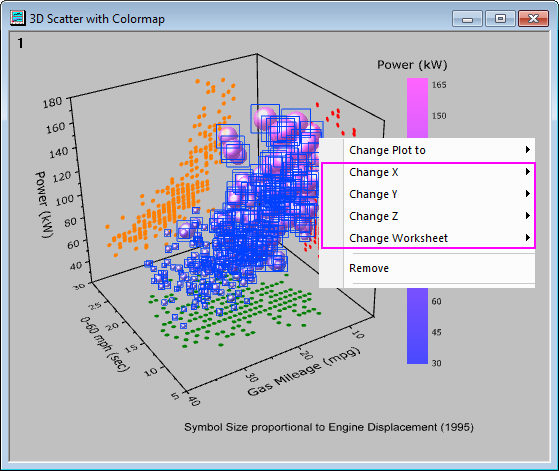
Change X/Y/Z Data of the Plot3D and Contour plot from XYZ data (worksheet) can also change X/Y/Z data of the plot from the short cut menu of the plot
How to:
|
| ORG-10683 | Color indexing/Mapping for 3D Line Plot | 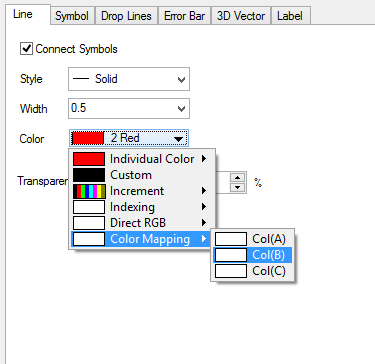 |
| ORG-10312 | Custom Scale for 3D Axis | 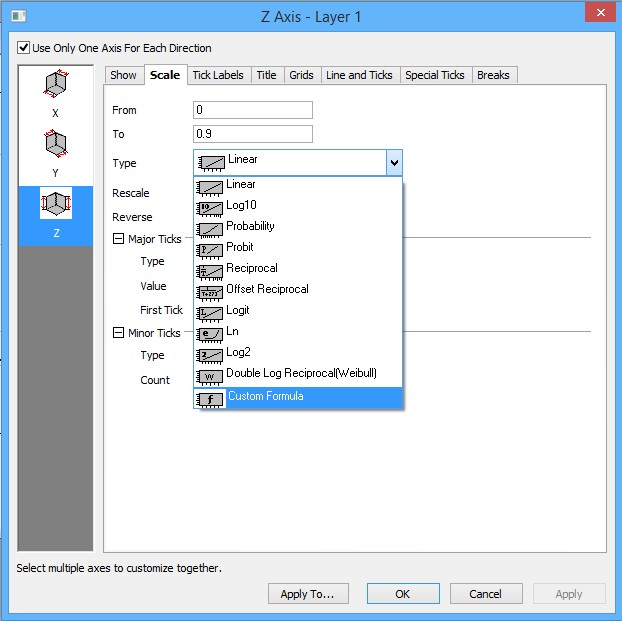 |
| ORG-6631 | OGL 3D frame should support move by keyboard | 3D OpenGL layer frame supports to move by hitting up/down/right/left direction keys on Keyboard. |
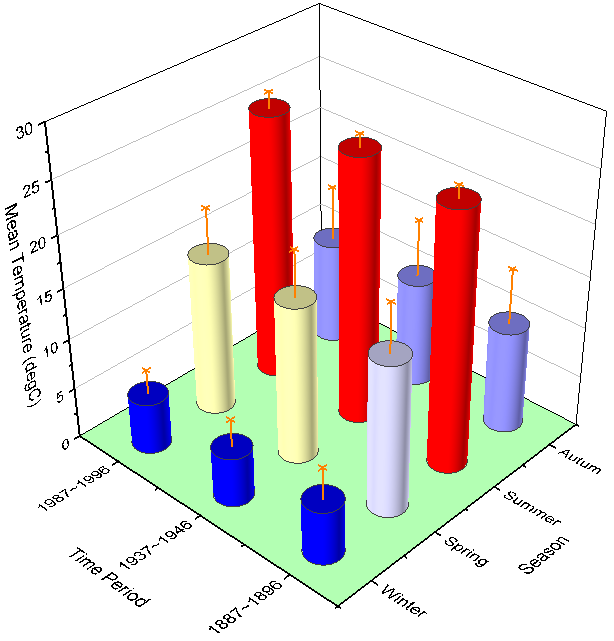
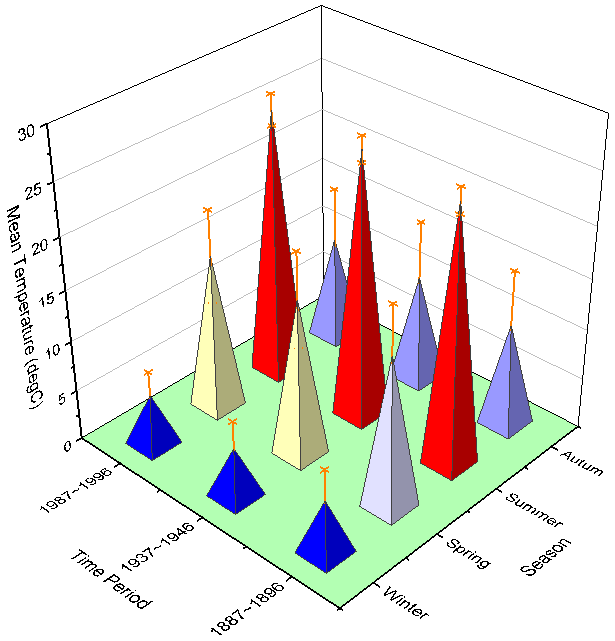
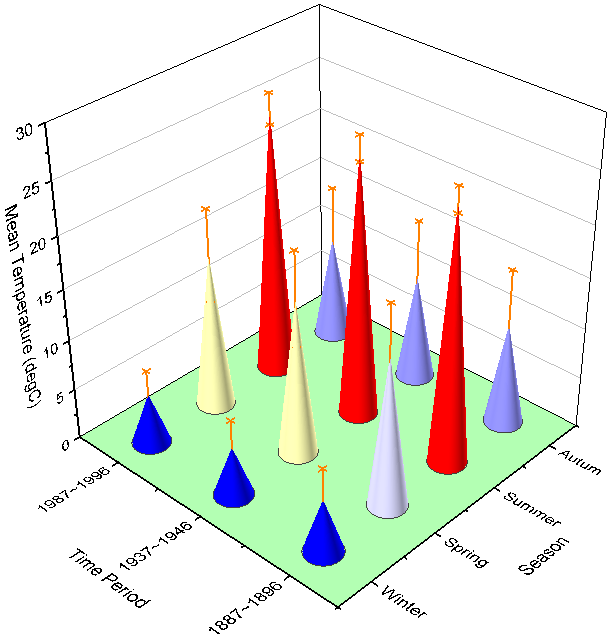
| ORG-85 | 3D Bar plot different shape support (Script Only) |
|
| ORG-11046, ORG-11660, ORG-10690, ORG-11221 | Advanced Virtual Matrix Support | Virtual Matrix Manager If you plot 3D or Contour graph from a range of cells in worksheet as a virtual matrix, a virtual matrix will be generated. You can use Tools: Virtual Matrix Manager to manage the existed virtual matrices. ClickWorkbookbutton inPlot Detailsdialog will also go toVirtual Matrix Managerdialog.
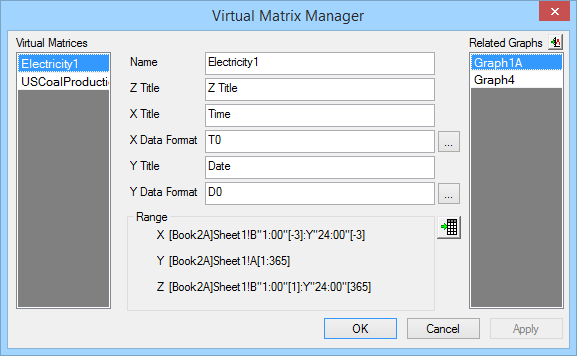  User can easily tell where the Virtual Matrix is made from and how.
|
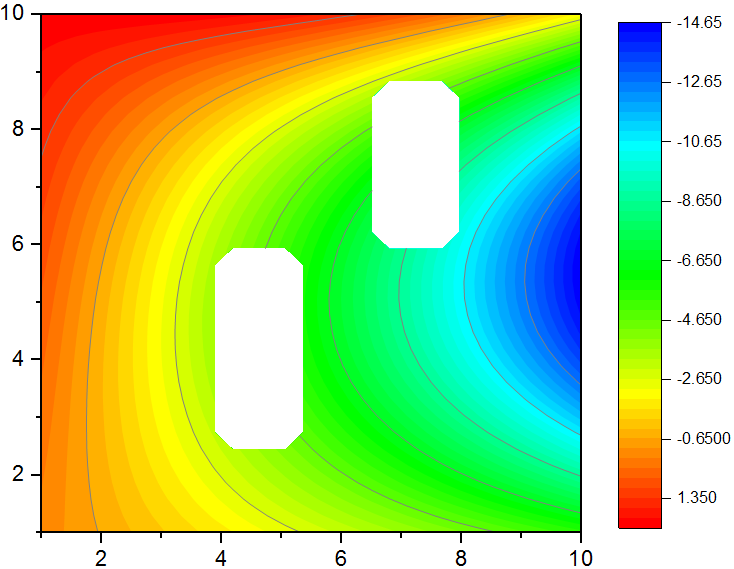
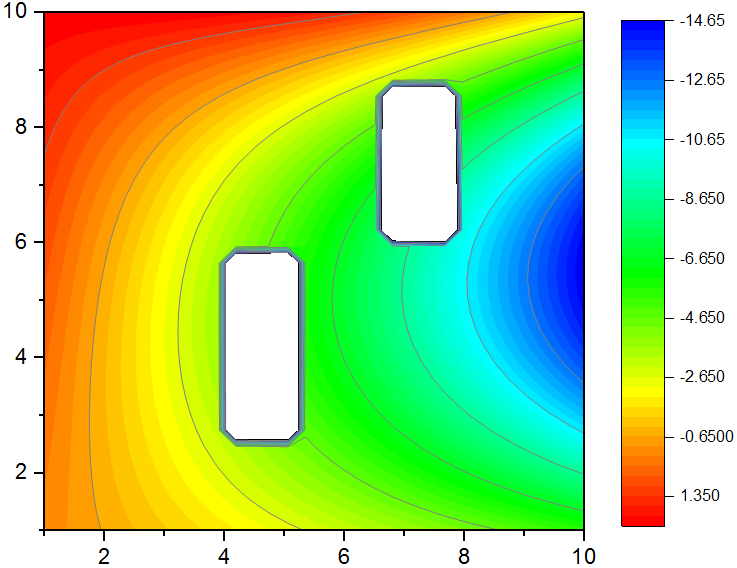
| Contour Plot Improvements | Contour plot improvements with missing values in Matrix System variable @cmt is added in 9.2 to control how missing values in Matrix are dealt with in 9.2. @cmt=1 (default and new behavior): no interpolation will be done around missing values. See 1st one. @cmt=0 will do interpolation around missing values. See 2nd graph. Old behavior.
Options to ignore Z missing values in XYZ Contour / Surface graphs Run the following command with Contour plot active in 9.2 to ignore missing values in XYZ columns. set %c -lczm 1
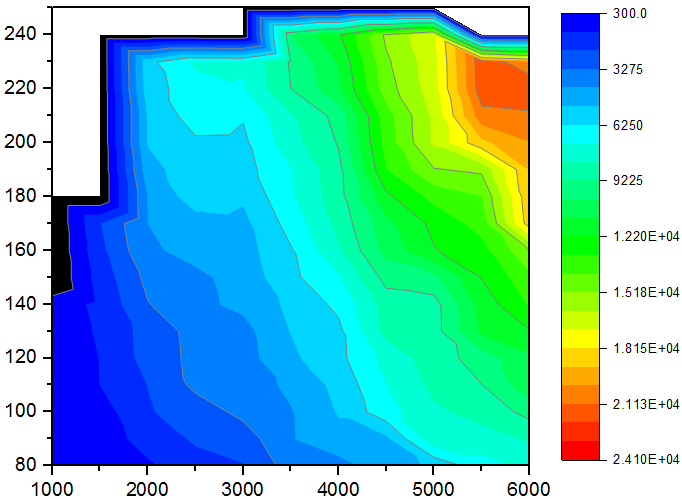
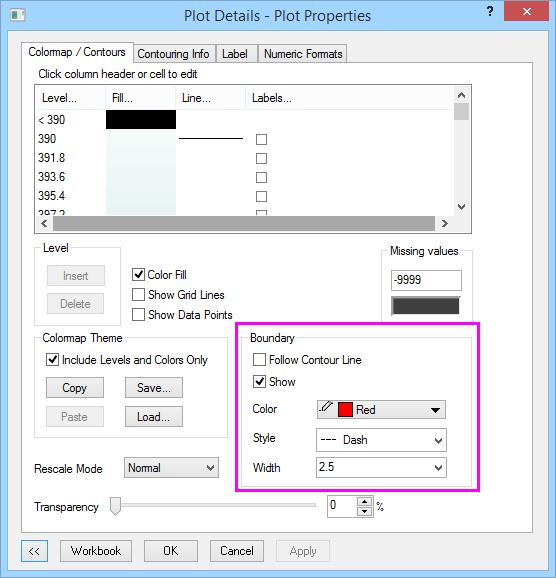
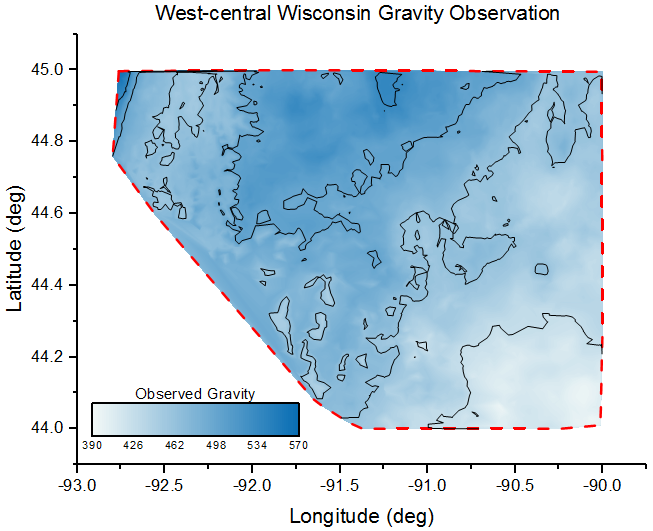
Show/Hide Boundary line and Customize Border Line
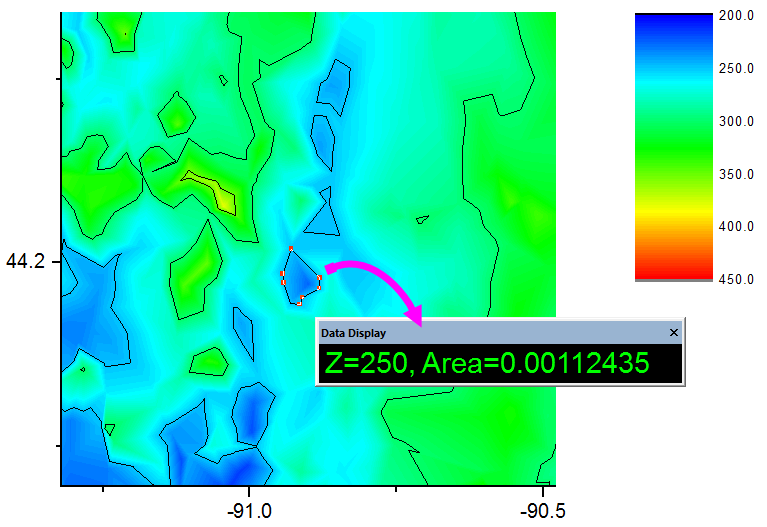
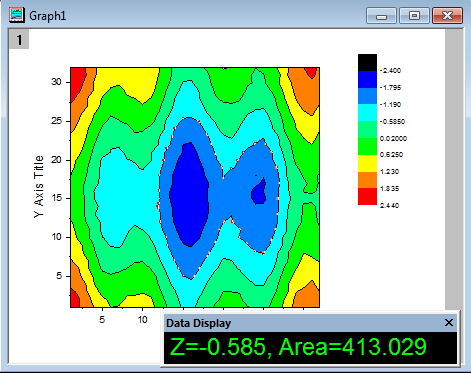
Show Polygon area of selected contour line on Data Display Single click a contour line several times till only that contour line is selected. Z and Area will show in Data Display window, which supports right click to copy the text.
| |
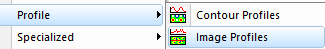
| ORG-11696 | Image Profile and Contour Profile are grouped under Plot: Profile menu. |
|
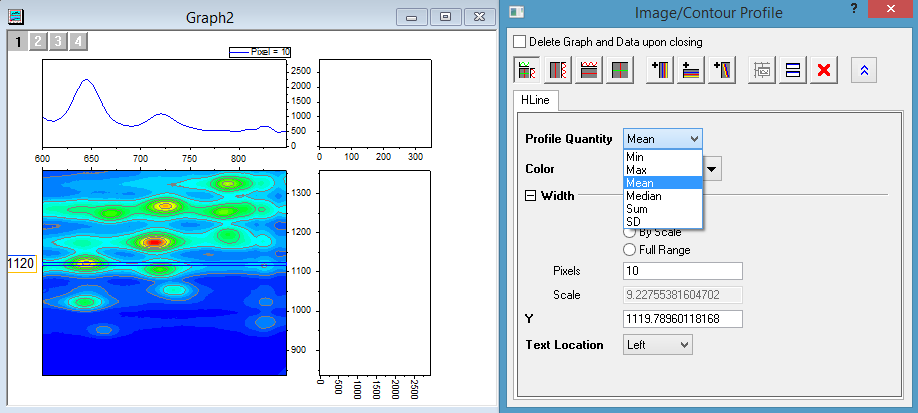
| ORG-11541 | Profile along arbitrary line. Width control available | 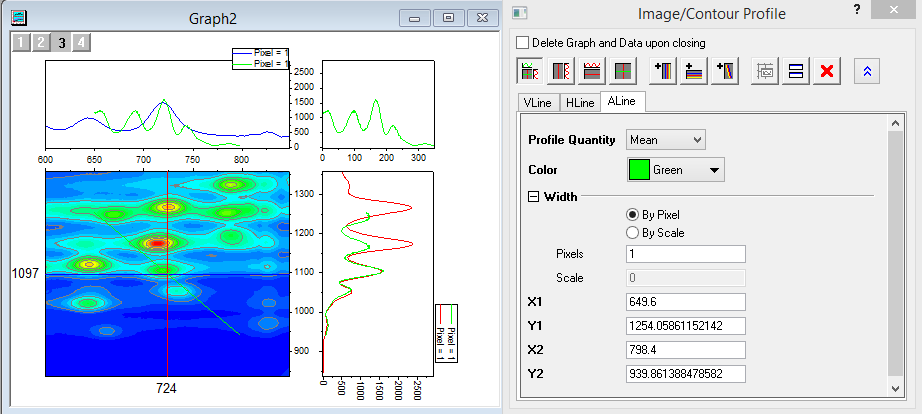 |
| ORG-1526 | More Profile Quantity options |
|
| ORG-1526 | Profile for Full Range | 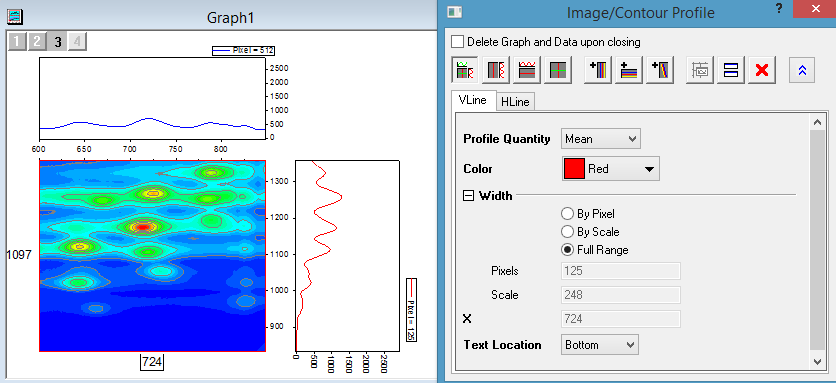 |
| ORG-11671 | Create Image Profile Directly form Virtual Matrix | |
| ORG-11659 | Profile Gadget | With image/contour graph window activated, user can choose Gadget: Image Profile menu to open the tool. |
| ORG-11968 | Support Duplicate Graph with New Columns for 3D graphs plotted from XYZ column. (SR1) | We added batch plotting for 3D graphs plotted from matrix data in Origin 2015 SR0. Expanded it to 3D graphs plotted from XYZ columns now. |

Analysis
| JIRA | SUMMARY | DETAILS |
|---|---|---|
| ORG-11292 | General: Seven OriginPro Only Features Are Moved to Origin | In Origin 2015, seven features are also available in Origin, which previously were only available in OriginPro.
|
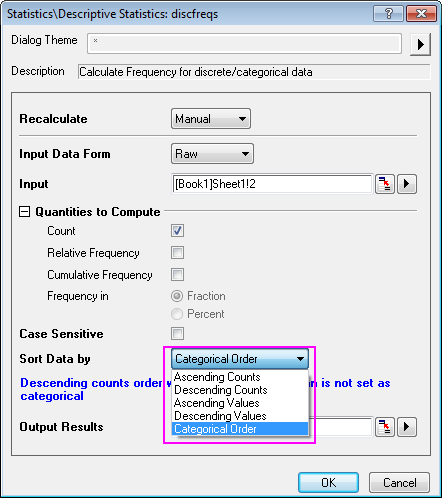
| ORG-11749 | General: Control Group Column Order in Dialogs | The input grouping range control in following dialogs is improved to enable group column order control
|
| ORG-11137 | General: System variable @dam to set the default Recalculation Mode for all dialogs that apply | For example. Set Column Values Dialog, XF-Based Dialogs, and Operation-Based Dialogs). 0 = None, 1 = Auto, 2 = Manual. Default is 2 as before. |
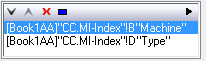
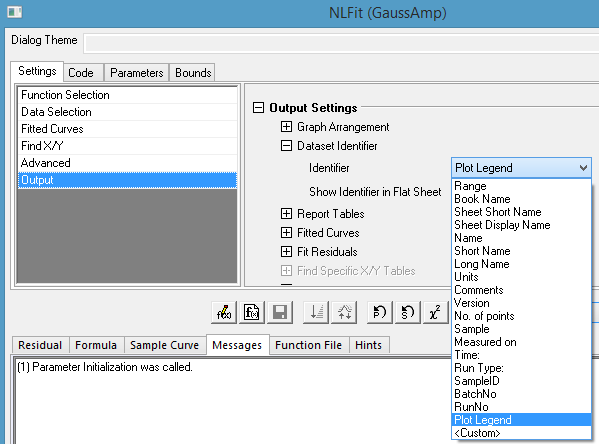
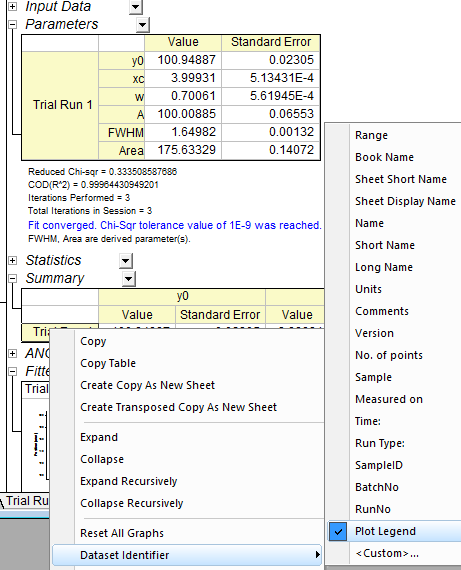
| ORG-11550 | General: Using Plot Legend as Data Identifier | When user is doing fitting from Graph, user can set Legend as the Data Identifier in report.
|
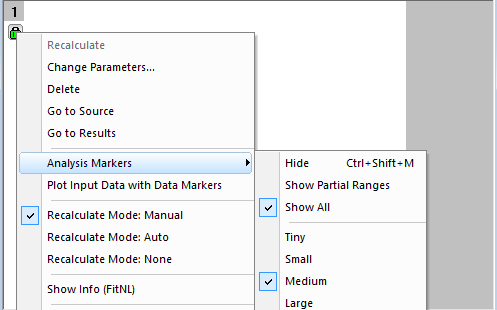
| ORG-10677 | General: Analysis Marker context menu on green lock's context menu | Add Analysis Marker context menu when click on green lock on graph to turn on/off and change size of analysis markers.
|
| ORG-11304 | General: XF will no longer change column short name when output | Analysis tools which use ReportData as output data type like FFT, Average Multiple Curves, Discrete Frequency, etc will leave output column short name as default and use long name as identifier only. |
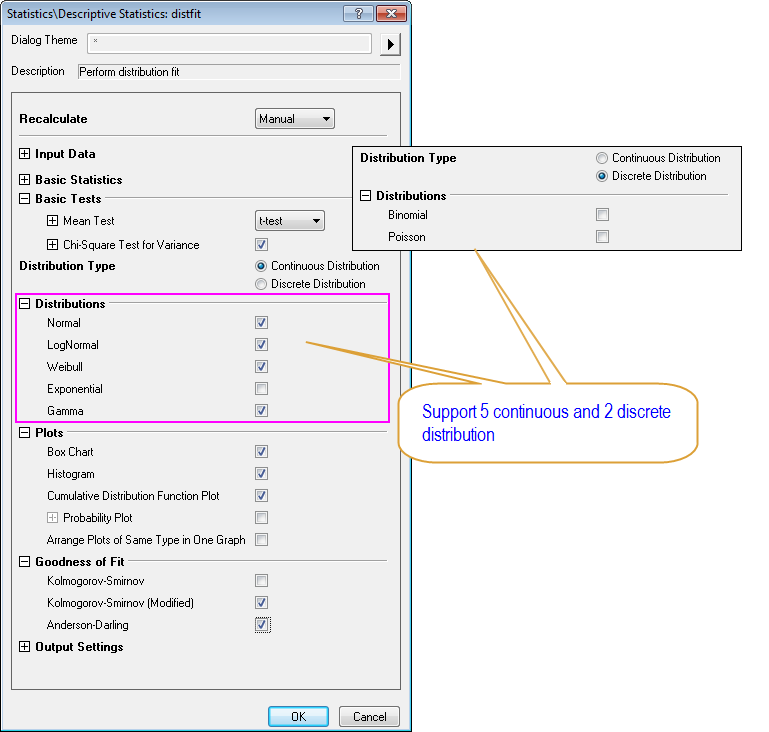
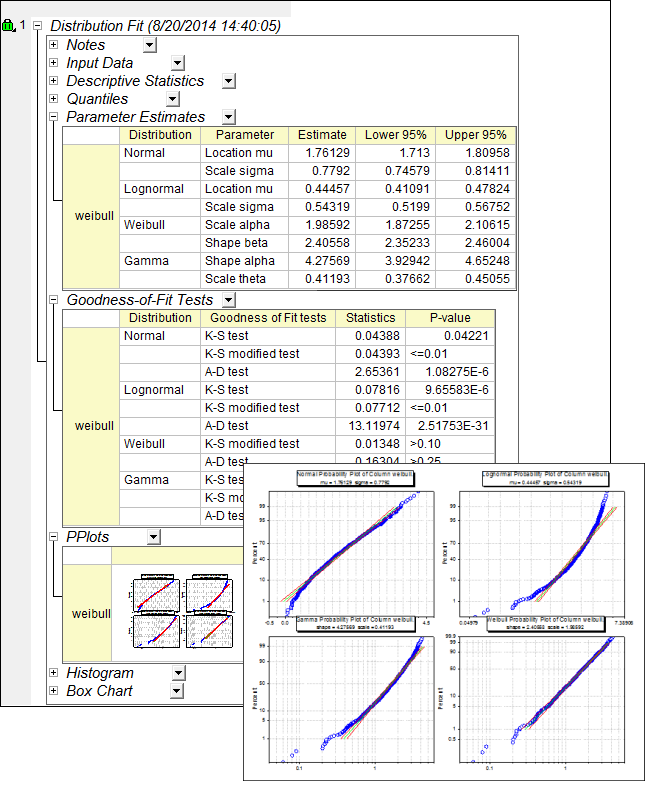
| ORG-8439 | Fitting: Distribution Fit | Origin 2015 introduce Distribution Fit which helps user to find the proper distribution for his data. How to:
|
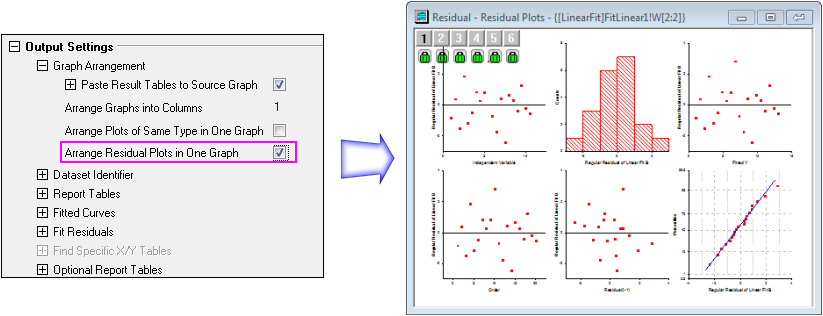
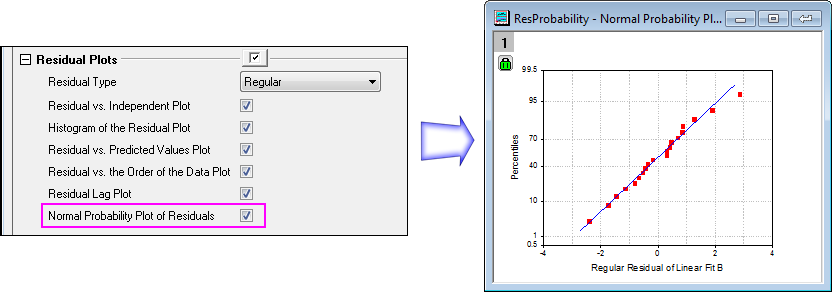
| ORG-10263 | Fitting: Improve Fitting Graph and Residual Graphs | Arrange multiple residual plots in one graph with multiple layers
Support Normal Probability Plot of Residuals
|
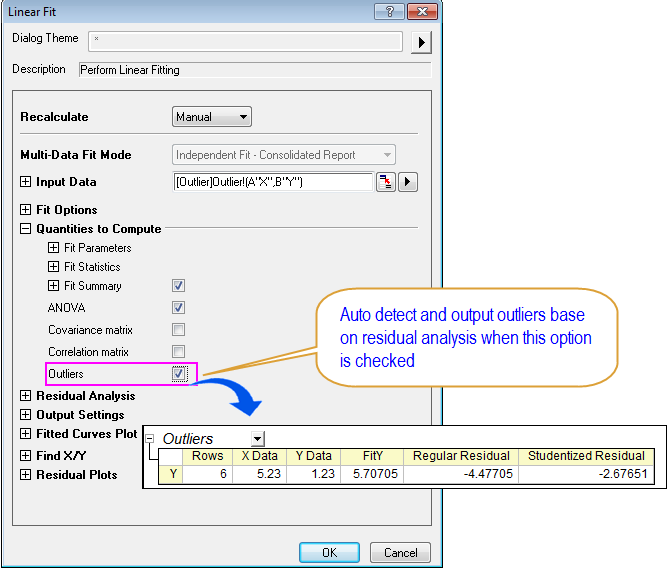
| ORG-10263 | Fitting: Auto-detect Outliers in Linear Fit Tool | In Linear Fit tool, outliers can be auto-detected and output.
|
| ORG-11852 | Fitting: More Results supports in Apparent Fit |
|
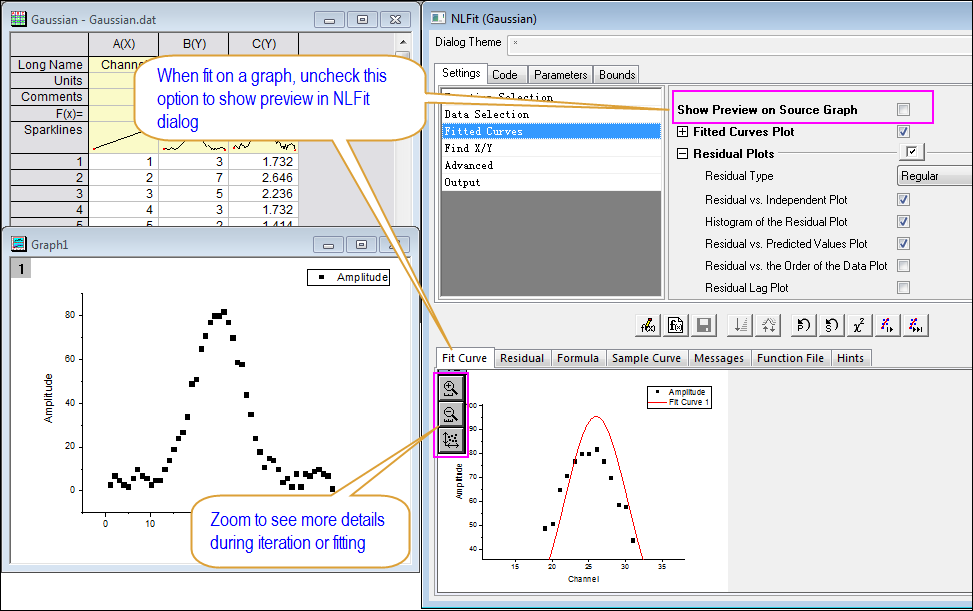
| ORG-10303 | Fitting: Keep Zoom Status on Fit Curve tab When Doing Interactions | When doing a fit from graph, user can first uncheck Show Preview on Source Graph checkbox on Fitted Curves page. Then Fit Curve tab will show a preview fitted curve. Zoom In, Zoom Out and Rescale buttons are added on the tab to see more details during iteration or fitting.
|
| ORG-11320, ORG-11661, ORG-6206 | Fitting: New Build-in Fitting Functions | Function Name: Bingham, Cross, Carreau, Herschel, Mauro-Yue-Ellison-Gupta-Allan(MYEGA), Vogel-Fulcher-Tammann(VFT), BiHill, LangevinMod, ExpGrowDec, ExpGrow3Dec2 |
| ORG-11884 | Fitting: New Category of Enzyme Kinetics Functions | Origin 2015 added a new category Enzyme Kinetics for build-in fitting function and following function are included in it Function Name: CompInhib, NoncompInhib, UncompInhib, MixedModelInhib, SubstrateInhib, MichaelisMeten, Hill |
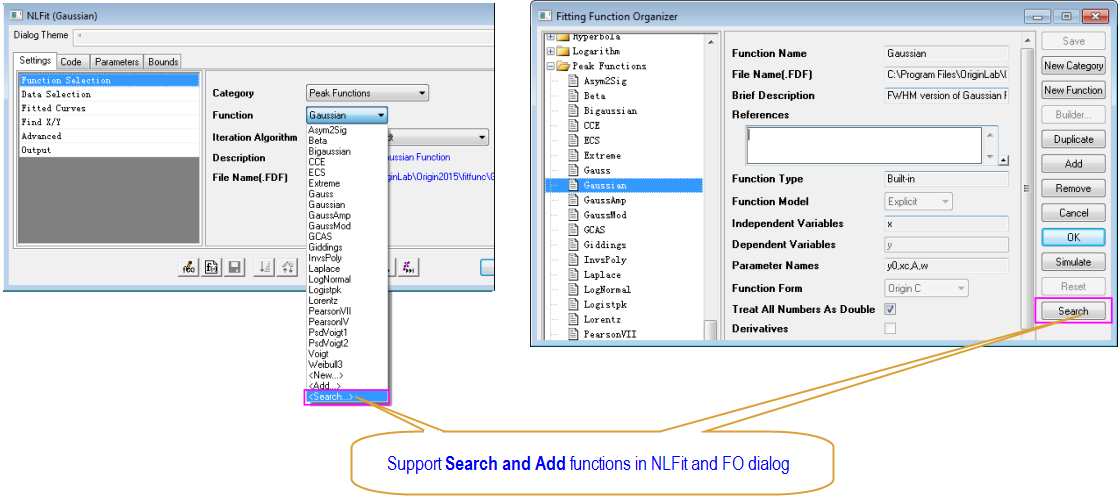
| ORG-11747 | Fitting: Add and Search function | User can now add existing function directly from NLfit dialog Search function button available in NLFit dialog and the Fitting Function Organizer dialog
|
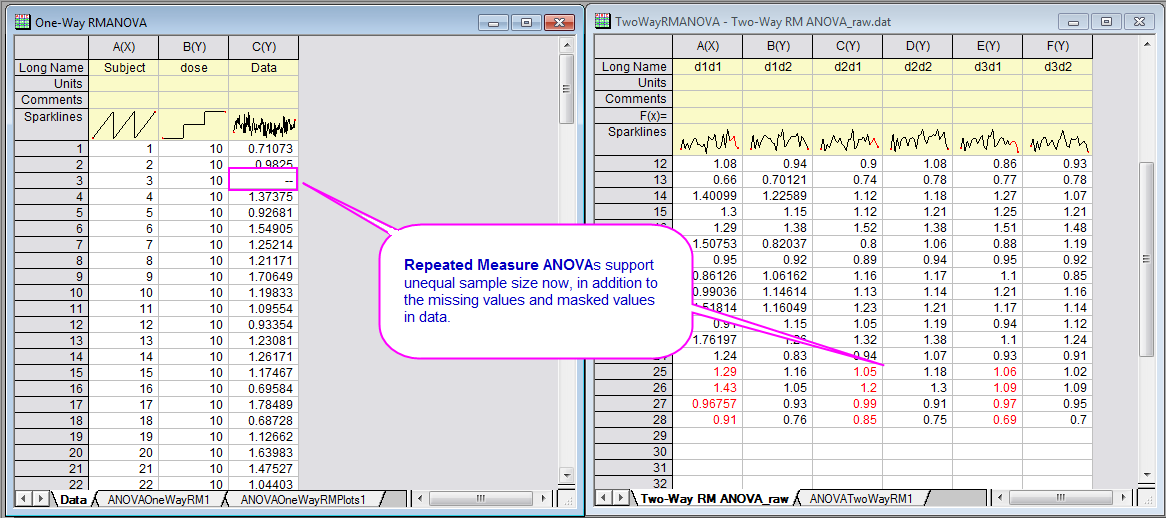
| ORG-4418 | Statistics: Repeated Measures ANOVA for Unbalanced Data | From Origin 2015, One-Way and Two-Way Repeated Measures ANOVA tools support data with unbalanced design How to
|
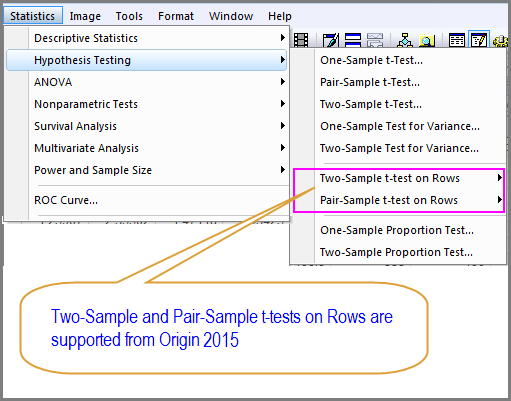
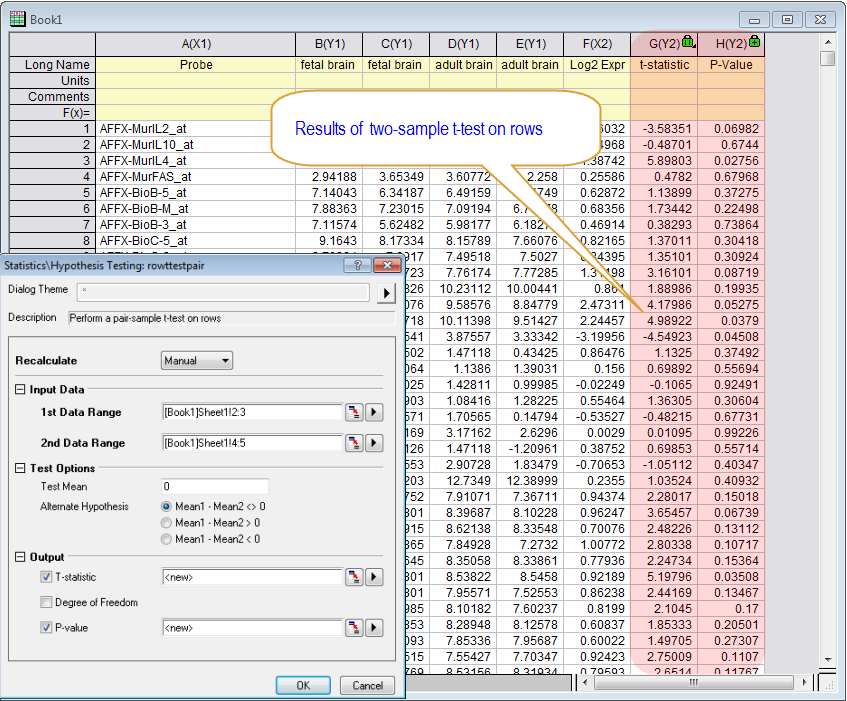
| ORG-8481 | Statistics: t-tests on Rows | We have introduced t-test on rows tools. These tools are accessible from the Statistics: Hypothesis Testing menu
|
| ORG-11480, ORG-10803, ORG-11347, ORG-9795, ORG-10057 | Gadgets Improvements |
|
| ORG-11336, ORG-11417, ORG-11438 | Mathematics Improvements |
|
| ORG-8681 | Peak Analysis Improvements |
|
| ORG-7834, ORG-6784, ORG-8595, ORG-11265, ORG-331 | Statistics Improvements | Correlation Coefficient
Principle Component Analysis
Hierarchical Cluster
Discrete Frequency
|
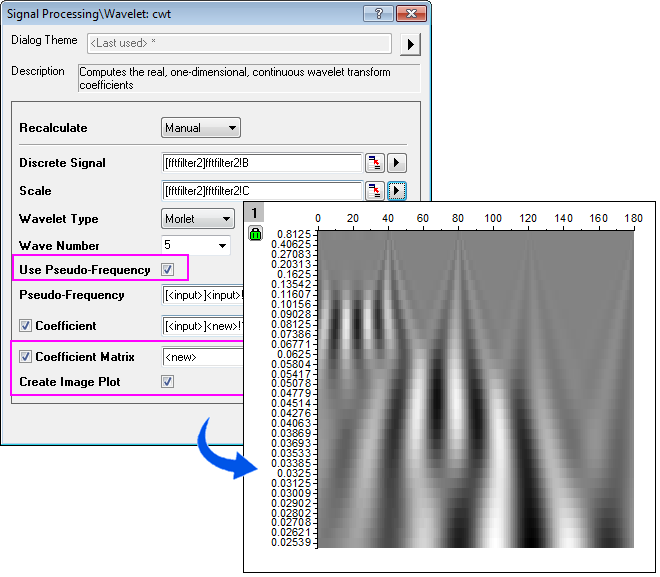
| ORG-10892 | Signal Processing Improvements |
|
| ORG-12071 | Statistics: Cluster Gadget: Support statistics in X direction (SR1) | A "X Value" check-box is added in Calculation tab of the Cluster Preferences dialog. |
| ORG-11458 | Signal Processing: FFT Gadget: Add option to remove DC offset (SR1) | A "Keep DC Offset" check-box is added in the Preview graph of FFT Gadget. |
Data Processing
| JIRA | SUMMARY | DETAILS |
|---|---|---|
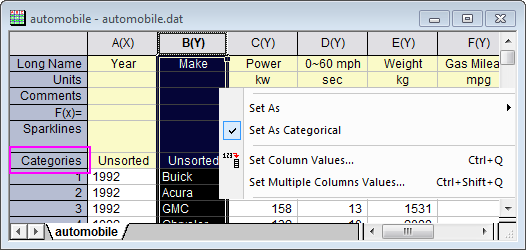
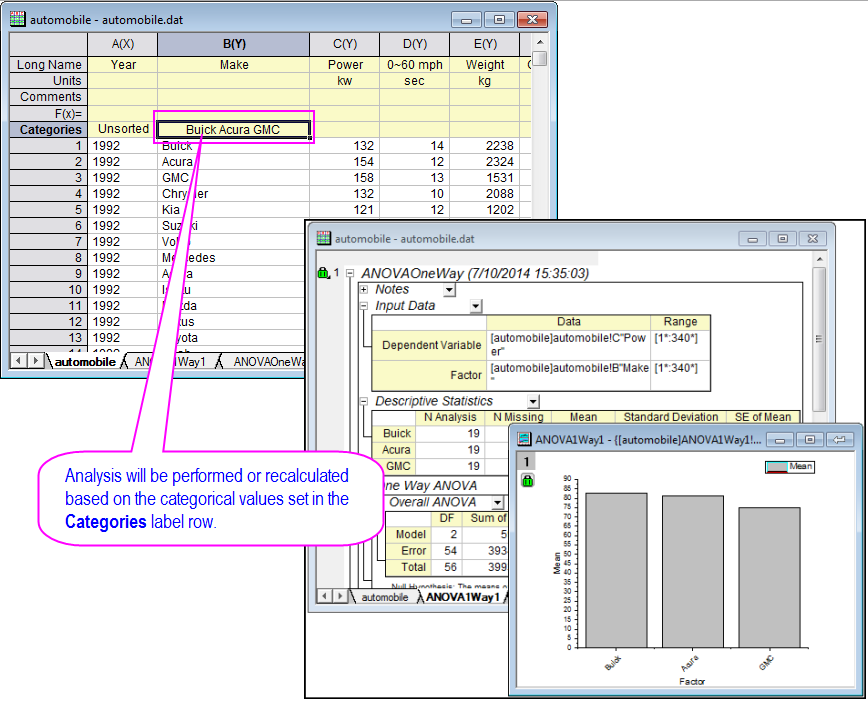
| ORG-11385, ORG-11252, ORG-10990,ORG-11157 | Controlling Categorical Values | Categories Label RowOnce you set the column to data type = Categorical, a new label row named Categories will added to the default worksheet, which can help you to control your categories in analysis/graphing.
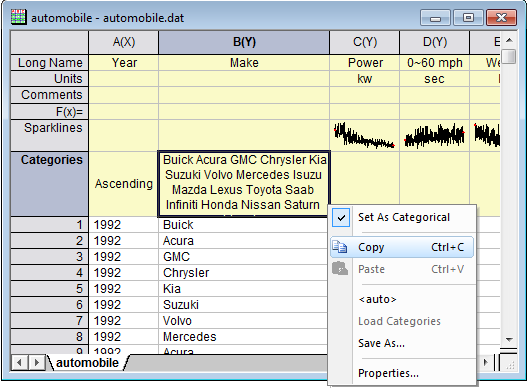
Right click the Categories cell of column, there is a related context menu to easily copy, paste, load and save the categories. Paste or load the categories in other columns to use the same categories.
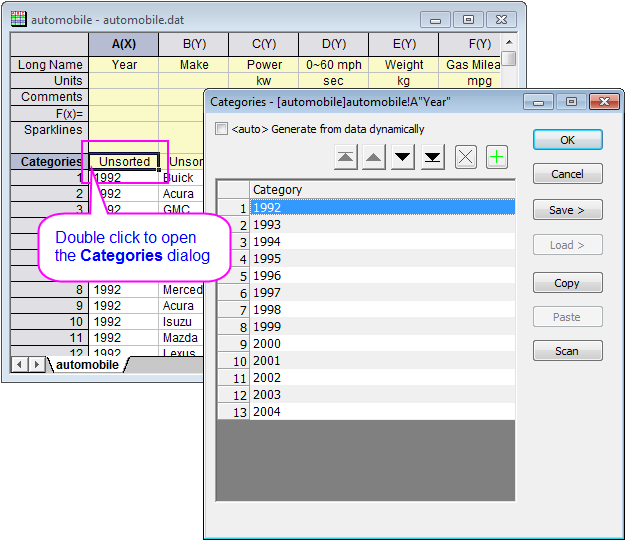
Categories DialogDouble click the Categories cell of column, the Categories dialog pops to help you (There is also a similar Categories tab in Column Properties dialog)
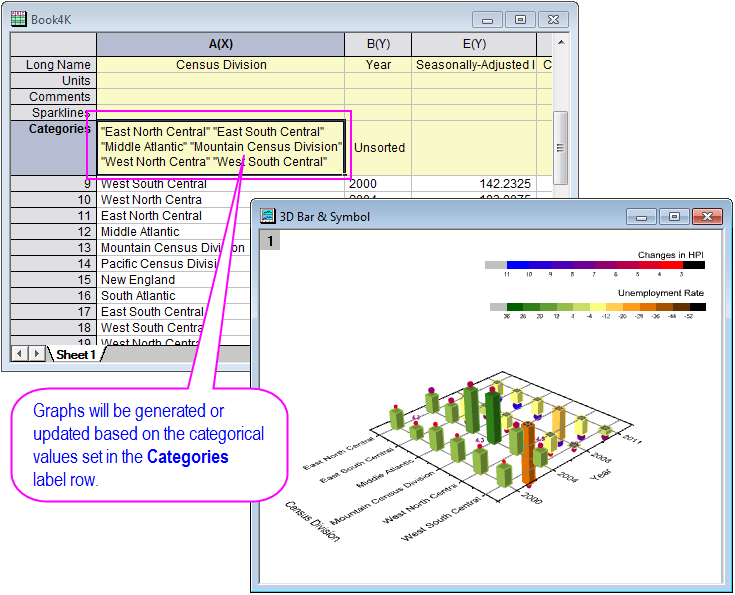
Controlling Categorical Values in Analysis and GraphingAnalysis and graphs in Origin will be generated or updated automatically according to the categorical values set in the Categories label row Note: the group columns and group box charts plot by index data could easily control the plot order within group, by setting the group column(s) as categorical, then adjust the order of categories.
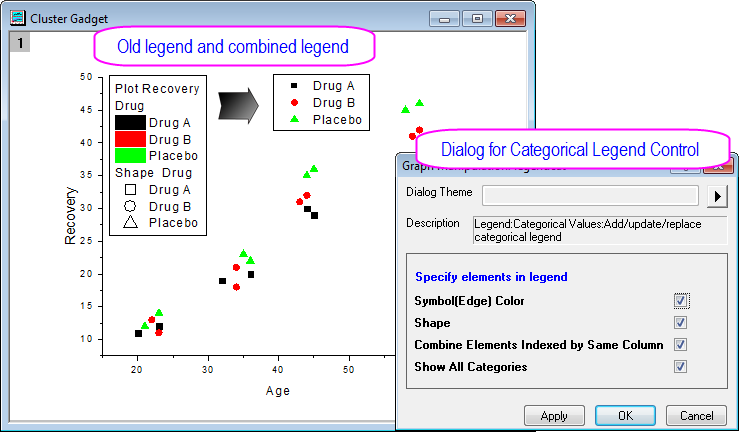
Controlling Categorical Value LegendOrigin 2015 support further control for categorical value legend. Option to Ignore Missing Values in Categorical Values columnSystem variable @cats default value is 4 in this version. It will ignore missing values in a column with is set as Categorical. |
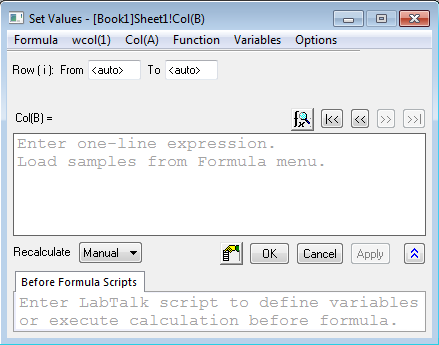
ORG-10636, ORG-11558, ORG-11434, ORG-10749, ORG-6077, ORG-11686, ORG-10733, ORG-6093, ORG-10579, ORG-8781, ORG-10393,ORG-11028,ORG-10768, ORG-10257, ORG-10663, ORG-9471, ORG-11435, ORG-11563, ORG-11276, ORG-11436 | Set Column Values Improvements in Origin 2015 | Hint on blank Formula and Before Formula Scripts boxes
Rename F(X) as F(X)= in Worksheet
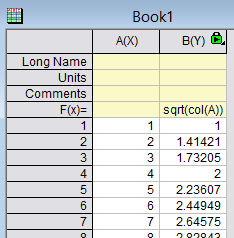
Coloring BracketsThis works in many other places that supports writing Script, such as Code Builder, Function Builder, Function Plot, Column Filter, Worksheet Query, etc.
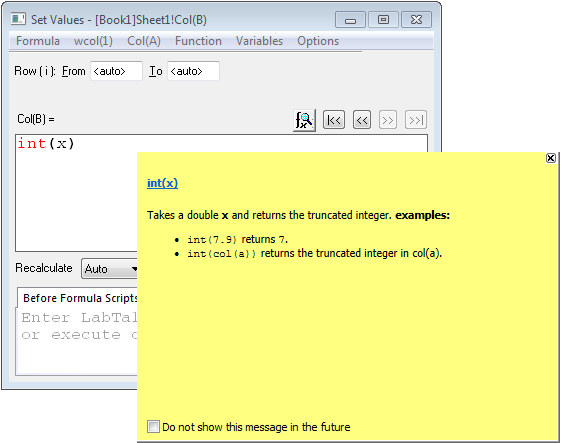
Function and syntax Help on Status bar and as Smart Hint
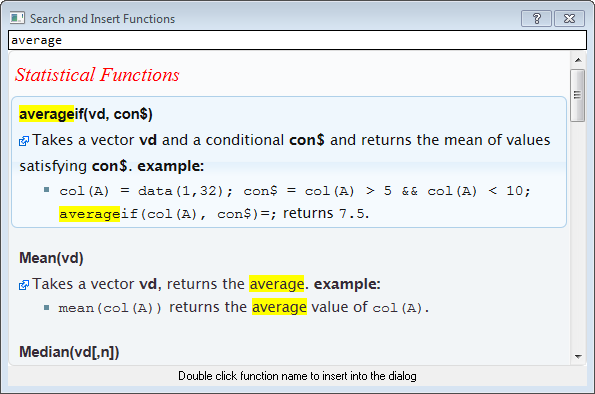
This works in other dialogs with LT function support such as Worksheet Query, Column Filter, Function Plot dialog, Plot Details Search and Insert Function
More Function Support in Set Column Value dialog
Some Menu Changes
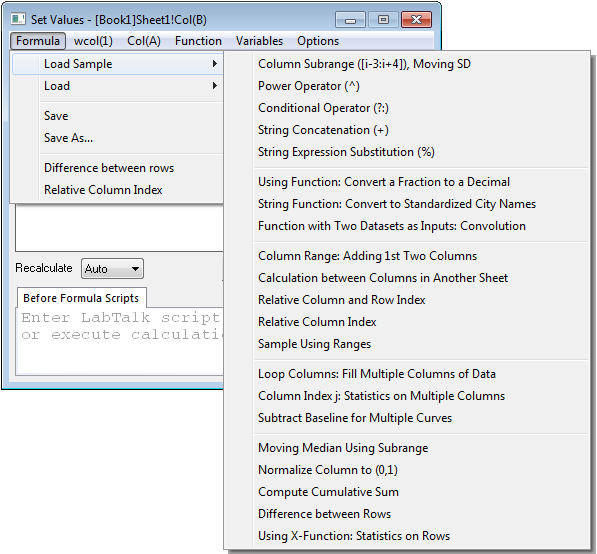
Add and reorganized examples under Formula: Load Sample menu Select the Formula: Load Sample entry to see the example of operators.
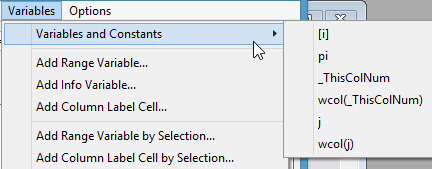
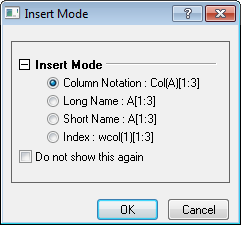
Insert Mode for inserting variables The first time when user uses "Insert Range Variable by Selection" or "Insert Column Label Cell by Selection" , and finish hunting, shows Insert Mode dialog to decide the notation.
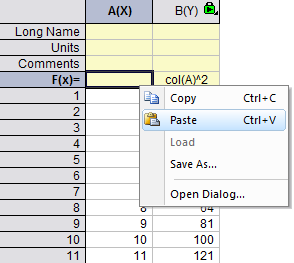
Context Menu for F(x)= label row cell
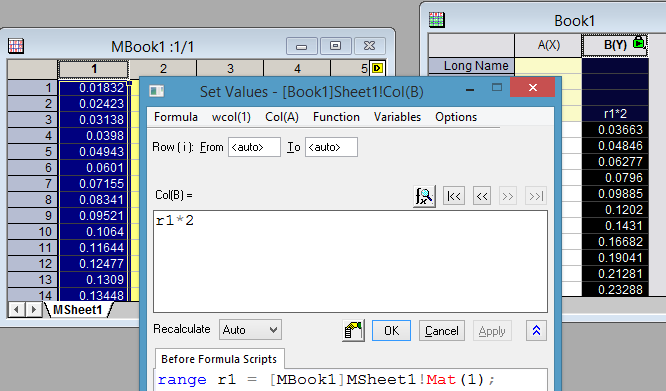
Allow Sort WorksheetIf output data is in a same worksheet as input data, "sort worksheet" will be enabled by default. Support define a range variable from matrix cell(s) in SCVSupport range selection from Matrix when using Variables: Add Range Variable by Selection in Set Column Values dialog
|
| ORG-10826 | Show more Statistics info. on status bar based on current selection and Copy Statistics | 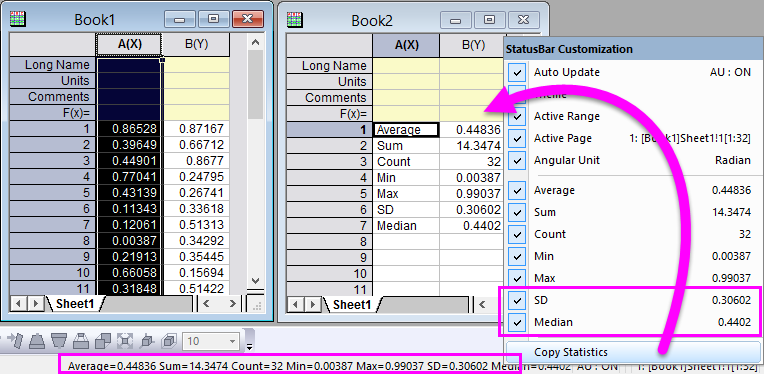 |
| ORG-12603 | Add movrms function in Set Column Values (SR2) | Moving rms vector Movrms(vector vx, int back[, int forward]) |


Importing
| JIRA | SUMMARY | DETAILS |
|---|---|---|
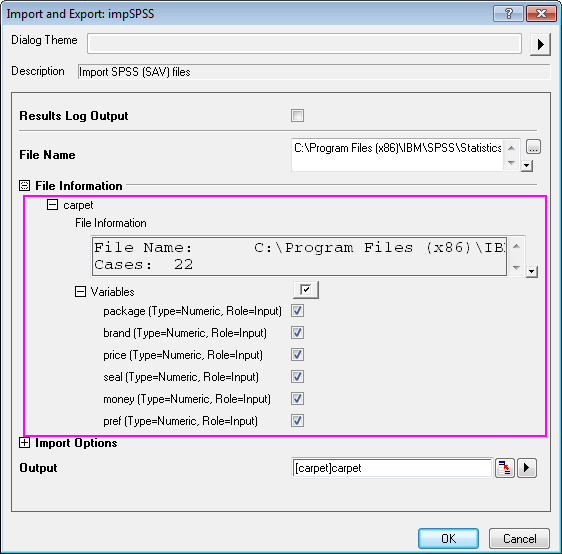
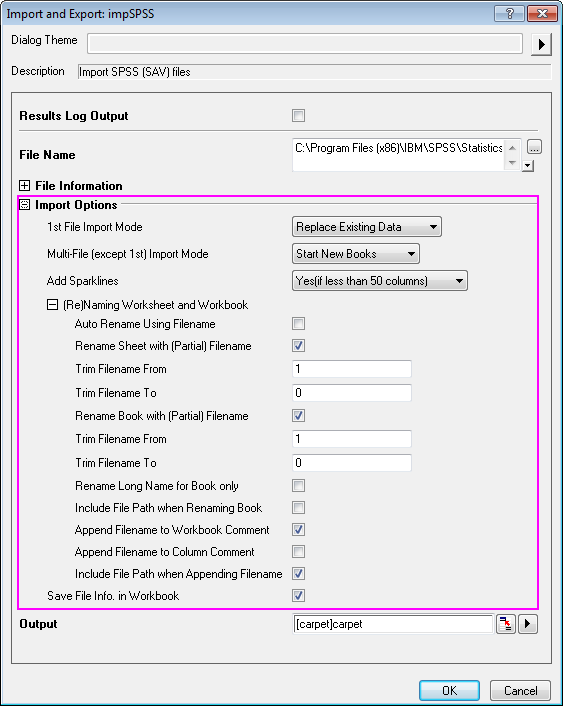
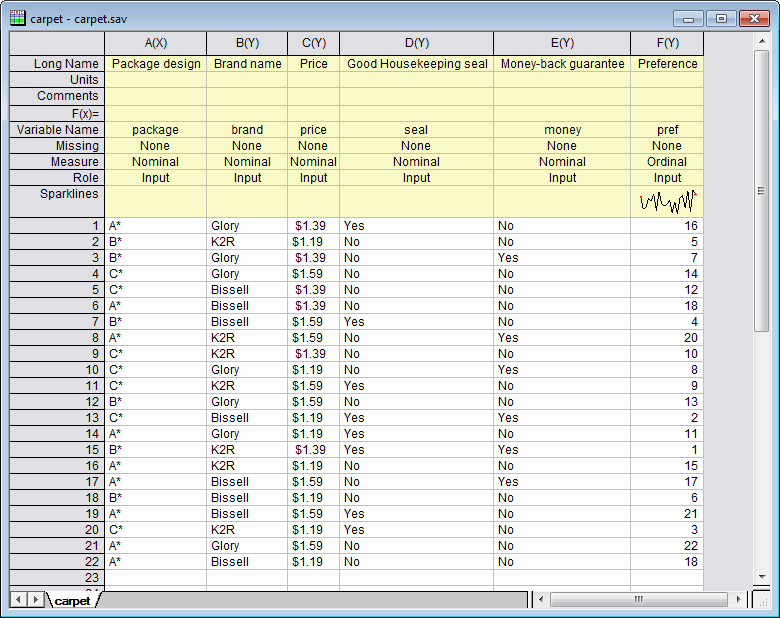
| ORG-10654 | Import SPSS Data Files | In Origin 2015, user can import SPSS data files. How to:
Via the File Information branch in the opened dialog, user can select variables to be imported Among the import options that you can control via the dialog box:
|
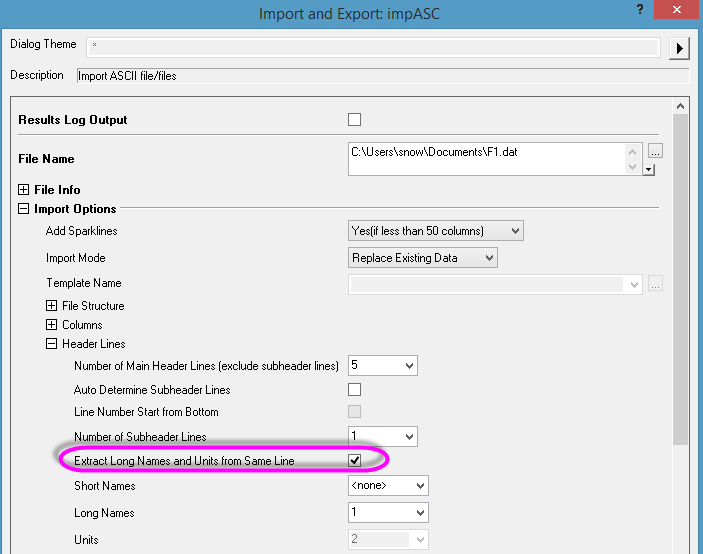
| ORG-10993, ORG-11048, ORG-10825, ORG-11042 | ASCII Importing Improvements |
|
| ORG-11222 | Matlab Import Improvements | Support Transpose in Matlab Import. |
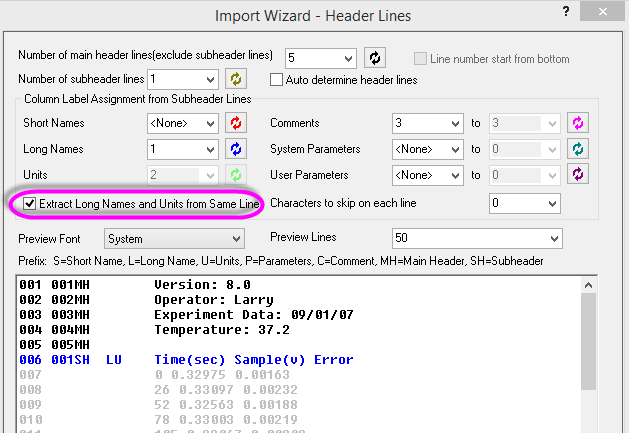
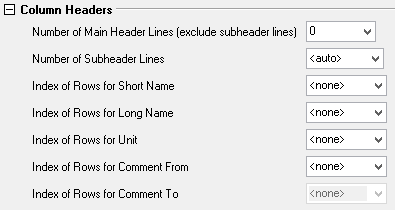
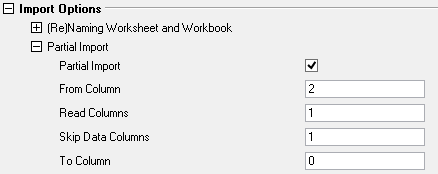
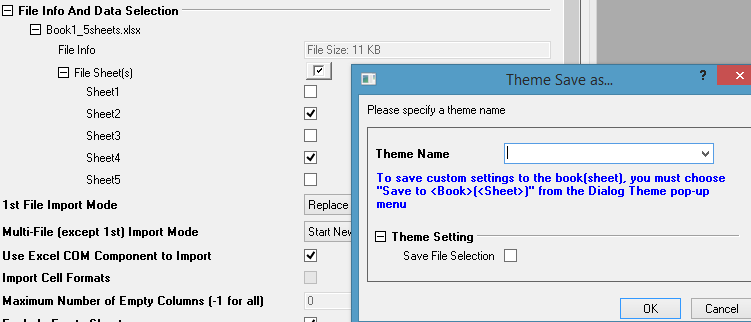
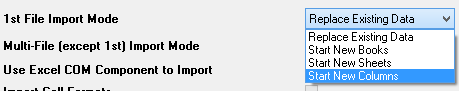
| ORG-10919, ORG-11249, ORG-10534, ORG-8826, ORG-11249 | Excel Import Improvements - Partial Import, Sheet selection in Theme file, and Reimport of Multiple Sheets |
If you have imported a multi-sheet Excel file into Origin and then the excel file is updated, you can choose File: Reimport Directly to reimport.
Choose Start New Columns in 1st File Import Mode
|
| ORG-9424 | Support pClamp 10.4 file for third-party file import (SR1) | |
| ORG-12260 | Import pClamp files abf 2.0.5 (released on NeuroScience 2014) (SR1) | After Origin 2015 SR0 release, Molecular Devices released a new device with new abf 2.0.5 file format so it's not supported in SR0. Need to patch to Origin 2015 SR1 if you would like to import it. |
| ORG-12328 | Create sheets for each variable after importing Mat file into hierarchical structure (SR1) | Introduce system variable @MVE to specify whether create sheets for each variable after importing Mat file as hierarchical structure 0 = (by default) matlab variable not expand automatically. 1 = expand the variable, and also expand all its members recursively. |
| ORG-10494 | Tool for import/export XML (SR1) | Support import and export XML file after install IOXML 1.1.opx in Origin. Need 9.0SR1 or later. |
| ORG-12574 | Certain SPE file cannot be imported since 8.5.0 (SR2) | Supports more CCD sensor types |
Project and Data Management
| JIRA | SUMMARY | DETAILS |
|---|---|---|
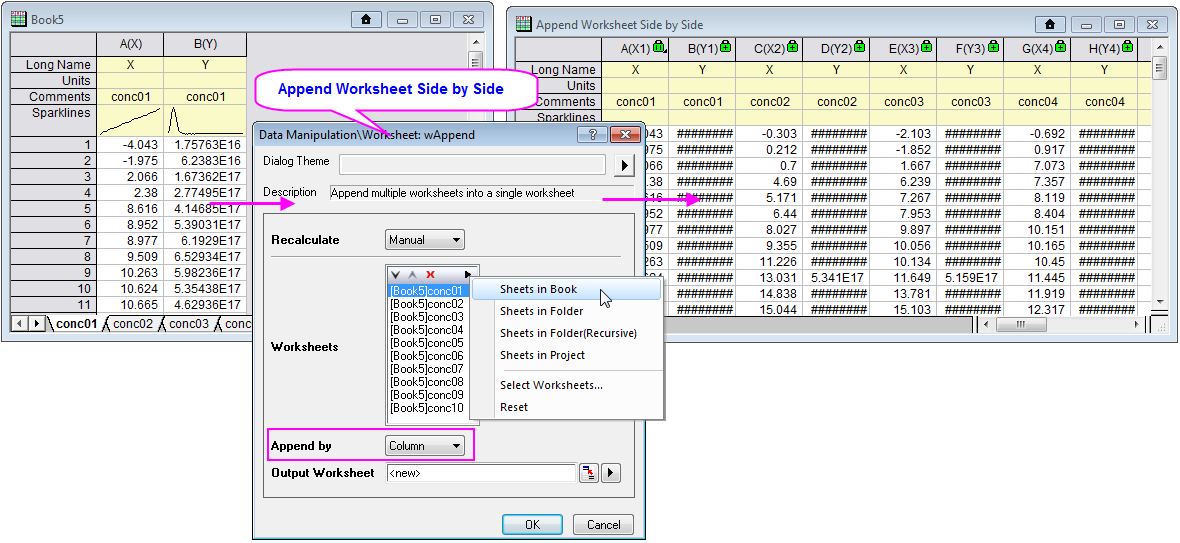
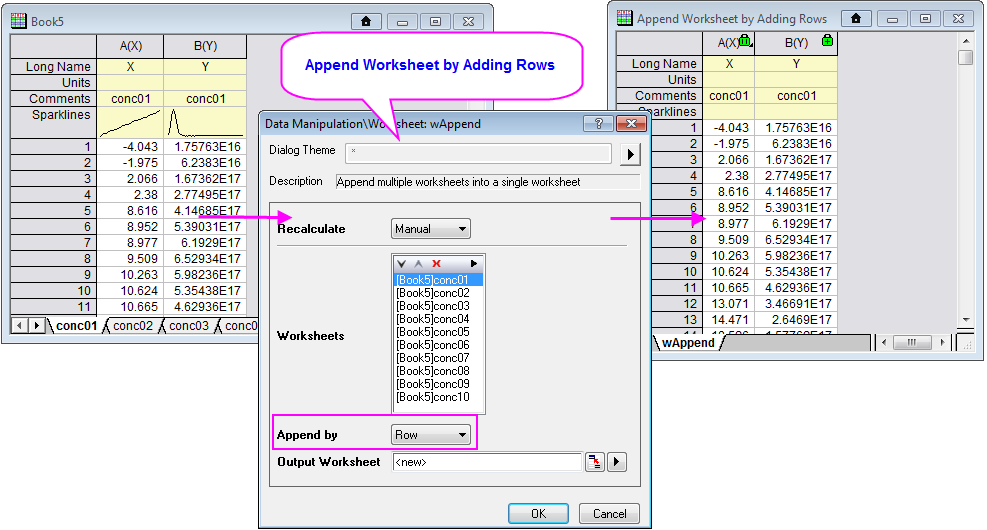
| ORG-10719, | Join Worksheet | Append WorksheetWorksheets can be joined side by side or by adding rows in Origin 2015. How to:
|
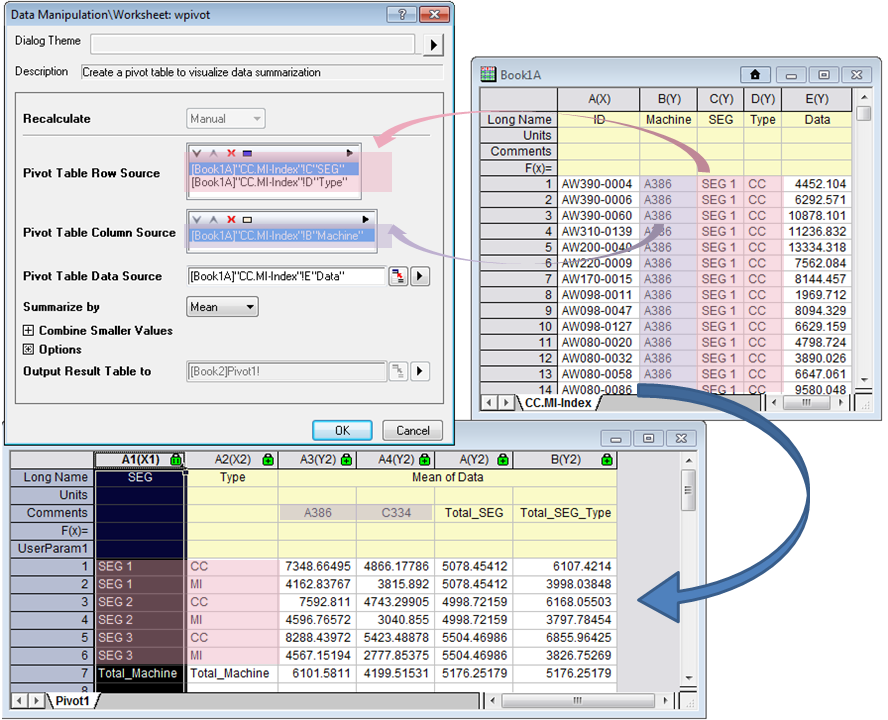
| ORG-10259 | Pivot Table with More than 1 Source for Column or Row | Origin 2015 supports multiple columns or rows in pivot table as data source. It helps user to summarize data by combination of multiple columns/rows How to:
|
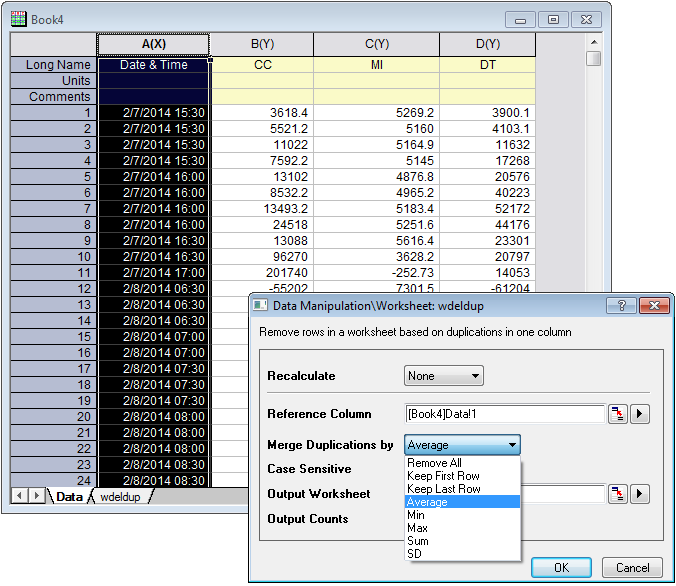
| ORG-11156 | Remove/Combine Duplicate Rows | Origin 2015 supports removing or combining duplicated rows by different options
How to:
|
| ORG-8512 | Print/Export tab added in Worksheet Properties dialog | 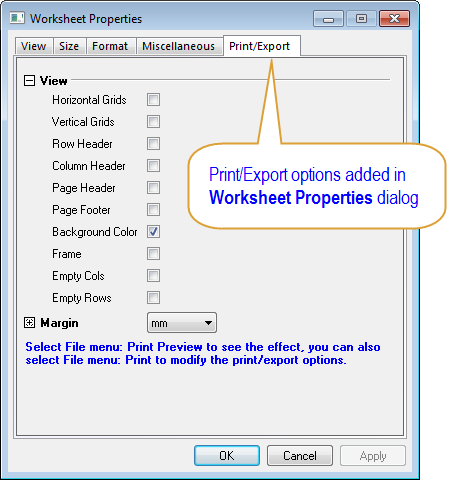 |
| ORG-10665 | Added ability to force Text & Numeric datasets to show numeric values as text elements | 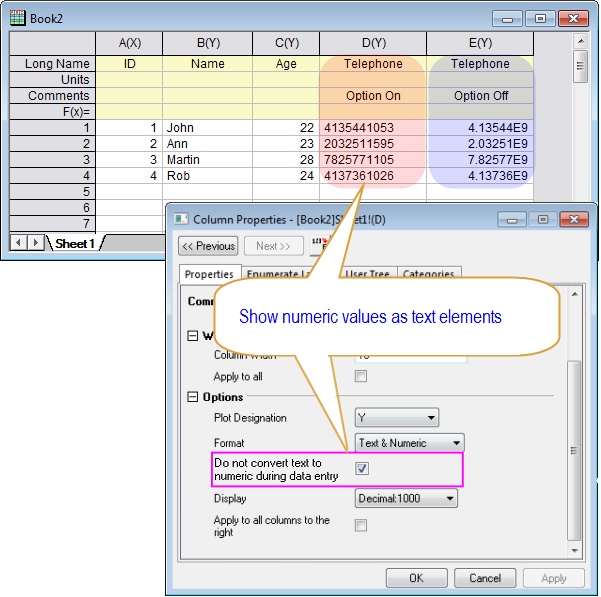 |
| ORG-11845 | Copy Column supports Copy All (Data, Formula and Labels) | 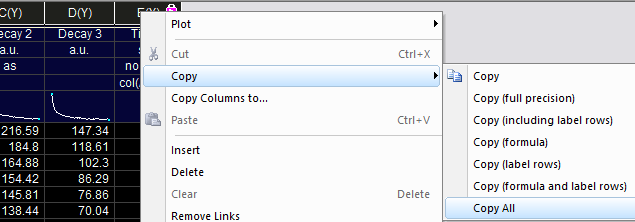 |
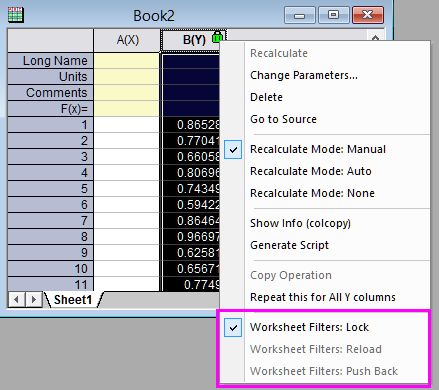
| ORG-9736 | Re-design the filter lock interface. |
 |
| ORG-11314 | Pasted Unicode Node in Worksheet Cell need to allowed copying out | Set system variable @COPU = 3, then copy the unicode texts (like Japanese or Chinese) from the cells in Origin worksheet and paste them to other application smoothly. |
| ORG-10592 | Worksheet name/comments Improvements |
|
| ORG-10203 | Add Hotkey for Update Origin for external Excel in Origin | Alt+Shift+R: Update Origin for external Excel in Origin |
| ORG-10673 | Support more quantities for reduced X and reduce Y in Reduce by Group tool | 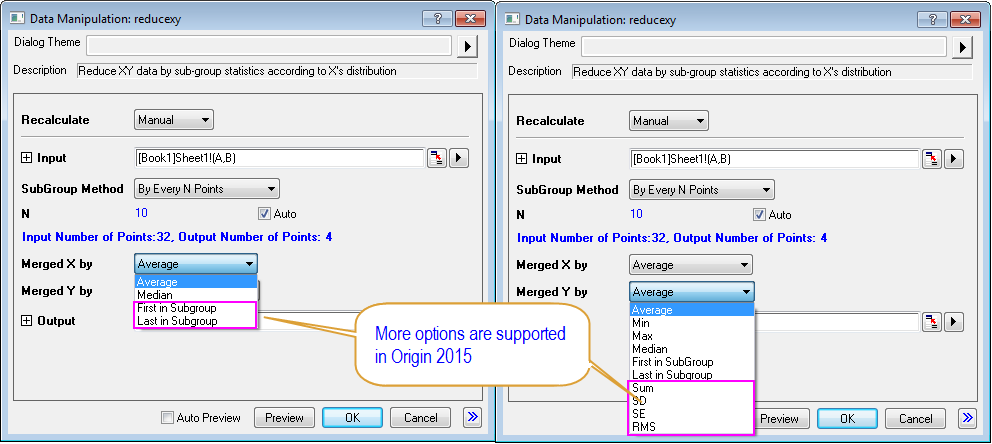 |
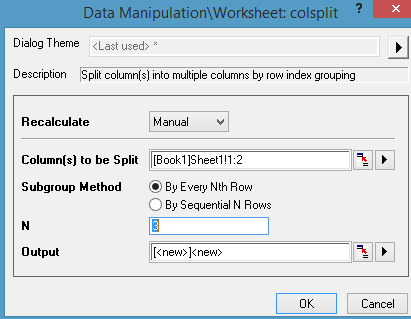
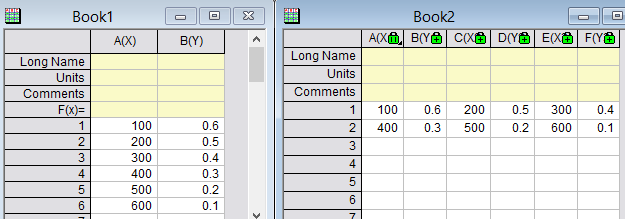
| ORG-10504 | A new x-function colsplit is added to split/unstack column(s). (SR1) | In Script window, run colsplit -d to open the dialog.
Two Subgroup Methods are provided: By every Nth row
By Sequential N Rows
|
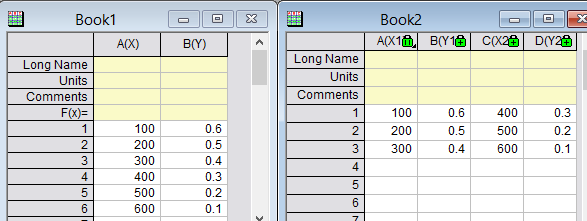
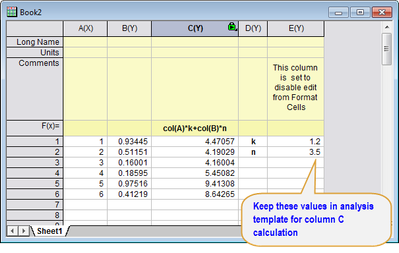
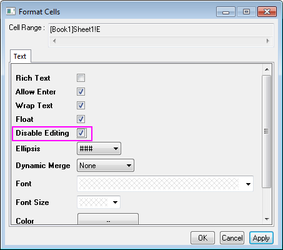
| ORG-11663 | Ability to keep uneditable parameters/values in analysis template (SR1) |
If we set the column to disable edit, values in the column will be kept in analysis templates. Example:
The saved OGW file can then be used in batch processing to process multiple datasets |
Programming and Connectivity
| ORG-11419 | X-Function: Join Worksheet by Matching Column | The x-function, wjoinbycol, enable joining worksheets by the matched column in Origin 2015. Detailed Documentation: Please refer the wjoinbycol help page How to:
wjoinbycol -d |
| ORG-11419 | X-Function:Join Worksheet by Matching Labels | The x-function, wjoinbylabel, enable joining worksheets by the matched label (worksheet headers) Detailed Documentation: Please refer the wjoinbylabel help page How to:
|
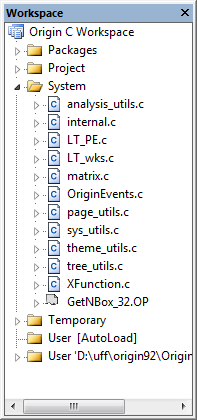
| ORG-10971 | OC: Using Code Builder to Manage OC files in OPX | A Packages folder is added in workspace in Code Builder. This folder is used to manage packages. This folder contains only folders, and each folder represents a disk folder in User Files Folder. A special folder named Common is used for holding files that are shared between all packages. Each package folder contains a subfolder named "User Files", which contains files that are in the User Files Folder.
|
| ORG-9926 | OC: Add ability to encrypt Origin C code | A new file type.ocz is introduced for easier Origin C code distribution. It is a C file but have the following differences:
|
| ORG-10840 | Python: Origin 2015 Python Support | Origin provides embedded python environment, so that you can either run python in Origin (support both command line and .py file), or use a PyOrigin module to access Origin from Python. The embedded Python in Origin could be either version 3.3.5 or version 2.7.8 and it can be switched by asystem variable @PYV. When @PYV = 3 (Default), the embedded Python is 3.3.5, while if @PYV = 2, it is 2.7.8. To set value for a system variable, click Tools:System Variables to open the Set System Variablesdialog. |
| ORG-9980 | LabTalk: LabTalk Access to Properties of Individual Radar Axis | //Assuming a radar chart is active //"Rescale Each Axis Independently" should be checked on Miscellaneous page layer.y1.to = 18; layer.y2.to = 25; |
| ORG-10891 | LabTalk: LabTalk Access to Margins of Legend | object.margin.unit |
| ORG-11688 | LabTalk: LabTalk Access to 1D&2D Kernal Density Estimation | two LT functions in SCV's category Distributions: PDF: ksdensity(x, vd, w) ks2density(x, y, vx, vy, wx, wy) |
| ORG-9984 | LabTalk: Tile Windows In a Sequence | win -s th1; /// tile horizontally first by window type then by name win -s tv2; /// tile vertically by window name |
| ORG-10506 | LabTalk: Force Recalculation on a Specific Operation | //Force the operation with UID 804 to recalculate run -p aui 804; |
| ORG-10482 | LabTalk: New Notation support to define LabTalk Literal string |
|
| ORG-10507 | LabTalk: New Macros will be called when using Draw Data tool |
Use spline for connect line in Draw Data def AfterPointProc
{
if (getpts.count >= 3)
{
set %B -l 0;
}
}
dotool 5;
|
| ORG-11066 | LabTalk: New System Variables | Size of the worksheet cell with embedded graph when auto re-size @WCSGW @WCSGH |
| OC: Origin C Workspace - User [AutoLoad] Folder | A new folder, User [AutoLoad] is introduced to Origin C Workspace in Origin 2015. Files added to the User [AutoLoad] folder is similar to the User folder, except that the files in User [AutoLoad] folder will be compiled and linked automatically upon starting Origin, and then the functions defined in the files under this folder are available, and there is no need to compile and link manually. | |
| ORG-8053 | Protection of OC/LT codes attached to OPJ | 1.To prevent user seeing the codes attached to project, use the following LabTalk code: doc -lr 16; Basically, in Code Builder, the Project folder cannot be opened if locked with the above LabTalk code . 2.When user run the following LabTalk code to unlock, user can see files have been added to Project folder in Code Builder: doc -lr 0; |
| ORG-11096 | LabTalk: Toggle Button Control | Origin 2015 support add an text box named "labtalk Variable to toggle" in the Button Settings dialog.The variable can be pass to script file. |
| ORG-8219 | LabTalk:Want Labtalk for setting substitution level for graph objects (SR1) | New property "object.link" added. |
| ORG-12401 | LabTalk: Want combined Tile and Cascade Windows arrangement (SR1) | Combined tile and cascade arrangement
Tile all windows in descending sequence
note: the above descending mode (3,4) and ascending mode(1,2) also support for window -s ch/cv/ct. |
| ORG-12150 | LabTalk: New labtalk functions for signal processing/FFT (SR1) | We added following labtalk functions for signal processing: 1. fftc vector<complex> fftc(vector<complex> cx) It calculates the complex FFT result for given cx. We should use different algorithms depending on whether cx is real. 2. fftmag vector fftmag(vector<complex> cx, int side=1 ) It can be used to calculate magnitude from FFT complex result. side=1 for one-sided by default, side=2 for two-sided and shift. 3. fftamp vector fftamp(vector<complex> cx, int side=1 ) It can be used to calculate amplitude from FFT complex result. side=1 for one-sided by default, side=2 for two-sided and shift. 4. fftphase vector fftphase(vector<complex> cx, int side=1, int unwrap=1, int unit=1 ) It can be used to calculate amplitude from FFT complex result. 5. ifftshift vector<complex> ifftshift(vector<complex> cx) When fft result is shifted, to do ifft, we need unshift the result first. 6. invfft vector<complex> invfft(vector<complex> cx) Compute inverse FFT from fft result. If input size is n, output size is n. 7. fftfreq vector fftfreq(double time, int n, int side=1, int shift=1) Calculate frequencies for FFT results, the original result is time*data(0,n-1) 8. fftshift vector<complex> fftshift(vector<complex> cx) It can be used to shift FFT results or frequency. 9. windata vector windata(int type, int n) type=0 rectangle, 1: Welch, 2: Triangular, 3: Bartlett, 4: Hanning, 5: Hamming, 6: Blackman |
| ORG-12392 | Share UIM Tool to Origin regular (SR1) | This used to be an OriginPro feature. Make it available in Origin regular now. |
| ORG-12546 | LabTalk:Column Label Row Characters Improvement (SR2) | Character O1 is reversed for Categories label row instead of K. For more details, see this page. |
Other
JIRA | SUMMARY | DETAILS |
|---|---|---|
| ORG-10692, ORG-11418 | Disconnect Graph Page from active Printer | The check box Set to printer dimension when creating graphs from this template (Plot Details Print/Dimensions tab, page level) has been removed. It has been replaced by a new page property page.UpdateToPrinter that will has 3 values:
Once the graph is created, everything will work as it did before. If you print and the resolution of the printer is not equal to template, you will see the message asking you to update to printer resolution. The new feature: allow default graph page size to be country dependent. Graph page's Width*height: 6400 pixel(10.67 inch)*4800 pixel(8 inch) for US/CANADA/MEXICO . Fit page to printer will change the page size as above value by different locations in Window system (Control Panel\Clock, Language, and Region). |
| Origin 2015 32-bit vs 64-bit | Origin 2015 offers both 32-bit and 64-bit versions. For the Import/ Export file types, there are some differences in two versions. 32-Bit The following Import/Export file types are supported in 32-bit Origin. 64-Bit Some Import/Export formats are not supported in 64-bit Origin due to non-availability of third-party plug-ins/DLLs. These file types are NOT supported for import/export in 64-bit:
| |
| ORG-10714 | Origin Viewer: Support rotate 3D graphs separated out windows. (SR1) | Support the click to rotate in the additional graph windows. |