Origin 2015 SR1 Bug Fixes
Graphing
| JIRA | Summary | Details | Source |
|---|---|---|---|
| ORG-12180 | Heatmap: If deleting some column label rows in the source worksheet, graph disappeared | Plot a heatmap from worksheet data with X or Y in column label row and used Date/Time format Go back to worksheet and delete some column label row e.g. an empty F(x) row ==> Graph became blank. | Inhouse |
| ORG-12182 | Graph theme with page level properties saved in older version failed to apply in Origin 2015 | The problem only exists for theme files saved since Origin 91sr1 | Beta Tester |
| ORG-12202 | Plot Type is Text when adding new plots in Layer Contents dialog | Plot a line graph ad then open Layer Contents dialog. Add more plot to layer. ==> Plot Type of newly added plot is Text Found in Origin 2015 SR0 and Origin 8.6 | Beta Tester |
| ORG-12074 | Failure to Pan plots made from Virtual Matrix with Date/Time kind of X or Y values. | When plotting graph with Virtual Matrix with Date/Time kind of X or Y data, the corresponding axis's major ticks will be set to By Dataset with VM1.sub(x) Origin's Zoom and Panning tool supports zoom/pan by percentage or by major/minor tick values. | Inhouse |
| ORG-12156 | issue on Annotation tool for Certain Graph Types like contour/ bubble | http://beta.originlab.com/forum/topic.asp?TOPIC_ID=4252 1. annotation text's position is wrong on bubble plot. 2. Annotation text is rotated and no connection line show on contour plot | Beta Tester |
| ORG-12114 | Paste Format context menu issues in coordinates for special plot and 3d plot | The option in context menu of paste format should be consistent with axis dialog.ORG-12233 | Inhouse |
| ORG-12233 | Crash when define gobject for 3d object in OpenGL graph | Run script "gobject abc=zf; //zf is object name of the left z axis title". ==> Origin crashed. The crash happens since 92sr0, not in previous versions. Although we do not fully support LT access to 3d text object yet, we should at least make it work as 91 and no crash. | Inhouse |
| ORG-12187 | New Graph page leads to crash in Crossover on Mac in Origin 2015 SR0 | Origin 2015 SR1 fixed new plotting graph crash bug in Crossover/Wine(Virtual Machine Software) on Mac/Linux OS | Customer |
| ORG-12391 | Color scale bar created in former version displayed incorrectly in 2015 SR0 | Open old opjs with color scale bar, ticks will not be turned on automatically. | Customer |
| ORG-12405 | Heatmap speed issue | The graphing speed has been improved for heatmap with large size matrix. | Customer |
| ORG-12470 | Multi-column legend box because huge when reopen the opj | Plot a graph with multiple data Ctrl+drag legend handles to arrange legend into multiple columns. (new feature in Origin 215) Save the opj and then reopen the opj. ==> Legend box becomes bigger. Everytime you save and reopen, it will become bigger and bigger. The problem only exists in opj made in Origin 2015 sr0. No problem in opj made in Origin 2015. For problematic opj, you can fix the legend first and save again in Origin 2015 SR1. | Inhouse |
Axis
| JIRA | Summary | Details | Source |
|---|---|---|---|
| ORG-12203 | Ticks to Label drop-down list was empty for 2D Waterfall graph's Custom Tick Labels tab of Axis dialog | Inhouse | |
| Axis Scale failed to update if there are 3 levels of linking | http://beta.originlab.com/forum/topic.asp?TOPIC_ID=4247 If there are multi-levels of linking, sometimes graph parent layer failed to update with grandchild. | Beta Tester | |
| ORG-12020 | Axis failed to rescale automatically for Grouped plot | If new group are added in source worksheet, graph failed to rescale automatically to include them | Inhouse |
| ORG-12439 | Bigger default Maximum Number of Ticks | Default maximum number of ticks has been re-set to 400. | Inhouse |
Import
| JIRA | Summary | Details | Source |
|---|---|---|---|
| ORG-12295 | ImpNIDIAdem Failed on User's File | Can't import NIDIAdem file that created with software from National Instruments (Dasylab). | Customer |
Worksheet
| JIRA | Summary | Details | Source |
|---|---|---|---|
| ORG-12247 | Data filter failed to work if graph and worksheet are not in the same folder or worksheet is hidden. | Add filter in a column and plot the data. Plot a graph. Move graph window to a different folder. Rescale the graph. ==> All data show. | Customer |
| ORG-12255 | Incorrect Page Break Preview Line when page orientation is Portrait | Some wrong page break calculation since 9.2 sr0. | Inhouse |
| ORG-12102 | For large data, it was very slow to open Reduce Rows dialog. | Inhouse | |
| ORG-12488 | Crash when click New window buttons when cursor is in edit mode of F(X) cell | Steps to reproduce the crash:
| Customer |
| ORG-12379 | Recalculation can now detect object variable and UIM change | If your operations such as Set Column Values use LabTalk variable or UIM object like Status as input, changing their values will now be able to trigger the recalcualtion. | Inhouse |
Analysis
Fitting
| JIRA | Summary | Details | Source |
|---|---|---|---|
| ORG-10150 | Fitted Curve's X data problems | If source graph scale type is not linear
When changing parameters, the X Data Type always reset to default "Use Source Graph Scale Type". Existed since 8.0 SR6 Failed to set output X data type as Log if source graph scale type is Linear. Wrong X data for fitted curve if choose Log but source graph scale type is neither Log10 nor Linear. | Inhouse |
Statistics
| JIRA | Summary | Details | Source |
|---|---|---|---|
| ORG-12158 | Pearson's r value failed to show on scatter matrix graph in origin regular version | The problem existed since 9.1 sr0 when that option is added into the tool. | Inhouse |
| ORG-12249 | Incorrect sorting result for Discrete Frequency | The problem existed since 9.2 sr0 when that option is added into the tool. | Inhouse |
| ORG-12164 | Result of Distribution Fit is different from the distribution estimation in Histogram | The problem existed since 9.2 sr0 when Distribution Fit is added into Origin. | Inhouse |
| ORG-8582 | Distance Matrix branch in report sheet of HCA becomes empty if recalculating from graph window | The problem existed since 8.6 sr0. | Inhouse |
Mathematics
| JIRA | Summary | Details | Source |
|---|---|---|---|
| ORG-12191 | XYZ Surface Area result was wrong if some z data are 0 | Broken in Origin 2015 sr0 | Inhouse |
Signal Processing
| JIRA | Summary | Details | Source |
|---|---|---|---|
| ORG-12271 | FFT gadget bugs in Origin 2015 SR0 |
| Inhouse |
| ORG-12079 | Slowness when doing STFT with large data |
| Inhouse |
Interface
| JIRA | Summary | Details | Source |
|---|---|---|---|
| ORG-1252 ORG-3189 | Bad layout of dialog with big DPI | If DPI is bigger than 100%, sometimes some dialogs e.g. Nonlinear Curve Fit, Set Column Values, etc. may have bad layout. Improved now. | Customer |
| ORG-10700 | Bug fixes for Retina Display support | More fixes for issues running Origin on Retina Display device. | Inhouse |
| ORG-12184 | Origin crashed or messed up after reinitializing if having dock window | Have some windows docked together, e.g. Results Log, Command Window, etc. Reinitialize layouts of Origin workspace. ==> Origin crashed | Inhouse |
| ORG-5145 | Origin workspace toolbars show in Code Builder |
| Beta Tester |
| ORG-12262 | command window failed to show after restarting origin | make command window show(no matter dock or floating), restart origin, ==>command fail to show | Customer |
| ORG-5454 | Fail to keep large size buttons after opening code builder | http://beta.originlab.com/forum/topic.asp?TOPIC_ID=4230 check Use Large Button in options tab of customize dialog. open code builder then close it. ==>toolbar buttons become normal size. we hide the Options tab of customize dialog in code builder in 2015SR1. | Beta Tester |
| ORG-11402 | Reorder Docked Windows with Auto hidden checked or Keep Fixed Order | http://beta.originlab.com/forum/topic.asp?whichpage=1&TOPIC_ID=4118 Origin2015SR1 will fix tab order for all of our dockable windows, the order as following:
| Beta Tester |
Programming
| JIRA | Summary | Details | Source |
|---|---|---|---|
| ORG-12181 | LabTalk: getfile saves path info into %A and %B incorrectly if file is NOT placed in first driver |
getfile *.*;
==> get this: The problem started in Origin 2015 SR1 and only happens if file isn't place in first drive of your PC | Customer |
| ORG-12174 | Failed to pass arguments into user-defined button |
[testsection]
switch (%1)
{
	case 1:
		type -a "Case 1";
		break;
	case 2:
		type -a "Case 2";
		break;
	default:
		type -a "Default";
		break;
}
| Beta Tester |
| ORG-12115 | Status for Clear All Breakpoints toolbar is not updated after it is executed | http://beta.originlab.com/forum/topic.asp?TOPIC_ID=4254 Clear All Breakpoints button is still enable after clear all breakpoints | Beta Tester |
| ORG-12197 | Origin crash after print preview in code builder | select file:print preview in code builder with any file active. ==>origin crash | Inhouse |
| ORG-12487 | layer.axis.postype and layer.y.position no longer work in 9.2 | In a graph window, run the following script in Origin 2015 SR0. Nothing happens. Fixed in sr1. layer.y.postype=1; //specify y axis position by percentage layer.y.position=-50 //specify the y axis position to be 50 percent from the left (middle of x axis)
| Distributor |
| ORG-12490 | Failed to set custom scale after break via Labtalk script layer.x.break1.inc layer.x.break2.tickstype layer.x.break2.ticksbydata$ | E.g. The following script fails to set ticks after 1st break to be by increment 0.5, fails to set ticks after 2nd break by dataset, and set ticks to be at 6.7, 7.1, 7.9 8.5 9.6. win -t plot; //Enable two axis breaks in x axis layer.x.breaks.enable = 1; layer.x.breaks.count = 2; //Customize the first axis break //Set the break to be from 2 to 4 layer.x.break1.from = 2; layer.x.break1.to = 4; //Change the axis break position to be at 40% layer.x.break1.pos = 40; //Change the increment after the first axis break to be 0.5 layer.x.break1.inc = 0.5; //Customize the second axis break //Set the break's from and to values to be from 6 to 6.5 layer.x.break2.from = 6; layer.x.break2.to = 6.5; //Change the major tick type to be "By Dataset" after the second break layer.x.break2.tickstype = 3; //Define a dataset and use it as major tick location after break layer.x.break2.ticksbydata$ = 6.7 7.1 7.9 8.5 9.6; | Inhouse |
Miscellaneous
| JIRA | Summary | Details | Source |
|---|---|---|---|
| ORG-12175 | Open OPJ saved with German interface in English interface | After opening the opj and clicking Change Parameters to open some analysis dialog and change some settings, ==> Nothing happened or sometimes some nodes in result became empty. | Inhouse |
| ORG-12388 | Origin fail to connect to mathematica V10.0 | Origin fail to connect Mathmetica 10 if no other Mathematica version was installed before | Customer |
Installation and Licensing
| JIRA | Summary | Details | Source |
|---|---|---|---|
| ORG-12344 | Origin 2015 failed to start due to R6030 CRT not initialized error. Fixed in sr1. | 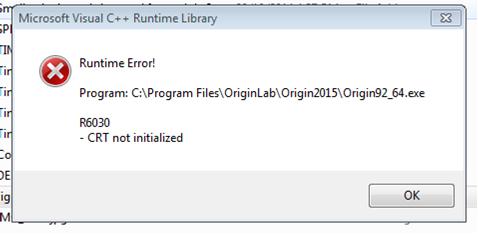 | Customer |
| ORG-12330 | Open Registry Failure when starting Origin. | This happens:
| Customer |
| ORG-12386 | 2015 dongle (key) stopped working after using it for a while | The dongle may become corrupt if 2 Origins try to access it at the same time. | Customer |