A2 - Controlling Categorical Values
Sample OPJ to download to try: A2 Folder of 92DemoOthers.opj
Categories Label Row
Once you set the column to data type = Categorical, a new label row named Categories will added to the default worksheet, which can help you to control your categories in analysis/graphing.
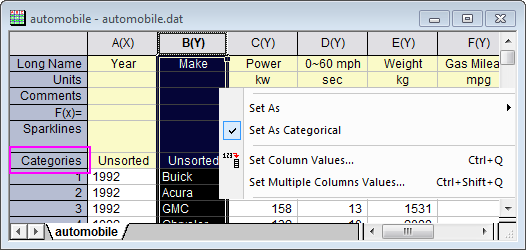
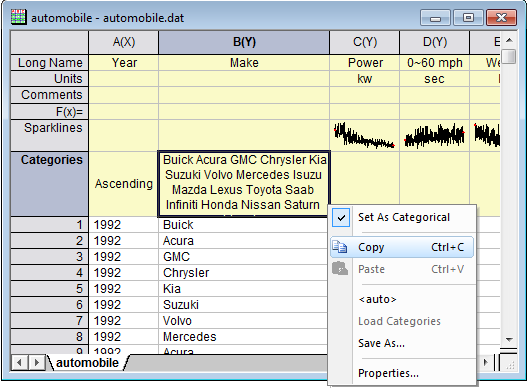
Right click the Categories cell of column, there is a related context menu to easily copy, paste, load and save the categories. Paste or load the categories in other columns to use the same categories.
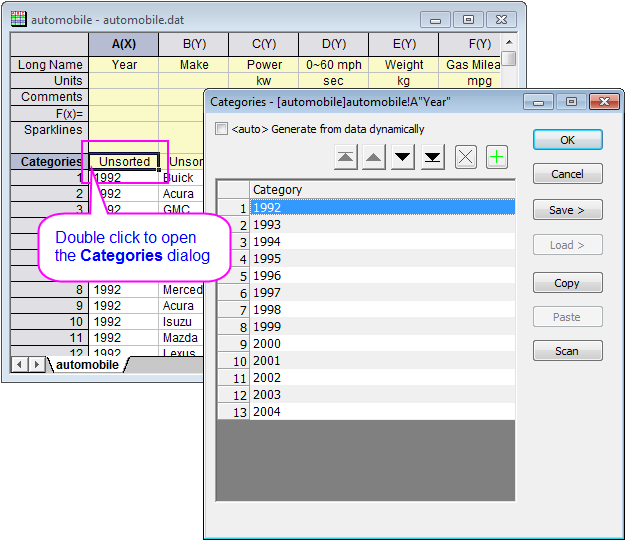
Categories Dialog
Double click the Categories cell of column, the Categories dialog pops to help you (There is also a similar Categories tab in Column Properties dialog)
- Manually order your categorical values
- Add or remove categorical values
- Save and load to share categorical values between columns
- San to find more categories from Data
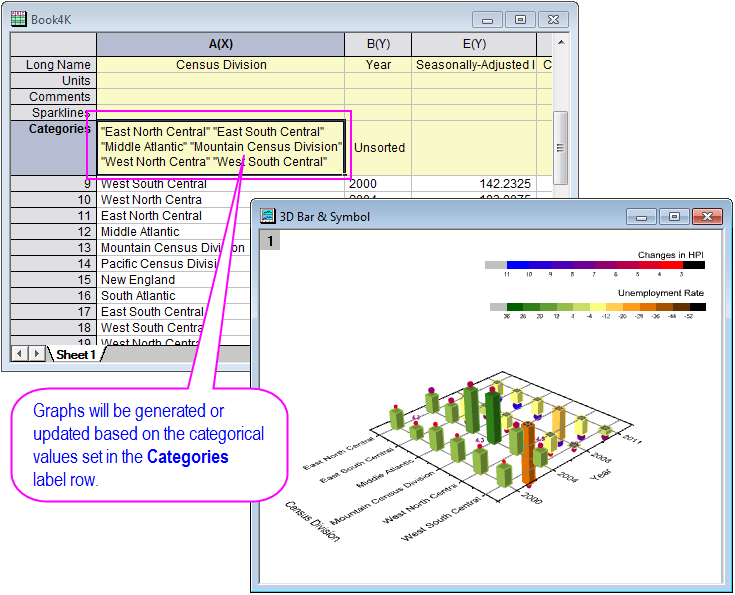
Controlling Categorical Values in Analysis and Graphing
Analysis and graphs in Origin will be generated or updated automatically according to the categorical values set in the Categories label row
Note: the group columns and group box charts plot by index data could easily control the plot order within group, by setting the group column(s) as categorical, then adjust the order of categories.
| Graphs auto updated by Categories Label Row | Analysis auto updated by Categories Label Row |
|---|---|
 | 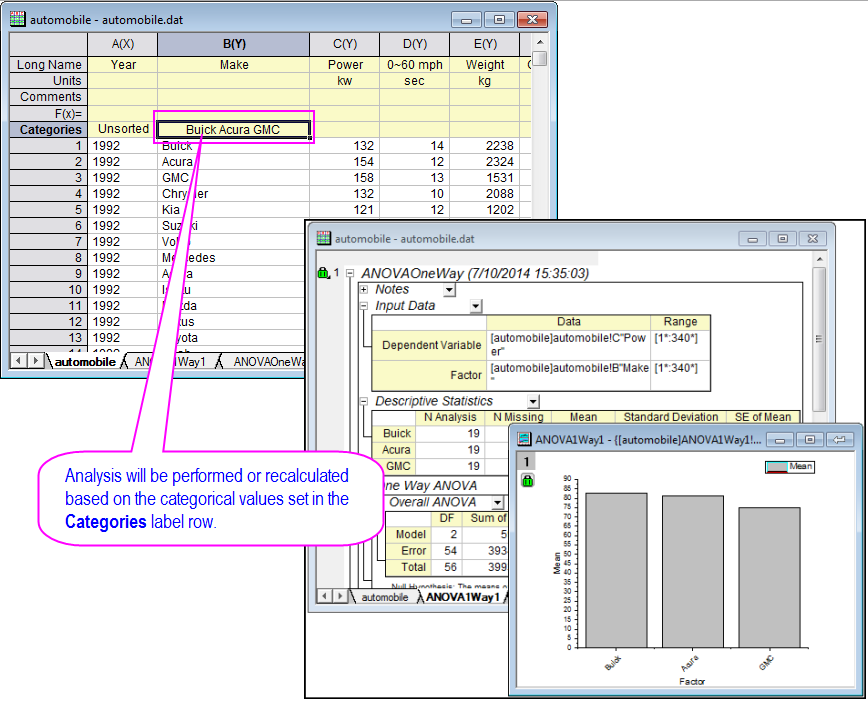 |
How to
- Select the column.
- Right-click on the selected column and choose Set as Categorical from the shortcut menu, a new label row named Categories will added to the worksheet
- Click on the Categories cell of the column to open dialog
- Custom categorical values in the Categories dialog
- Run analysis or generate graph with data including the category column
- Go back to the worksheet with source data
- Update the Categories cell, graph or analysis will also be updated.
Controlling Categorical Value Legend
Origin 2015 support further control for categorical value legend.
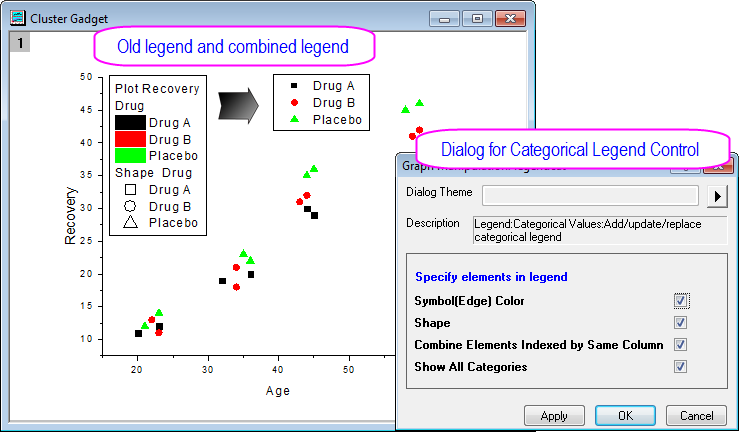
How to:
If categorical data is present in a plot
- Select menu Graph: Legend: Categorical Values...
or - Right click on the legend and choose Legend: Categorical Values... from the short cut menu
Option to Ignore Missing Values in Categorical Values column
System variable @cats default value is 4 in this version. It will ignore missing values in a column with is set as Categorical.