...
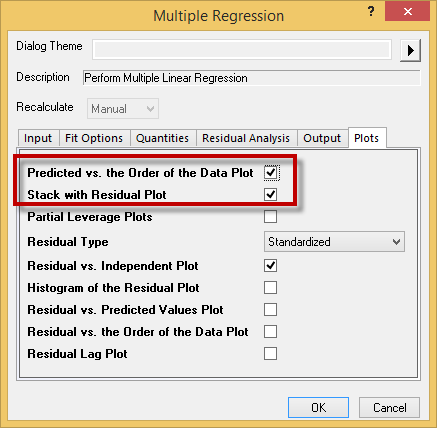
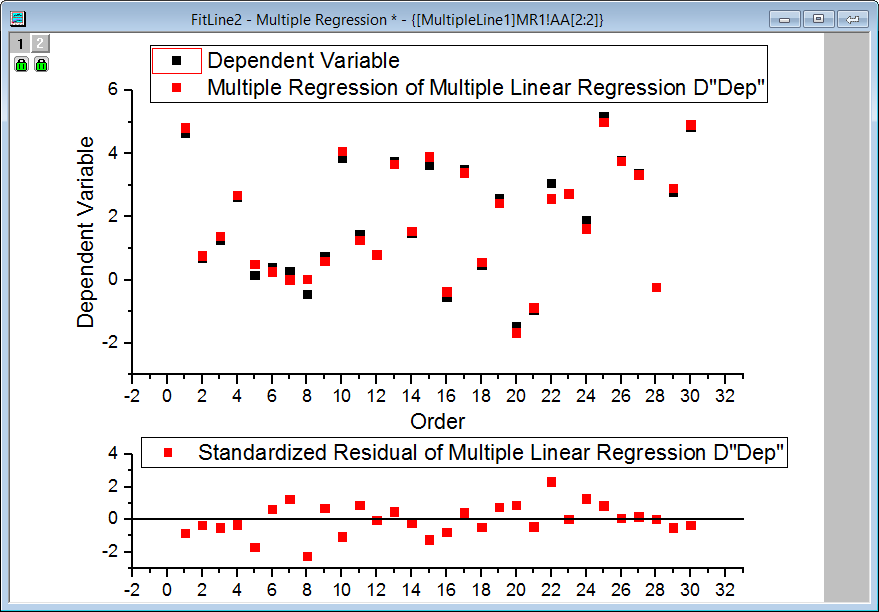
Add two checkboxes Predicted vs. the Order of the Data Plot and Stack with Residual Plot (both default unchecked) in the Plots tab in Multiple Regression dialog. This will generate extra two plots in the result that shows the dependent variable/predicted variable vs row number and residual vs row number.