Origin 2016 Features
Origin 2016 Highlights
The table below only lists some highlights of Origin 2016. To see more features in 2016, please use the navigation bar on the left panel of this page.
Origin Interface
JIRA | SUMMARY | DETAILS |
|---|---|---|
Enable/Disable Collapsible Menus from Tools:Options | User can disable/enable collapsible menus by check box in Miscellaneous tab of Tools:Options. | |
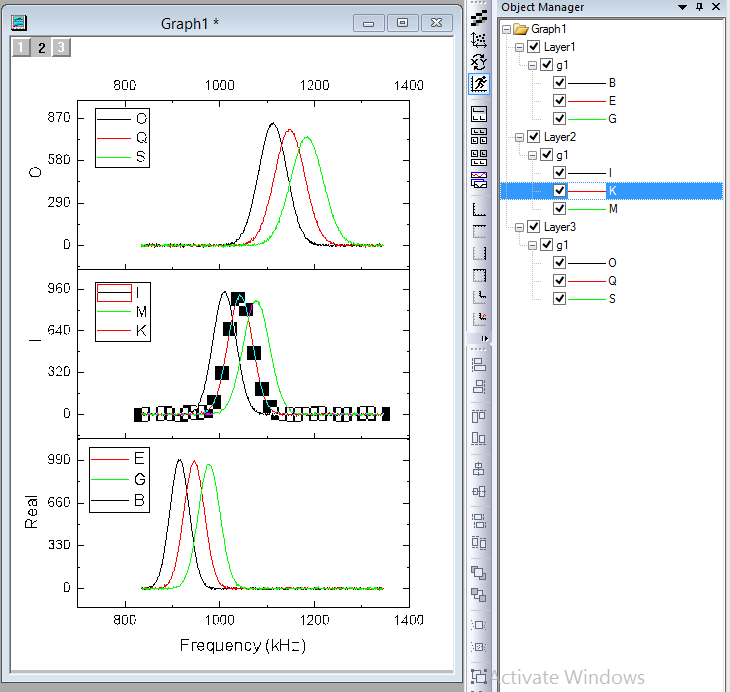
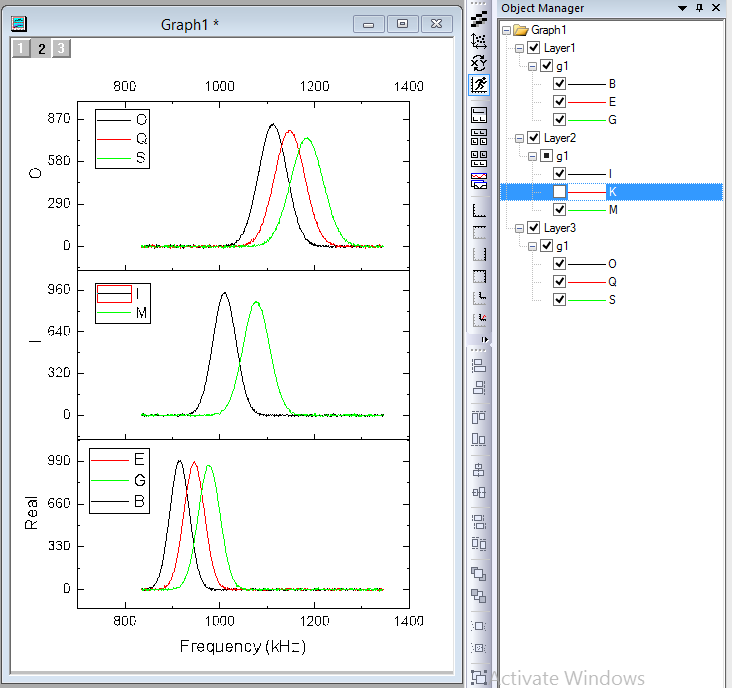
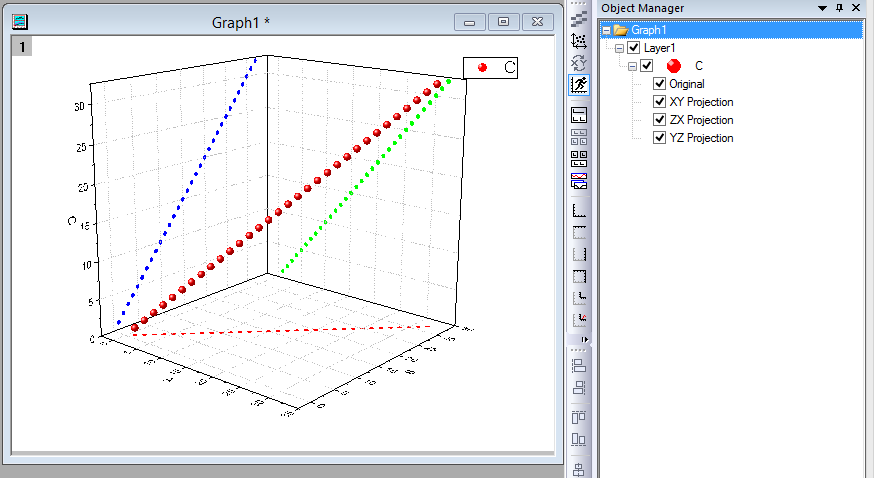
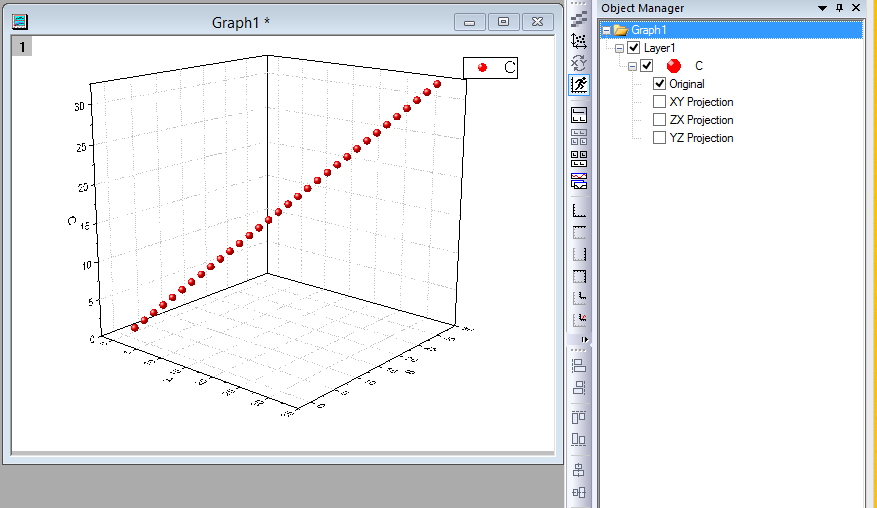
| Dockable Object Manager to easily Show or Hide Plots on a Graph | Hide and show plots using Object Manager
Useful context menu tools inside Object Manager
For 3D Scatter plots, XY Projection, ZX Projection, YZ Projection items are included in object manager as well.
|
GUI to Rename Plots with Loose Data (2D function plot & virtual matrix) | Set the short name of the 2D function plot Under the label tab of the Create 2D Function Plot dialog, we can set the Function short name.
Short name or long name of the loose data can be changed in plot detail dialog Open the plot detail dialog of a 2D function plot or virtual matrix plot, we can change the short name or long name of the plot. Clicking the small button besides the name will toggle between long name and short name. | |
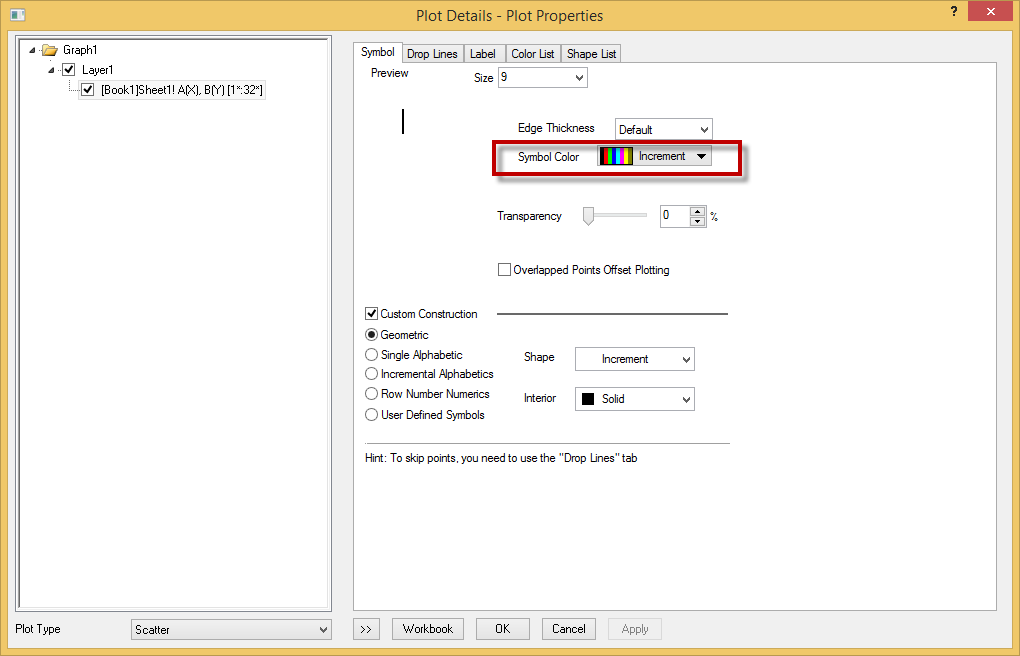
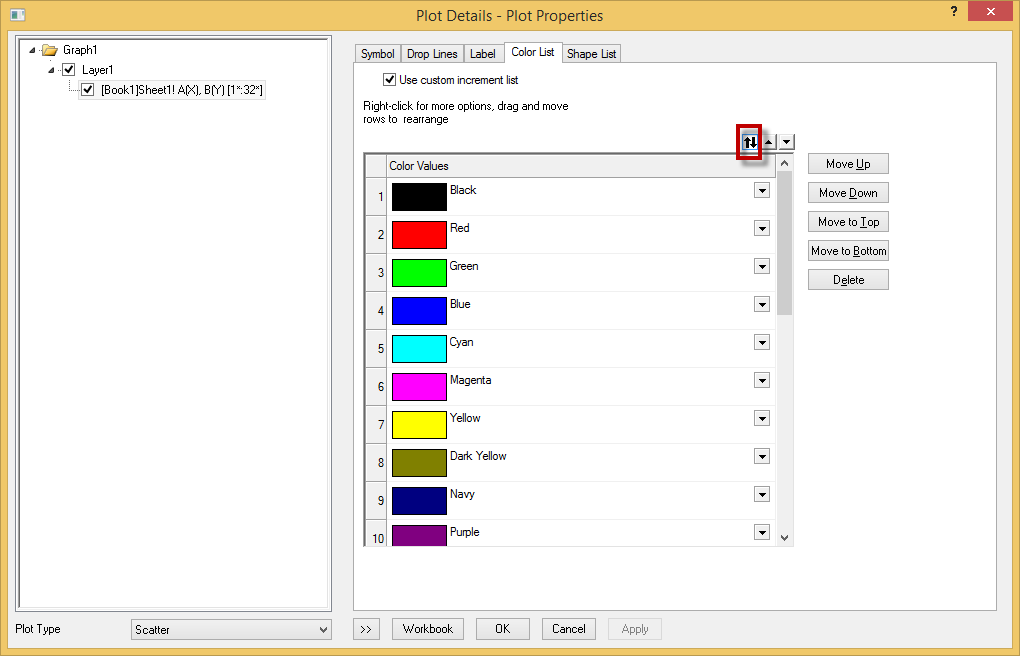
Support flip color increment list | Allow the order of colors in the color list or the order of shapes in the shape list be flipped. When the Symbol Color is set to increment, can flip the order in the Color List tab. This also applies to the symbol shape.
| |
Use tab style dialog for more analysis and statistics tools | Changed the dialog to be tab-based for the analysis/statistics tools with long trees, especially those statistics tools. User can change back to old GUI by setting system variable @TSD to 0. (Choose Tools: System Variables... menu. Enter TSD as Variable and enter 0 as Value.) | |
ORG-11356 | Better extra large icon images for folder, workbook, matrix, notes, excel book in Project Explorer (SR1) | |
ORG-13960 | Flyout buttons on Toolbars more obvious (SR1) | Before SR1 – Tiny, not obvious In SR1 – More standard, easier to click on to expand |
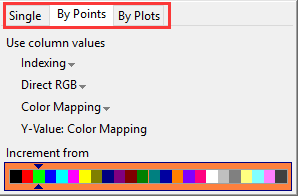
ORG-13777 | Change Color List on By Points tab of Chooser Chooser (SR1) | Before SR1, user must change color list on Color List tab of Plot Details if the plot color is set to incrementing or using other column values. In SR1, user can directly change Color List on By Points tab of Color Chooser. |
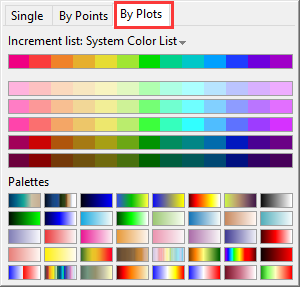
ORG-13917 | Ctrl+ click Color List or Increment List in Color Chooser to edit color orders. (SR1) | In SR1, user can click Ctrl+click Color List on By Points tab or Increment List on By Plots tab of Color Chooser to change the order of colors and save as future color increment list. |
ORG-14036 | Template Library Filter status better not kept between Origin sessions (SR1) | Before SR1, if user pressed Filter down to exclude cloneable templates that don't match the active workbook, when restarting Origin, the filter button is still pressed and no template may show in Template Library since default Origin workbook only has two columns A(X) and B(Y). In SR1, a system variable @TLF is added in SR1 to allow this filter state to be |
ORG-13757 S1 | Add Allow System Theme to override checkbox in Template Modify dialog (SR1) | When plotting graph with a user-defined graph template, system theme will be applied if this Allow System Theme to Override checkbox is checked when saving graph template User can click edit button in Template Library to uncheck it now in SR1. |
ORG-13614 | Support Shapefile map in Object Manager (SR1) | After import Shapefile maps into Graph, the shapemap would be showed as a branch in Object Manager, each part could be a sub-object in this branch. So once the selection is turned on(right-click an object and select Selectable to turn on or turn off), users can select and modify the map, the selection of whole and partial could be similar to group and plot. 
|
ORG-14269 | Startup Tips Dialog Improvements (SR2) | We improved Startup Tips dialog.
|
ORG-14353 | Color palette is more friendly to people with color-blindness (SR2) | Add two built-in color lists for color-blindness people: Q09 ColorBlindSafe8 and Q10 ColorBlindSafe15 |
Graphing
New Graph Types
Labels, Legend, Color Scale and Bubble Scale
JIRA | SUMMARY | DETAILS |
|---|---|---|
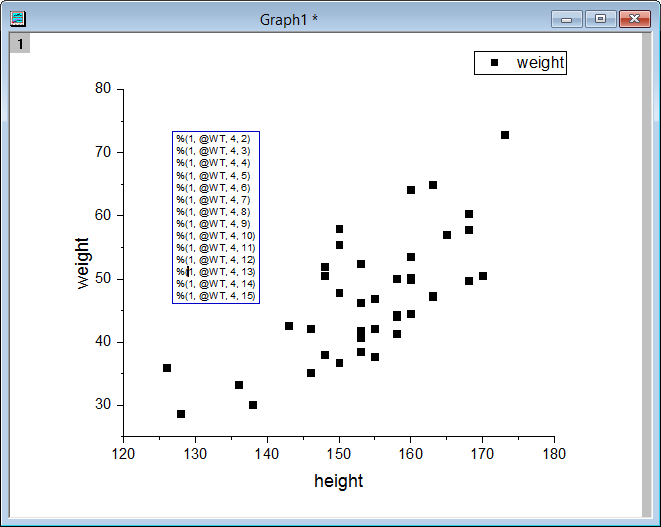
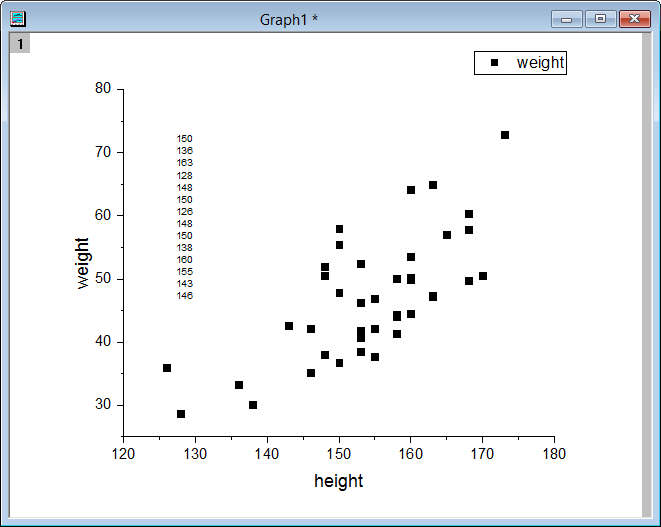
Easier Way to Annotate Graph with Data or Label in Worksheet and Project&Window Information | Support inserting variables from worksheet cell into text (only for graph) Add a button in Insert Variable dialog, which can hunt worksheet cell and then insert it:
Additional Info (%G, %X, %H) in Plot level for Insert Variable Dialog In the Insert Variable Dialog, if the root folder(root node) of the worksheet(graph) on the right panel is selected, we are able to insert: 1. Active Window Name //%H into the graph or worksheet. Worksheet insert variable dialog: Graph insert variable dialog: | |
Annotation Tool: Customize Display Label, including metadata support, etc. | Allow to customize the format of the annotation added to the plot. It is available for 2D XY plot and polar, and contour from both XYZ data and matrix. How to...
| |
Data Labeling on Indiced Points Only and More Label Format Controls | Show Legend along Plot by Attaching Data Label on a Single Point or several points | |
GUI for leader line in 3D plot label | Add GUI to allow the access to the leader line setting Color, width, direction, shape of the leader line in 3D plot can be changed. | |
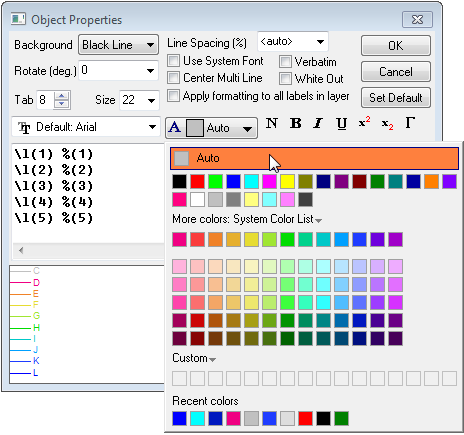
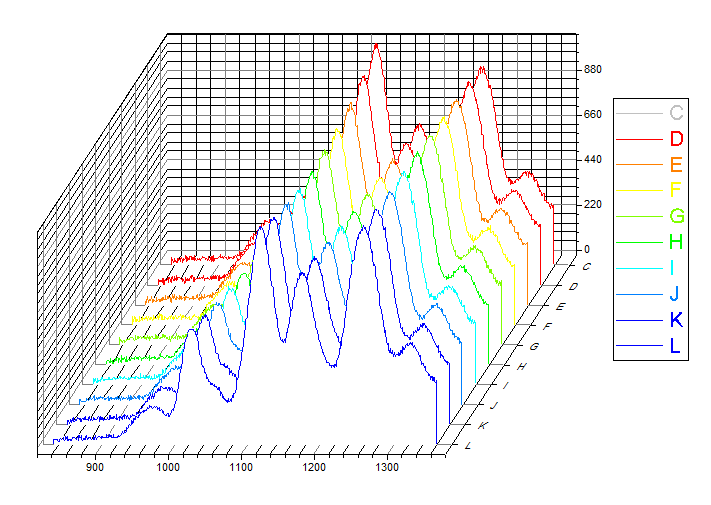
| Legend and Color Scale improvements | Legend text follow legend symbol color. Also works for color scale. right click legend to enable object property. Setting color to Auto will have the color of the label follow the color of the symbol. This is also support for regular text label. If there is %(n) substitution notation(s) and color is set to Auto, it will use the 1st substitution notation's corresponding plot's color for the whole text
Also works for color scale label
Show color scale as blocks of colors and their corresponding range
2. Allow color bar to be separated. 3. the result:
Notation to Alignment different portions of text in multiple line
"^(lu)" means the text before and after this anchor is a unit, the part before and the part after will not be added extra space by drag and control. But the part before and after "^(lu)" will still consider the alignment separately, like it contain 2nd level.
|
ORG-13167 | Control Legend border line width on Style toolbar (SR1) | |
ORG-13830 | Fill Pattern supported in Categorical Legend (SR1) | Fill Pattern checkbox is added in Categorial legend dialog |
ORG-14327 | Data label not shown at last point because for missing values (SR2) | Last point in data label should be the last plotted regardless the rest of missing values. |
Plot Manipulation
JIRA | SUMMARY | DETAILS |
|---|---|---|
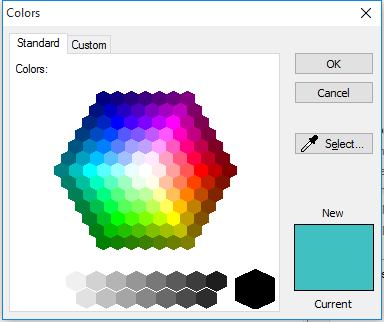
New, Powerful Color Chooser: Larger Color Collection, Easier Way to Pick Custom Colors, and Recent Colors | New Color chooser for all elements in Origin that supports color customizatin, such as plots, axis, text labels, graphic object, cells in worksheet, etc.
Color button-menus for various type of single plot is improved:
Custom dropdown list: User can load increment color list, save user's own color list and edit existing color list, etc.
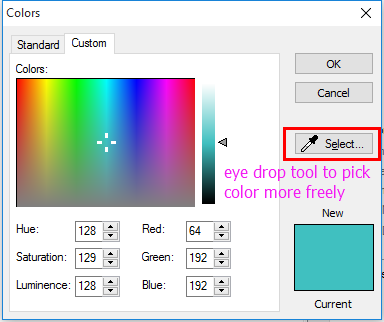
Customer color dialog is improved. Add eye drop tool so that user has more freedom to choose color any where on the screen
Users can customize the color of the plots through toolbar control icons and the tab style color selection fly-out offers user more options for color control of the plots. By Points tab:
By Plots tab:
3. The increment list or palettes for "by plots" coloring can also be adjusted in the group tab in plot detail dialog.
| |
Map line style and line width to another column | In the plot detail dialog, can set the style and width of the line to be mapped to a column. | |
Allow sorting column sets even when cumulative is None | Add Incremental option in Plot Detail dialog under Layer level allowing draw small blocks first. If two blocks are of equal size, can let them show side by side by check the "Show Overlapped Column/bar" box. | |
Box chart\bar\column plot improvements: allow map color to groups defined through column label | Specify subgroup according to its column label In the plot detail of grouped box chart plot, allow the color of the box to map to which level of the group which is very useful for dataset with unbalanced group size.
2. If color is set to vary within subgroups:
Stack plot support groups defined by column label In stack column/bar plot, if subgroup is set based on column label, then we can have the column/bar to stack based on that subgroup. In this case, subgroup are set based on "Parameters" . The resulting bars are colored and stacked based on this subgroup.
Grouped box chart plot from raw data can sort plot order by group info Add a check box "sort By Group Labels" to allow nested sorting of the box labels: Before sorting, boxes are ordered by appearance order. After sorting, boxes are ordered alphabetically on each group label.
| |
Fill Pattern needs to support custom list | Under the Pattern tab in plot detail dialog, user can set the filled pattern with index referencing to other dataset.
A new tab "Pattern List is" is added when increment or indexing is selected in fill pattern where user can customize the pattern list. | |
Stack Line by Y Offset with Scaling Factor and Log Scale Support | Add scaling factor for both X and Y directionSet Multiplier for each plots to enlarge some details.
Keep Proportion of Stack Lines by Offset on Log ScaleBy checking Keep Propertion of Plot Range, user can still see details of each stacked plot on nonlinear log scale. | |
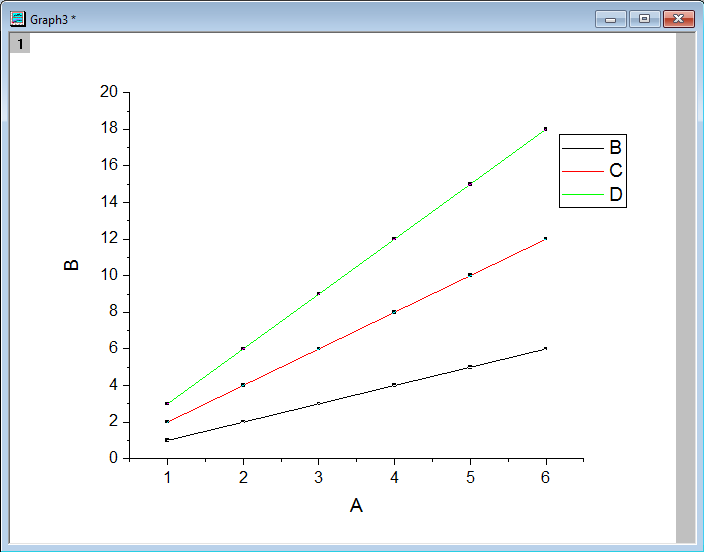
Template-Support using column name when mapping color to a column | Under the Miscellaneous tab in the page level dialog of the graph, add the option Match modifiers by( for template and copy format) that allow users to customize the modifier mapping method when copy format and plot with template. Users can fetch the modifier column by <offset> ,longname , shortname, etc. In this case, two plots are made from col(B) and col(C). In Graph1, the color of the points are mapped to col(D) with longname color. Setting Match Modifiers by to longname makes the plot2 colormap to the column with the same column longname, col(D) in this case. If set Match Modifiers by to <offset>, the color mapping column will be specified by the relative position to the plotting column.
The tooltip in the plot detail dialog of the plot shows the modifier match method. | |
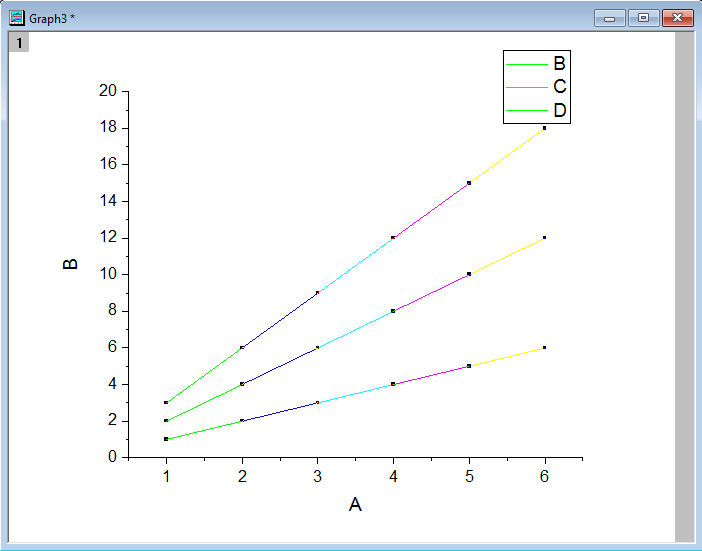
Y-Value Colormapping for Scatter, Column/Bar, Area Plots | Y-Value color mapping was only supported for line plots including waterfall plots. Since Origin 2016, we added it for plot plot types that support colormapping. E.g.
When using Y-Value Color Mapping. Origin find the min and max of all Y plots in the group and build colormap levels. On Plot Details dialog, you will see on Group tab, color's Increment column is set to None, while on Symbol tab, Symbol Color is set to Y-Value: Color Mapping. On Colormap tab, the Levels are from min to max of all Y columns in the group of plots.
For column/bar or area plots, the color control is on Pattern tab. | |
ORG-13903 | Context menus on Axis to easily bring axis to front or push to back. (SR1) |
By default data is drawn on top of axis. If user wants axis, ticks or grids to be on top of data, right click axis and choose the corresponding context menus. Before SR1, user had to go to Plot Details dialog; select the layer on the left and then go to Display tab to customize. |
ORG-12862 | Support customizing shade made by Integrate gadget (SR1) |