Origin 2016 SR2 Bug Fixes
Import and Export
JIRA | SUMMARY | DETAILS |
|---|---|---|
| ORG-14160 | Export graph with tight margin, the top Y axis tick label been cut in half. | Open expGraph dialog and set Margin Control to be Tight or Tight in Page. Turn on preview. |
| ORG-13771 | Graph export fails when Long Name contains quotes. | Export a graph whose long name contains double quotes fails with error: "Export page failed, error 308". |
| ORG-14400 | <sheet> theme is not used by default when drag and drop file. | Save theme to sheet, and drag and drop ASCII file onto the sheet to import. ==>The <sheet> theme is not used. New issue since Origin 2016 Sr0. |
Graphing
| JIRA | SUMMARY | DETAILS |
|---|---|---|
| ORG-14279 | Plot list failed to show on left panel of Plot Details dialog | If user plotted scatter graph with data from different workbooks and use Colormap option to map the symbol color to another column in worksheet, all plots after first plot shows as blank on left panel of Plot Details dialog. New issue since Origin 2016 Sr0. |
| ORG-14267 | Hittest selection of special point label is away from label when moved | Turn on data label of a single point in graph. Drag the label to move it. The hittest selection is away from the label. New issue since Origin 2016 Sr1. |
| ORG-14238 | Failed to show line style when plot type is line+symbol | For line+symbol plots, user sets line styles to be different such as solid, dot, dash, etc. But somehow all lines show as solid. Old issue at least since Origin 8.0. |
| ORG-14233 | Pre-8.5 project file (opj) with error bars converted to lines by mistake. | User has opj file with graphs of error bars made in Oriign 8. When open it in version 8.5.1 or later, the error bars show as lines and offset labels. |
| ORG-14210 | Crash when creating a plot with large size categorical data | One way to reproduce the crash:
New issue since Origin 2016 Sr0. Before this fix, the workaround is set system variable @MTTL=-1. |
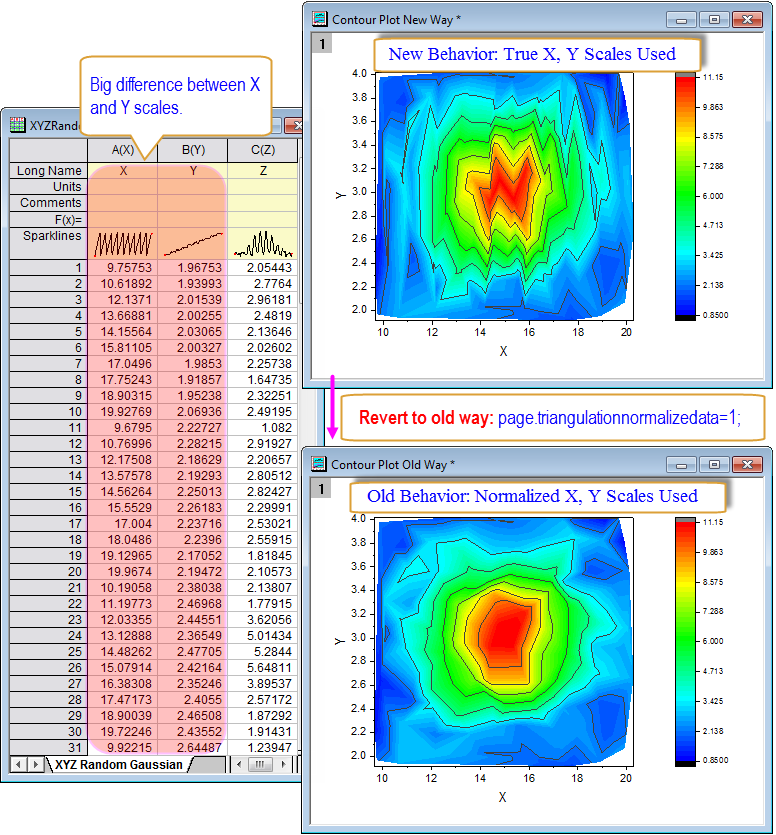
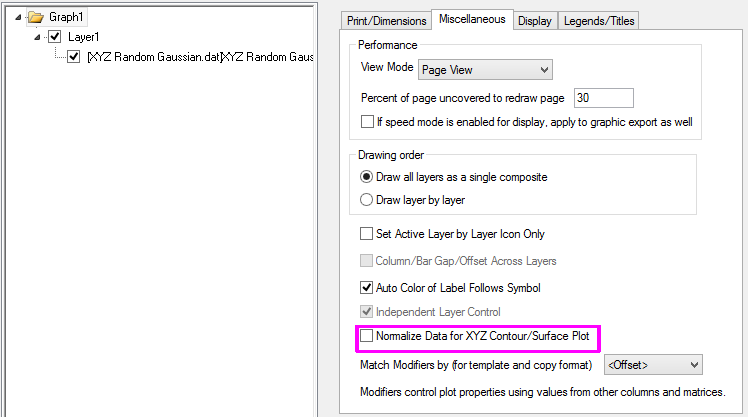
| ORG-14108 | Contour plot shows differently between Origin 2015 and Origin 2016 | This is because since Origin 2016, we we use true scales of X and Y data in contour triangulation so that it's consistent with Matlab, while in older Origin versions it actually normalized X and Y scales and then did contour triangulation. See more on Allow using true scales of X and Y data in contour triangulation
page.triangulationnormalizedata=1
|
| ORG-14427 | Fill Area graph is shown differently between 9.2 and 9.3 | Both fill pattern and fill color are changed when open old opj in 9.3. The differences are caused by the Groups of plots are changed. New issue since Origin 2016 Sr1. |
| ORG-14308 | Skew handles issue in Toolbar: Line tool | 1. Draw a line from Line Tool in toolbar on a graph, double click the line, check the Rotating check box in Control Tab and click OK. 2. Click once on line, pause long enough to avoid a double-click (about a second), and then click a second time on the line. New issue since Origin 2016 Sr0 |
| ORG-14175 | Batch plotting issue with "Auto Update Page Short Name to follow Long Name" is checked. | If Auto Update Page Short Name to follow Long Name is checked on Miscellaneous tab of Tools: Options dialog while there is no long name in graph window, batch plotted with new worksheet/book failed to work. |
| ORG-14009 | The text failed to keep consistence with colors between two single color controls | In a Column plot, open Plot Details dialog. In Pattern tab, set Border Color through Single-> More colors-> choose a color from a palette. Move mouse over the Fill Color, it will change to a random color. Click Fill Color drop down list ,in Single tab, text shows More colors: 'name of color list'. However the color list below this name is not the correct one, actually it is as same as the palette chosen for Border color. Then set Fill Color with another color from a different palette rather than the border color palette. Move mouse over Border Color drop down list, the border color changes to a random color. |
| ORG-14192 | No responding when plot multiple dashed lines with many clipped points. | The issue essentially caused PC to lock up for extended periods when user tried to open a opj file with a graph active, which contains multiple dashed lines with many clipped points or when user draw a such graph. New issue since Origin 2016 |
| ORG-14393 | Transparency system variable failed to work. | In 3D plot, open Plot Details dialog, set Transparency as 50. Click Ok. Select Tools: 3D OpenGL settings, Disable Transparency or run script @oglt=0 , however transparency still can work. Select Tools: 3D OpenGL settings again, Enable Transparency or run script @oglt=1, however transparency fail to work. New issue since Origin 2016 |
| ORG-14295 | Crash when set a break on 3D surface colormap plot if data is from different books. | Click 3D surface colormap button by toolbar to open Plot Setup dialog, then on middel panel select data as X, Y and Z from different books. Click Ok to create the plot. Open Z Axis dialog, on Breaks tab, set break number as 1, click OK. Origin crashes or stop working. Old issue since Origin 92. |
| ORG-14551 | Special point label failed to keep font setting | To reproduce:
The problem exists since 8.5.0 when plot label is introduced. Fixed in SR2. |
Analysis
| JIRA | SUMMARY | DETAILS |
|---|---|---|
| ORG-14342 | Peak Analysis Preview graph issue if starting new project without closing PA. | If user started a new project without quitting Peak Analysis (PA) dialog, which was on Integrate peaks page, the next time when open PA again, there was no line on preview graph. New issue since Origin 2016 Sr0. |
| ORG-14236 | Peak Analyzer preview window was kept in saved opj by mistake. | If user saved an opj with Peak Analyzer open, and later reopened the opj file, Peak Analyzer Preview window should not show. New issue since Origin 2016 Sr0. |
| ORG-14414 | Backward compatibility issue on 2D FFT/IFFT result created by old versions. | If user open an opj file created by old versions, the complex results for both 2D FFT and IFFT are different from old results. Similar problem exists in theme files created in old versions. New issue since Origin 9.0 |
| ORG-14471 | Find Z from XY faild to replica Nonlinear Surface Fit | When perform Nonlinear Surface Fit, set Number of Replica in Advanced page as more than 0 and check Find Z from XY checkbox in Find Z page. After fitting, active FitSurfaceFindZfromXY sheet, enter data in col(A), and col(B) for X, Y value. No Z value output after recalculation. New issue since Origin 2016 Sr0. |
| ORG-14370 | Wrong results of Proportion Test tools in German version | In Origin German version, perform One-Sample Proportion Test or Two-Sample Proportion Test in Statistics : Hypothesis Testing leads to wrong results. This is caused by the default setting for separators in German version is different. One\Two Proportion Tests in Statistics: Power and Sample Size do not have this problem. Old issue since Origin 9.1 German version. |
Programming
| JIRA | SUMMARY | DETAILS |
|---|---|---|
| ORG-14580 | OC code failed to create output column | This is broken since Origin 2016. Fixed in SR2 now. Compile the following function: |
| ORG-14481 | LabTalk failed to delete project variables with wildcard (like "del -v aa*") | Define two variables in Script Window: aa1=2; aa2=3; list v; Fail to delete them with script: del -v aa*;list v;//==>These two variables are still listed. |
| ORG-14351 | 申(Unicode/Hex=U+7533) caused file name trimmed. | If a file name contains a specific character - 申(Unicode/Hex=U+7533, Unicode/Dec=申, JIS/Hex=3F3D, ShiftJis/Hex=905C), after save the file, the preceding characters in the file name are lost. The file could be an opj, ogg or ogw file. For example, the project file name was: abc申def.opj. Then, the File Name field in the "Save As" dialog box becomes: def.opj. |


