changes.mady.by.user Wall-E
Saved on Nov 07, 2017
...
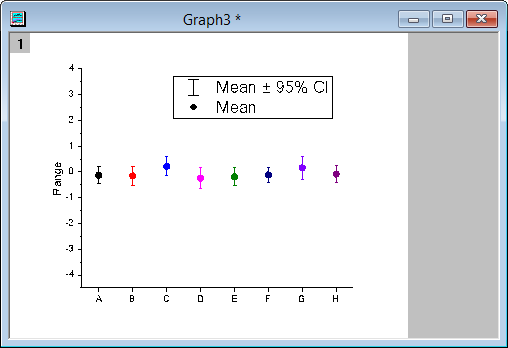
Add Interval Plot under the Plot:Statistics. Interval Plot plots the mean and 95% confidence interval for grouped data.
Image RemovedImage Added