...
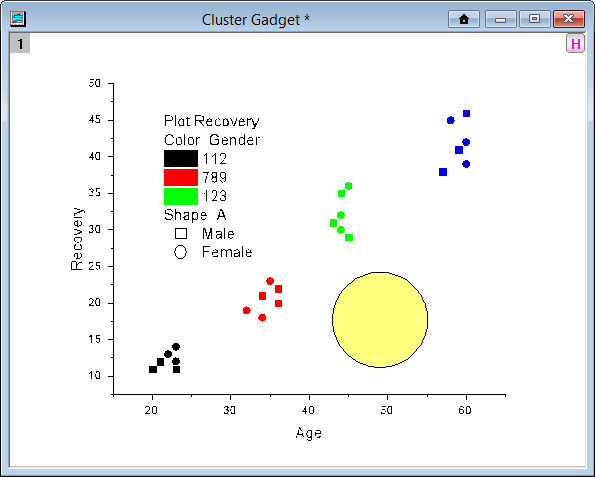
- Select the interested datapoints on the plot.
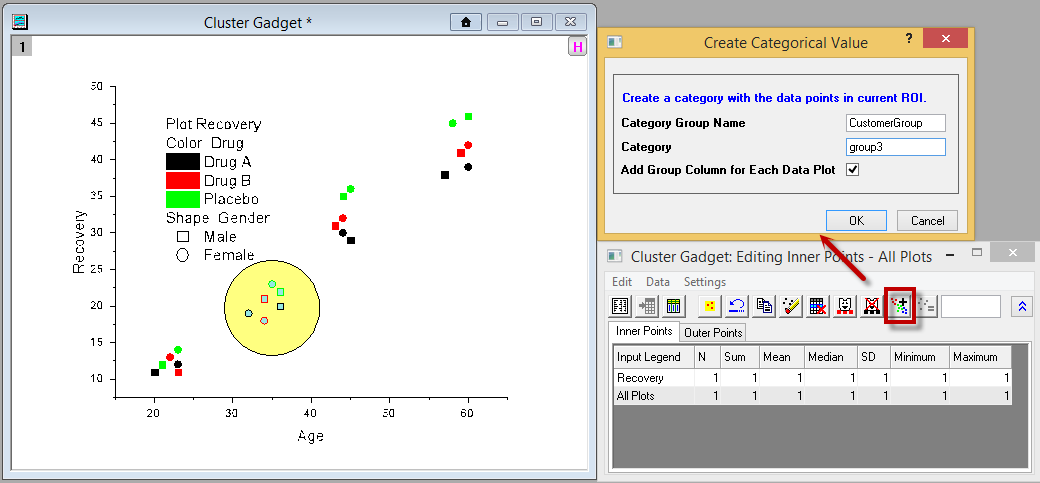
- In the Cluster Gadget dialog, click the Add Categories button.
- In the Create Categorical Value dialog, give a name to the new group(CustomerGroup ) and names(group3) for each category.
4. This will generate a new column in the source data which denotes the category info of each points.
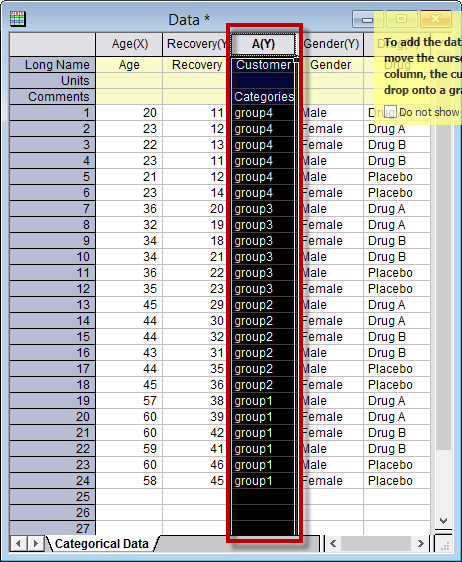
5. Data points can be recolored referring to the new category info.