...
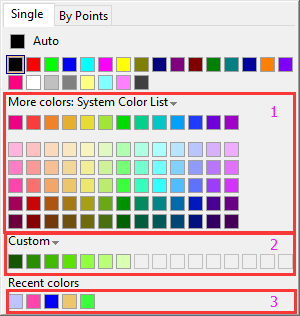
- Support more colors. In the dropdown list of More colors, user can choose a color list and luminosity variations for each color are generated automatically as a table that user can choose from.
- Custom color can be changed by Ctrl+click the colorbox. This is indicated via tooltip in colorbox. Also Custom dropdown list provide users more flexibility to customize the color.
- Added a single row of "Recent Colors" .
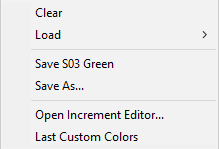
Custom dropdown list: User can load increment color list, save user's own color list and edit existing color list, etc.
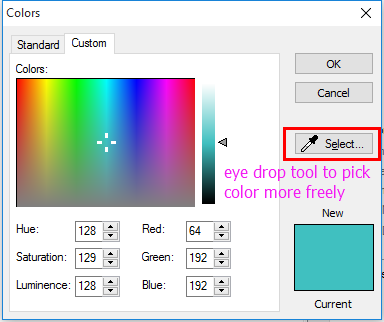
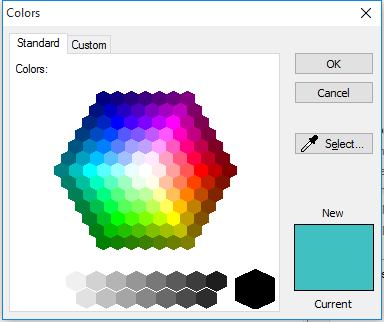
Customer color dialog is improved. Add eye drop tool so that user has more freedom to choose color any where on the screen
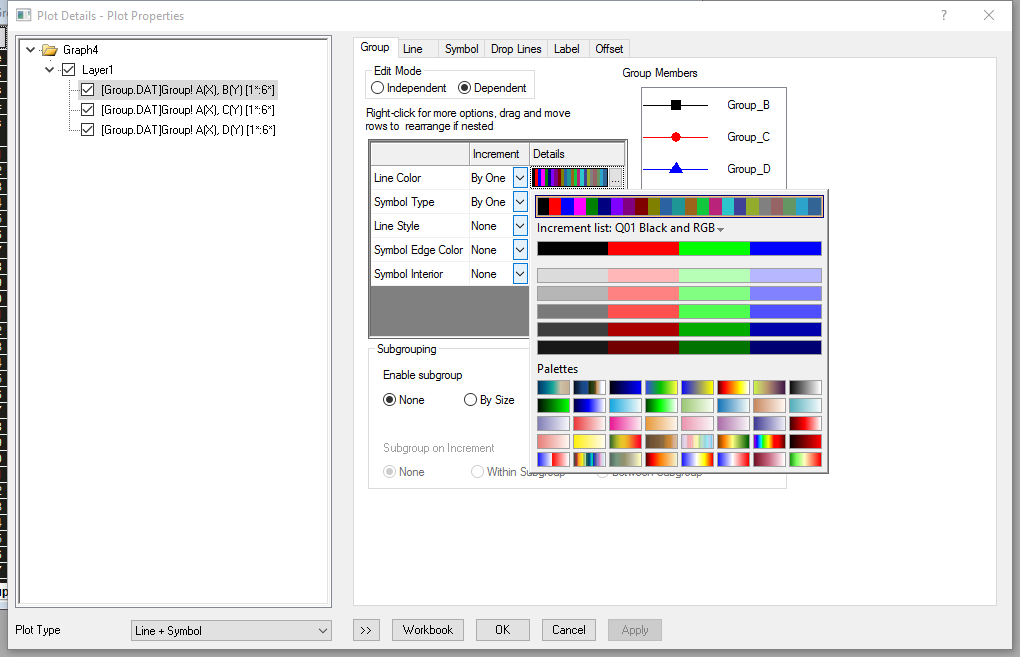
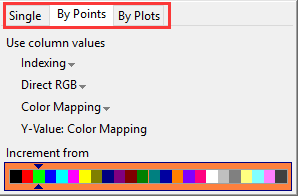
Users can customize the color of the plots through toolbar control icons and the tab style color selection fly-out offers user more options for color control of the plots.
...
- Index/RGB/map the color of lines/symbols/area of each curve to columns.
- map the color to the values of whole dataset using y-value mapping.
- Color using increment color list which can be edited in the plot detail dialog.
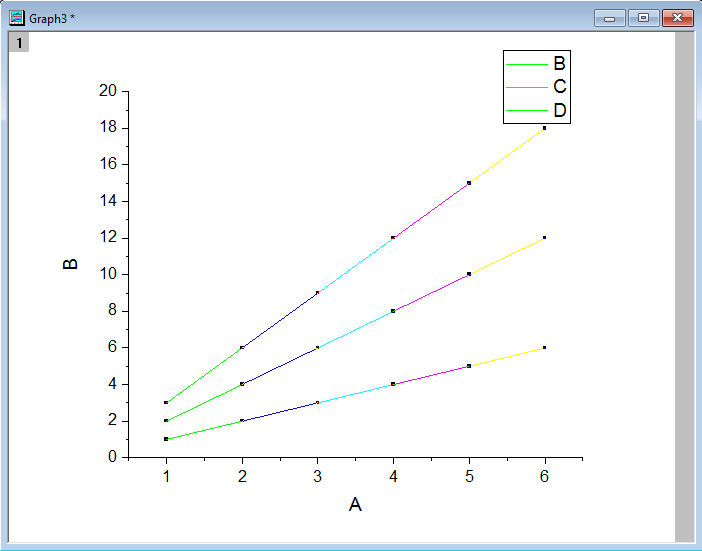
By Plots tab:
- Each curve are colored with a increment color list.
- Each curve are colored with palettes.
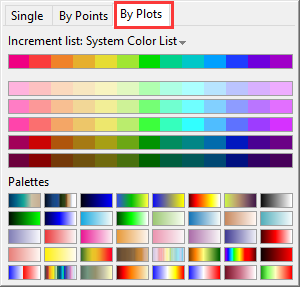
3. The increment list or palettes for "by plots" coloring can also be adjusted in the group tab in plot detail dialog.