Skip to end of metadata
Go to start of metadata
You are viewing an old version of this content. View the current version.
Compare with Current
View Version History
« Previous
Version 58
Next »
(ORG-7889)
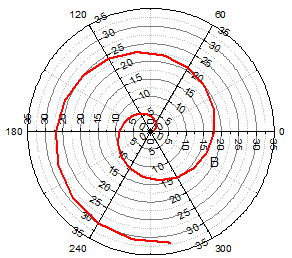
Sample OPJ to download to try: Polar Graph.opj
 |  |
 | 
|
 |  |
How to: Turn on/off outer/inner azimuth and grid: - In Azimuth Axes node in left panel, uncheck Show Outer/Inner Axis checkbox.
- In Azimuth Axes: Grids node, uncheck show checkbox for major or minor grids.
Change Radial axis Configuration: - For first sample graph, select <major ticks> for Number of Axes in Radial Axes node.
- In Radial Axes node, click New Configuration... button.
- Custom your inside/outside axis in the Radial Axes Configuration dialog.
You can also choose custom for Angles List and type in your desired angle with space separate. - You can select each new generated axis node to customize further.
- You can also right click the left panel and select Add/Duplicate/Delete.
Customize Radial Axis: - Set axis position by OAxis #/IAxis # node. Node's name would change automatically with Reference.
For inner radial axis, we provide two different Reference methods: Azimuth Angle and Clock Dial.
If you choose one radial axis's Reference to be Frame Border, it become a outer axis. - Check Perpendicular Shift checkbox and set % of Radius value if you want axis offset.
- Select Flow Direction for tick and labels. See the hint below it with different Reference for more detail.
|
Different unit support for Azimuth axis (ORG-2267, ORG-8137)
 |  |
 |  |
How to: In Axis dialog: Azimuth Axes: Scale node. Choose Units dropdown list. It has Degree/Radians/Grdians/Custom options. If you choose custom scale, you also need to specify the Start/End Value for a whole circle. |
Flexible Start Angle&Orientation Combination (ORG-1796, ORG-8735)
 | How to: In Axis Dialog: Azimuth Axes: Orientation. Select Clockwise/Counter-Clockwise in Direction dragdown list. Choose or input start angle in Axis Start at (deg.) dragdown list. In this example, start angle is 30(deg.) and dirction is clockwise. |
 |
 |  |

| How to: Go to Axis Dialog: Miscellaneous: Crop. Check Enable checkbox and modify Left/Top/Width/Height to custom your display range. |
New control features in Azimuth grid lines (ORG-1796)
 |
How to: - Go to Axis Dialog: Azimuth axes: Grids
- In Start at dragdown list, choose where you want your grids start from.
|
Support From value greater than To in angle axis and show negative labels as positive. (ORG-7892)
 |  |
 |
How to: User can now set From value larger than To in Axis Dialog: Azimuth axes: Scale now to easier custom the graph display range. When you do this, if major ticks: Type is set to By increment, value should also be negative. Check Axis Dialog: Azimuth axes: Tick Labels: Outer/Inner, Show Negative Labels as Positive checkbox to let negative labels show as usual value. |
Center at zero on scale tab for Radial Axes (ORG-8552)
 |  |
 |
How to: In Axis Dialog: Radial Axes: Scale tab, uncheck Center at Zero checkbox to let all radial axis start at scale From value. |
 |
How to: In Axis Dialog: Radial Axes tab, set the value (or <major ticks>) at the Number of Axes. |
Polar Columns
 |  |
How to: After plot a regular polar graph, you can go to Plot Details dialog and change the plot type to be Column/Bar. - To stack columns: go to Plot Details: Plot Properties: Group tab, set Subgroup Size.
Then go to Plot Details: Layer Properties: Stack tab, choose Offset to be Cumulative and check Use Subgroup (in Group tab) for Cumulative checkbox. - To show grid line on top of data, go to Plot Details: Layer Properties: Display tab, check Grid on Top of Data checkbox.
In Plot Details: Plot Properties: Spacing tab, you can choose a column from the worksheet in Width(in %) dragdown list and let each column width indexed by it.
|