Table of Contents
Text XY in Virtual Virtual Matrix
(ORG-8178)
Sample OPJ to download to try: Virtual Matrix with Text Labels.opj
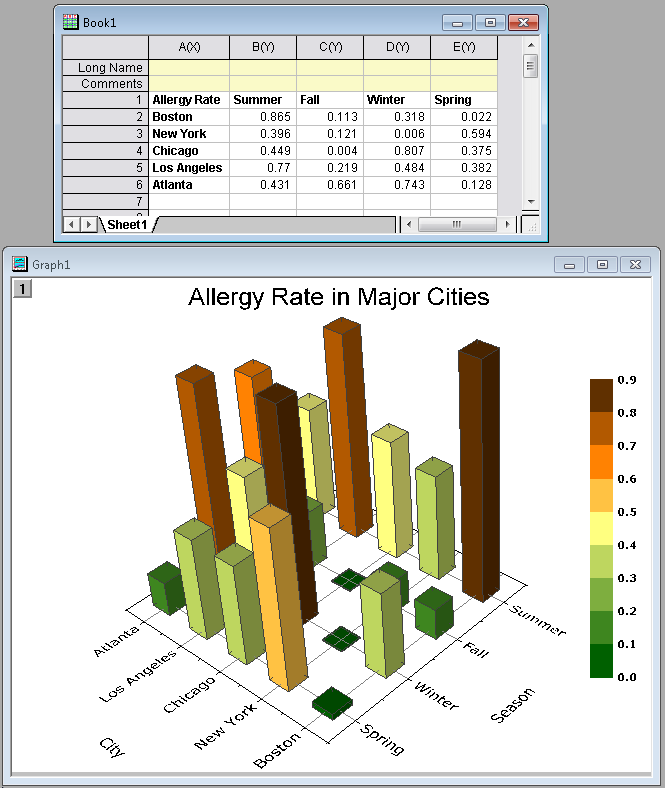
X and Y labels from text are now supported when creating 3D and contour graphs from Virtual Matrix.
E.g. the following data in worksheet are used as virtual matrix to plot 3D bars. X and Y axis tick labels are read from X and Y information from the worksheet.

How to:
1. Highlight the whole worksheet, Book1, select "Plot: 3D Symbol/Bar/Vector: 3D Bars" from the Origin menu
2. In the plotvm dialog, accept the default setting, that is, Y Values in 1st row in selection, and X Values in 1st column in selection. Click OK button to plot the graph
Subrange as Data Range
ORG-8285
range.sub(name/index) to get a subrange from a data range by either specifying a name or index.
| Code Block |
|---|
//For example, with a virtual matrix named as ztitle, you could use subrange to return a dataset for Y values as:
ztitle.sub(y);//by name
ztitle.sub(1); //by index
ztitle.sub(y)[3]=;
ztitle.sub(y)[3]$=;//return 3rd value in this dataset |
Improve the speed of plotting virtual matrix
ORG-8342