(ORG-3693)
Sample OPJ download to try: Fill Area between Curves.opj
...
- Curves should be grouped to trigger this new feature.
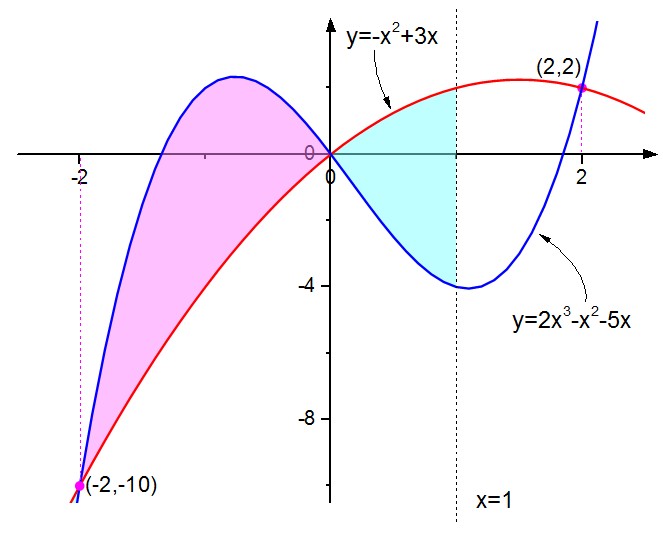
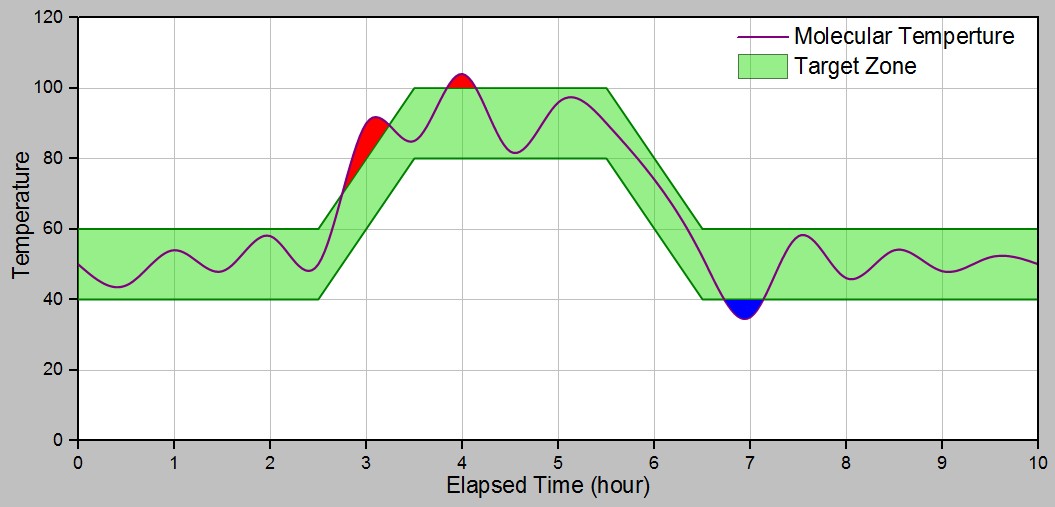
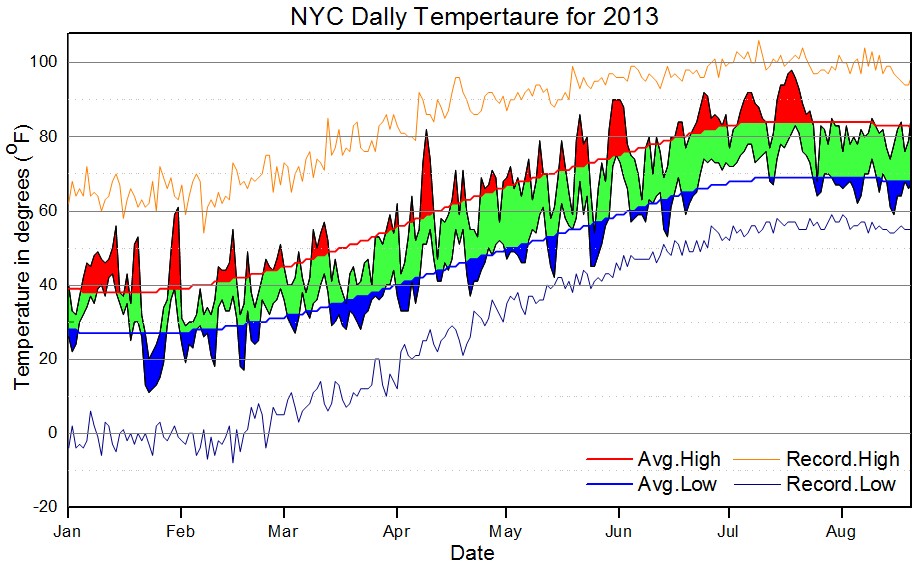
After plotting a graph with two line plots. User can Fill to next data plot - One Color, Fit to next data plot - Above Below Colors to fill color(s) between two line plots.


...
(ORG-3693) (ORG-9716)
- Filling area is between the curve and the one below it in the Layer Contents dialog, try modify the sequence of plots to get your desired graph.
 |  |
 |  |
How to:
| |
...
|
...
|
...
|
...
|
...
|
...
|
...
|
...
|