| Table of Contents |
|---|
...
Sample OPJ to download to try:
...
Column_Plots.opj
(ORG-946)![]()
Product Page of Column and Bar Plot
Table of Contents maxLevel 3 minLevel 2
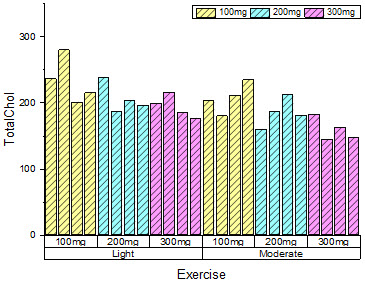
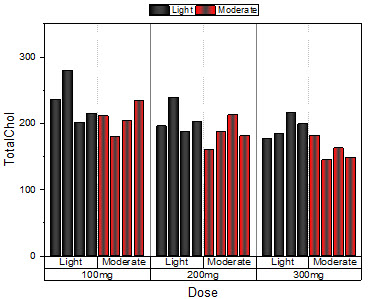
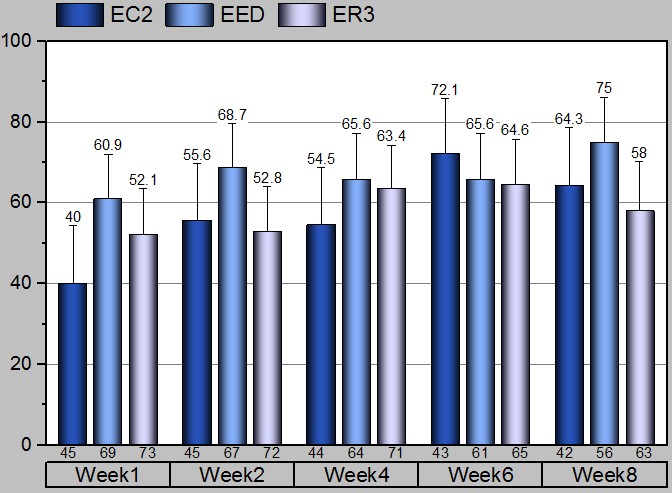
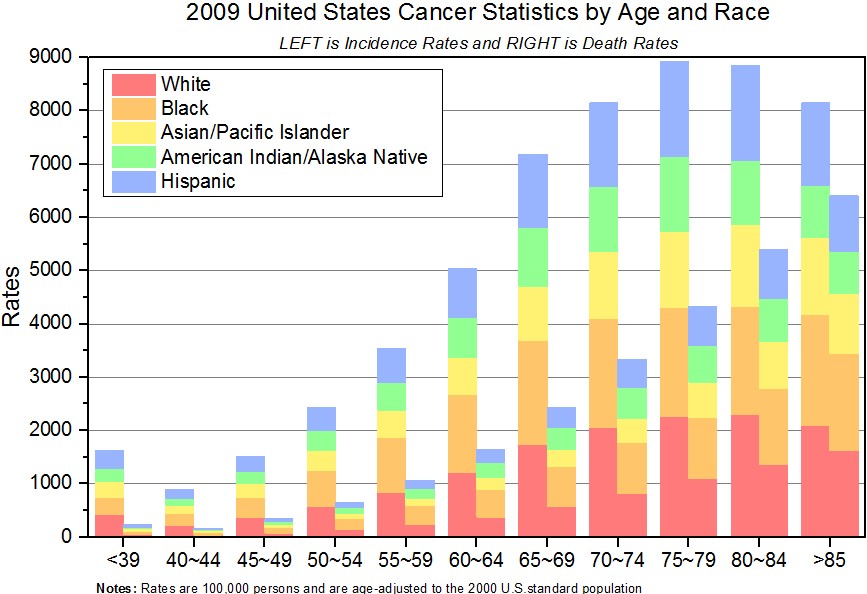
Grouped Column Graph (ORG-5344 , ORG-9449)
Menus are available |
...
under Plot: Column/Bar/Pie |
...
menu. Buttons are available |
...
on 2D Graphs |
...

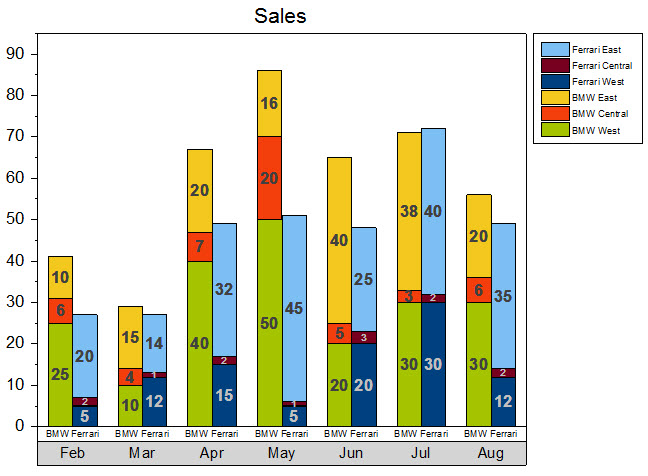
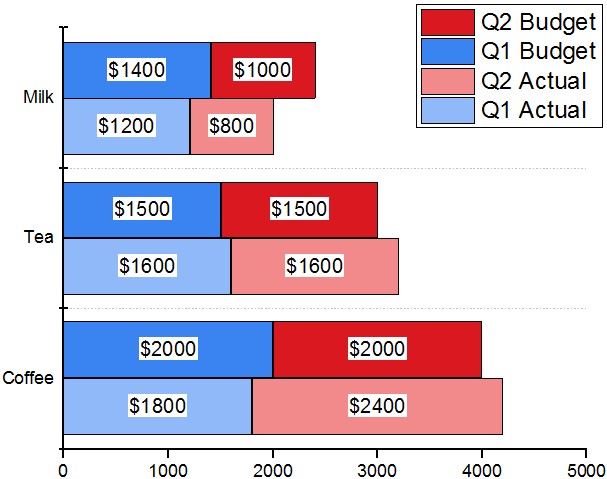
Grouped Stacked Column Graph (ORG-949)
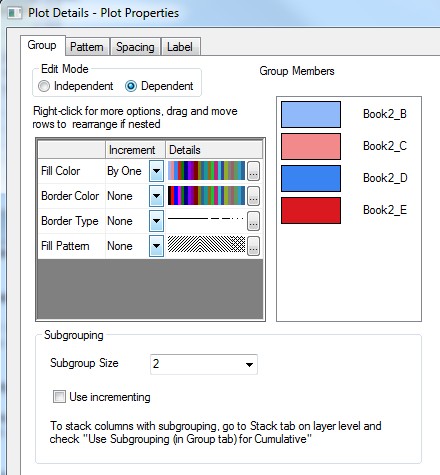
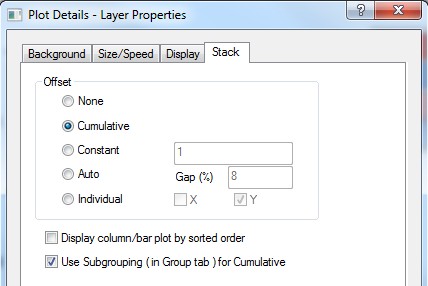
After plotting Stacked Column Graph, user can set subgroup size of a stacked column on Group tab of Plot Details dialog. E.g the following data.

If user wants to plot all BMW together and Ferrari together, open Plot Details, Set Subgroup Size to be 3 on Group tab.

...
toolbar, | |
 |  |
 |
|
| How to:
|
Grouped Stacked Column/Bar Graph (ORG-949)
 |  |
 |  |
|  |
How to:
|
...

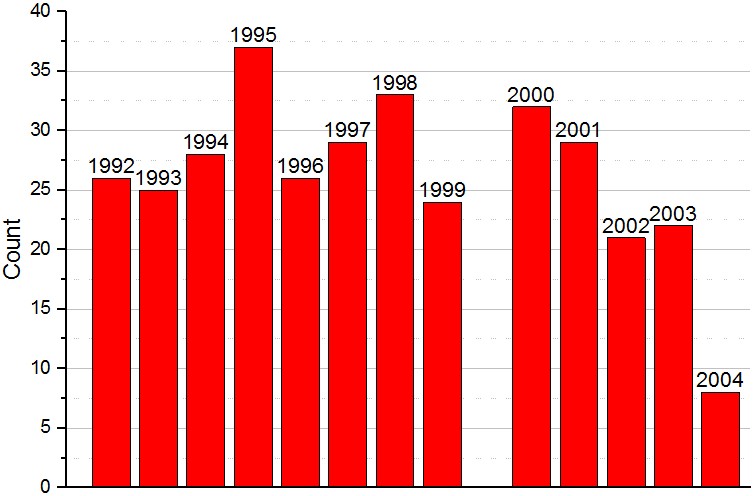
The graph will turn into the following:

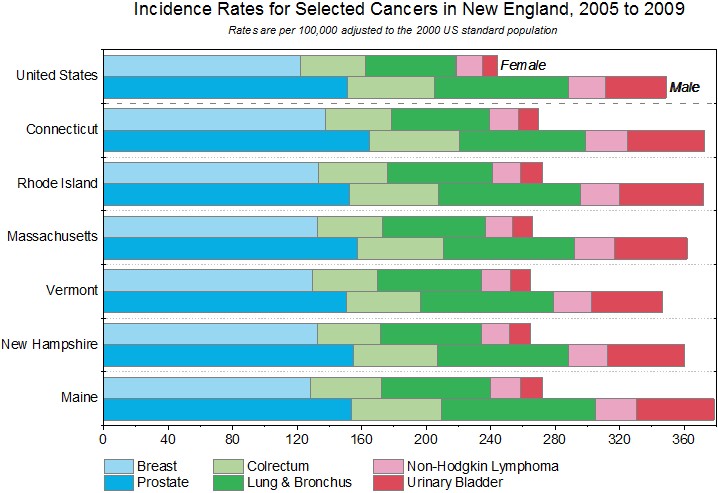
Variable Column/Bar Width
After plotting Stacked Column Graph, e.g from the following data.
Here, %Share in column F is not the actual data, but the calculated X center positions of columns
using the Set Column Formula:
i==1?(col(C)[i]/2):(col(F)[i-1])+(col(C)[i-1]/2)+(col(C)[i]/2)
...

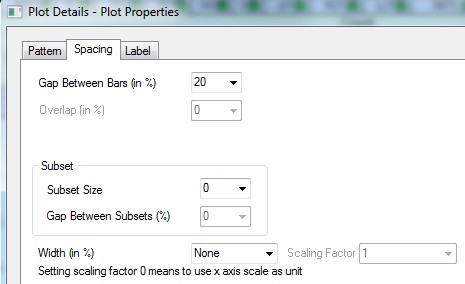
To set the column width from a dataset, set the dataset to Width field in Spacing tab in Plot Details.
You also need to set both Scaling Factor to 0, which is the new feature to indicate the column w or symbol size data from worksheet is in the same unit as the X axis.

The graph will turn into the following:
...
|
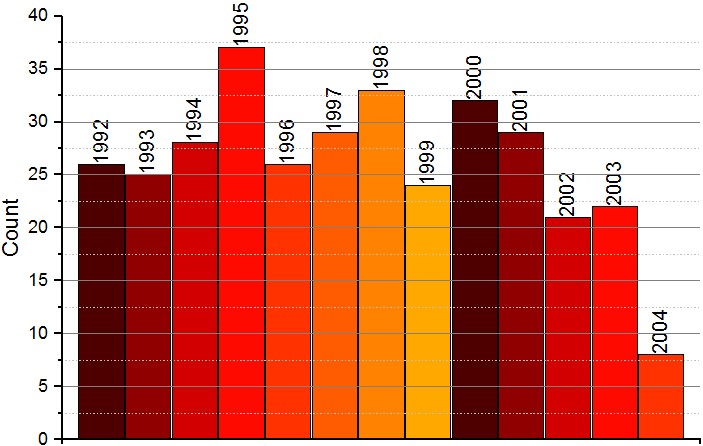
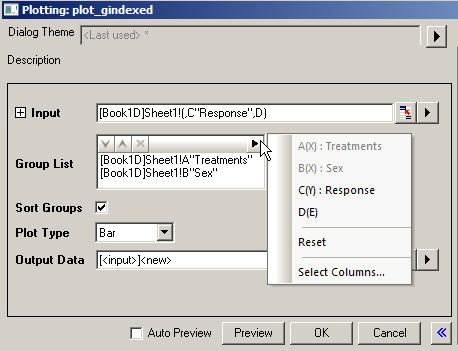
Subgrouping in Normal Column Plot
 |  |
| How to:
|