Sample OPJ to download to try:
...
(ORG-946)
Product Page of Column and Bar Plot
Grouped Column Graph (ORG-5344
...
Origin supports plotting grouped column graph including error bars from indexed data.
...
...
under Plot: Column/Bar/Pie |
...
menu. Buttons are available |
...
...
toolbar,  Image Added. Image Added. |
 Image Removed
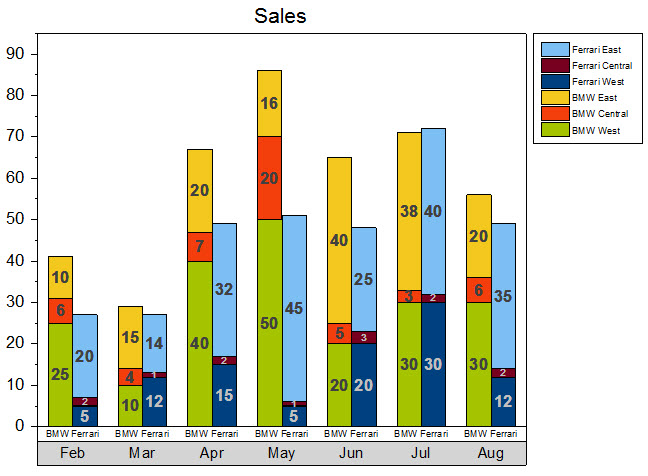
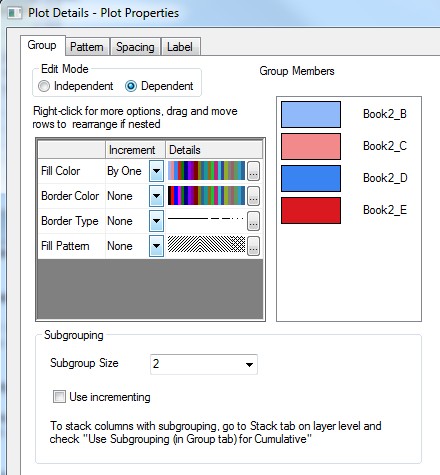
Grouped Stacked Column Graph (ORG-949)
After plotting Stacked Column Graph, user can set subgroup size of a stacked column on Group tab of Plot Details dialog. E.g the following data.
 Image Removed
If user wants to plot all BMW together and Ferrari together, open Plot Details, Set Subgroup Size to be 3 on Group tab.
 Image Removed
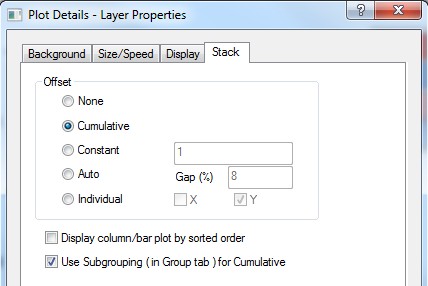
Check Use Subgrouping (in Group tab) for Cumulative checkbox on Stack tab
 Image Removed
The graph will turn into the following:
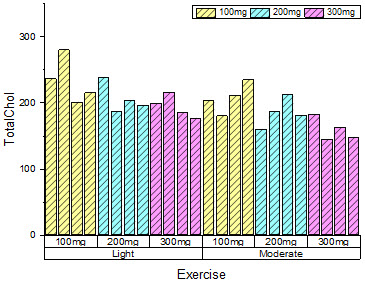 Image Added Image Added | 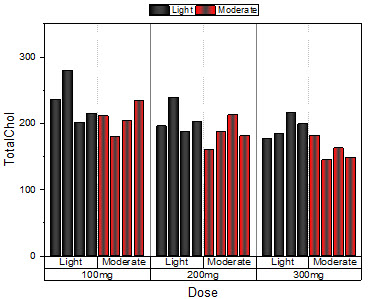 Image Added Image Added |
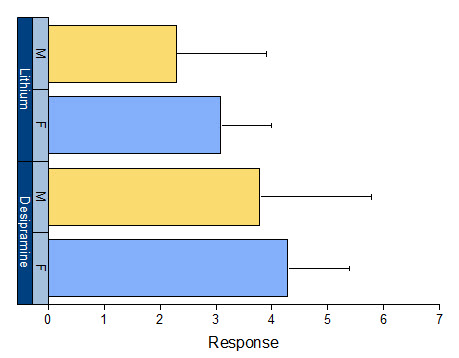 Image Added Image Added | 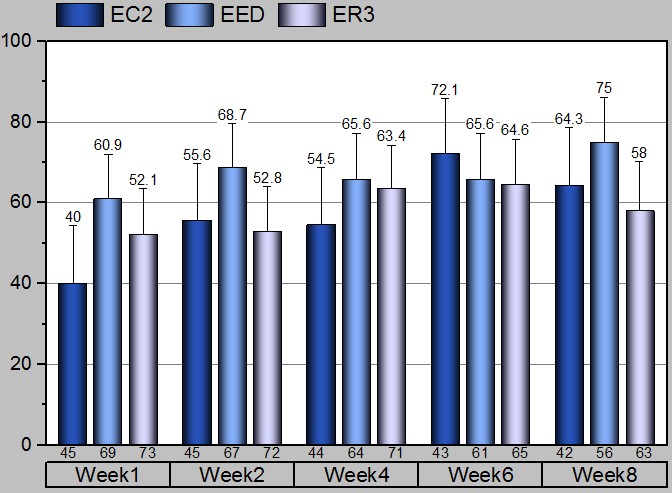 Image Added Image Added
|
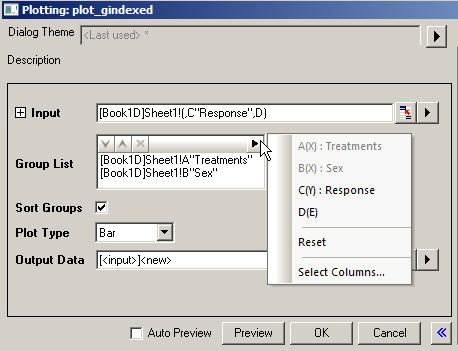 Image Added Image Added
| How to: - Click Select Columns... to add multiple grouping columns into Group List orjust select the fly-out one by one.
You can modify the sequence in Group List by Move Up/Down and Remove. - Uncheck Sort Groups if you don't want to sort the groups in alphabetical order of group name.
- Set Plot Type as Bar.
- Go to Plot Details: Plot Properties: Spacing tab, input Gap Between Subsets(%) to specify gap size between subgroups.
- Double click Tick Labels to open Axis dialog. Each row of the table has one node under Tick Labels node. Right click the node to move/delete it.
Note:
- The size of input range and all the group ranges must be equal.
|
Grouped Stacked Column/Bar Graph (ORG-949)
Subgrouping in Normal Column Plot
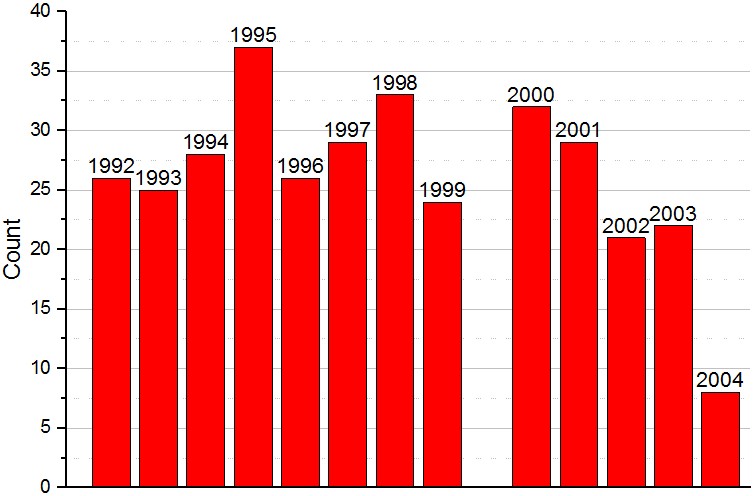 Image Added Image Added | 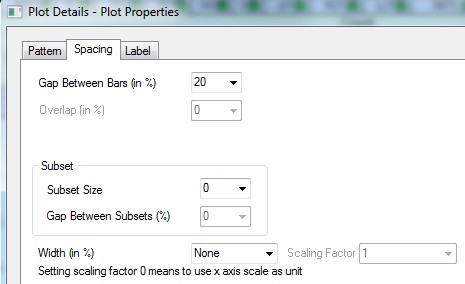 Image Added Image Added |
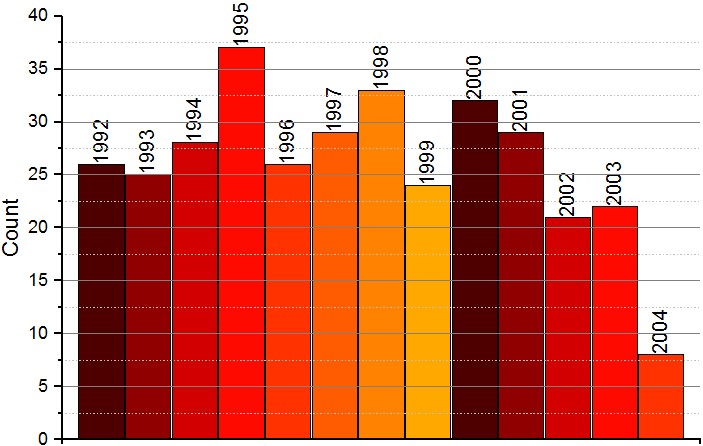 Image Added Image Added
| How to: - Within the same dataset:
Go to Plot Detail: Plot Properties: Spacing tab, set Subsize Size and Gap Between Subsets(%). - In different dataset:
Go to Plot Details: Plot Properties: Group tab, set Subgroup Size.
Use increment checkbox indicated to repeat increment list within each subgroup.
|