...
Open Plot Details for your 3D Scatter graph. On the Symbol tab, set Symbol Type to 2D, then select from 2D symbol shapes as in a 2D graph.

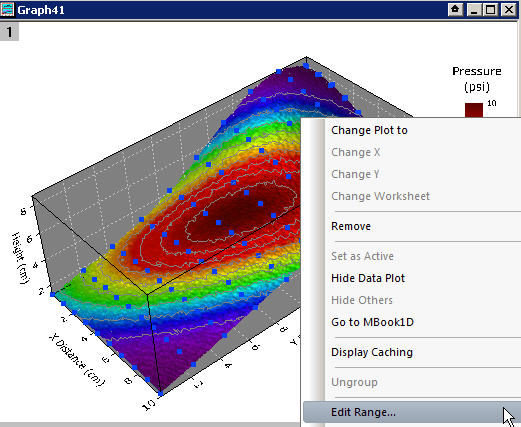
Link Contour Line Color to Colormap (ORG-4967)
Check Link Line to Colormap Color checkbox in Contour Lines dialog. Contour line color will follow colormap.

In the graph below, Fill color and Mesh lines are disabled.


...
Only supports editing row and column indices.


Column/Bar with Variable Width (ORG-4155)
On Spacing tab of Plot Details dialog, user can set which column to be used as column width. Also support Scaling Factor.

Akima and Modified Bezier Line Connect (ORG-3238)

Polar Contour from Matrix with r and therta as X and Y (ORG-8549)
3D Triangle Patch by Specified Data Index (ORG-8141)
...