Table of Contents
Text XY in Virtual Matrix
(ORG-8178)
Sample OPJ to download to try: Virtual Matrix with Text Labels.opj
X and Y labels from text are now supported when creating 3D and contour graphs such as 3D Bar from data arranged in worksheet and plotted as Virtual Matrix.

How to
The tick labels will used the text in virtual matrix automatically.
To plot the graph in OPJfrom Virtual Matrix.
E.g. the following data in worksheet are used as virtual matrix to plot 3D bars. X and Y axis tick labels are read from X and Y information from the worksheet.
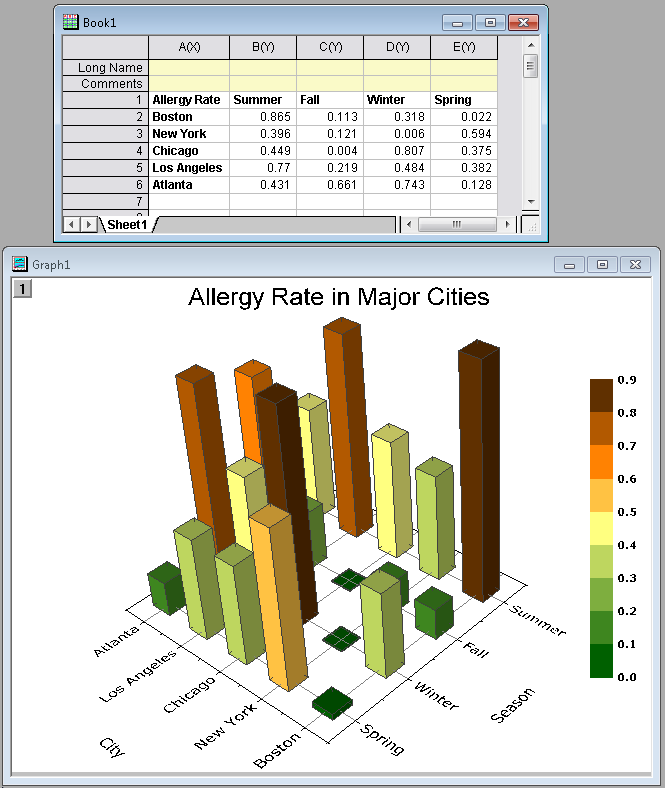
How to:
1. Highlight the whole worksheet, Book1, select "Plot: 3D Symbol/Bar/Vector: 3D Bars" from the Origin menu
2. In the plotvm dialog, accept the default setting, that is, Y Values in 1st row in selection, and X Values in 1st column in selection. Click Click OK button button to plot the graph
Subrange as Data Range
ORG-8285
range.sub(name/index) to get a subrange from a data range by either specifying a name or index.
| Code Block |
|---|
//For example, with a virtual matrix named as ztitle, you could use subrange to return a dataset for Y values as:
ztitle.sub(y);//by name
ztitle.sub(1); //by index
ztitle.sub(y)[3]=;
ztitle.sub(y)[3]$=;//return 3rd value in this dataset |
Improve the speed of plotting virtual matrix
ORG-8342