Origin 2020 Features
Analysis
Fitting
ID | JIRA | SUMMARY | Description | DETAILS |
|---|---|---|---|---|
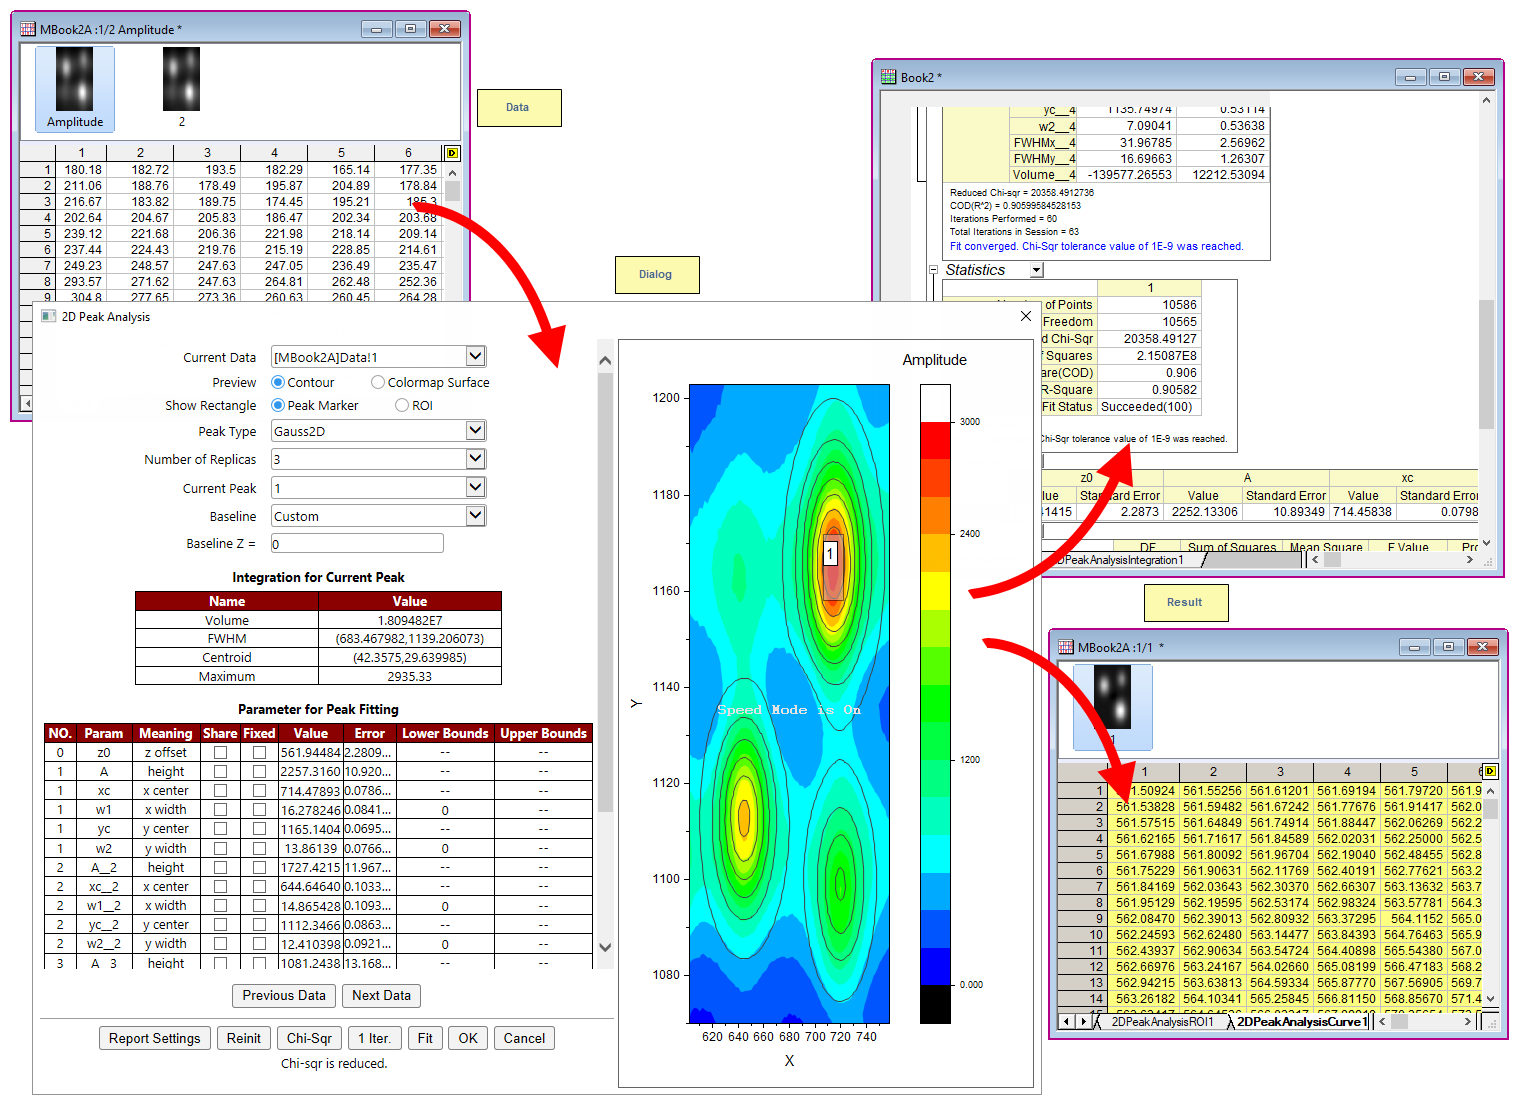
0 | 2D Peak Analysis | Perform 2d peak fitting and integration for each peak. | Download 2D Peak Analysis app from the page and install the app. This app can be used to perform 2d peak fitting, and integrate each peak fitted data.
| |
0 | Neural Network Fitting | Fit data with neural network. | Download Neural Network Fitting app from the page and install the app. This app can be used to fit data with neural network. It trains a neural network to map between a set of inputs and output. Features include:
|
Batch Processing
ID | JIRA | SUMMARY | Description | DETAILS |
|---|---|---|---|---|
0 | Batch Processing support Analysis Templates that having Data Connector | Batch Processing support Analysis Templates that having Data Connector | Origin support importing data by data connector since Origin2019b, therefore,batch processing also improve to support analysis template which source data is imported by data connector(such as CSV connector,Excel Connector,MATLAB Connector,etc). note:currently Data Connector will be supported only when Data Source is Import From Files. | |
0 | Combine all Word files into one file after batch processing | Add an option in batch processing dialog to combine all Word files into one file after batch processing | ||
0 | Support the "Open Books" button in summary report when appending results by column | Add Open Books button in summary report book after batch processing so that user can select the row and open corresponding intermediate workbook | Append by column will also support the "Open Books" button in summary report book like appending result by row when do batch processing, it will be convenient for user to check the intermediate workbook. |
General
ID | JIRA | SUMMARY | Description | DETAILS |
|---|---|---|---|---|
0 | Allow double clicking Axis to open Axis dialog in Peak Analysis Preview | In Peak Analysis preview with Peak Analyzer, axis dialog can be opened to adjust axis scale | This feature was turned off in some recent versions but user complains very hard to adjust axis scale. So we bring it back in Origin 2020. | |
0 | Change Parameters... context menu when right clicking anywhere in hierarchical result sheet | Change Parameters... context menu is added no matter where you click in the sheet. | In the past, user had to scroll up to the top of the hierarchical sheet and click the green lock to bring up the Change Parameters... context menu. In Origin 2020, Change Parameters... context menu is added no matter where you click in the sheet. | |
0 | Copy All Open Tables in hierarchical result sheet | Copy All Open Tables context menu is added when you right click the title of hierarchical result sheet | ||
0 | Data filter in analysis template will automatically trigger after importing data | Data filter will be auto triggered after importing data in analysis template | In Origin2020, data filter will be auto triggered after importing data, it will be very convenient when do batch analysis on analysis template which having data filter in source data sheet. you do not need add script to handle data filter anymore. Note:This support in batch process dialog only when Data Source is Import From Files . | |
0 | Simple Curve Math supports custom formula | Simple Curve Math supports custom formula, which enable flexible operation between two curves. | In the past, user could only do basic calculation between two curves by choosing +,-, , / and ^ in Operator dropdown list. Custom is added in Origin 2020 to define custom formula by using y1 as input data and y2 as reference data, e.g. y1*5-y2^2. Custom formula is also added in Simple Column Math tool. | |
0 | Speed improvements on recalculation | When there are many operations involves report sheet, recalculation if much more faster | Improvement was made on SetReportTree() method, which is used to generate a results worksheet. So when there are many operations involves report sheet, you will get at least 10% time saving on calculation. Besides, if there are many column formula operations, recalculation was done one by one in previous version and the time maybe a little long. But now in Origin 2020, you will see that all recalculation can be done in the same time and the calculation is very fast. |
Mathematics
ID | JIRA | SUMMARY | Description | DETAILS |
|---|---|---|---|---|
0 | Better level crossing result for large duration points | Improve level crossing tool to support large duration points | ||
0 | Improvements in Normalization tool | When normalizing multiple datasets, can combine them as a single dataset to normalize. | When normalizing multiple datasets, can combine them as a single dataset to normalize. |
Peak Analysis
ID | JIRA | SUMMARY | Description | DETAILS |
|---|---|---|---|---|
0 | Context menu on analysis lock to include hidden rows in analysis | Provide options to ignore hidden rows or not on context menu of analysis lock | By default when there is filter in column and it's input for an analysis, hidden rows will be ignored. But user can click the analysis lock and choose Ignore Hidden Rows: No to include hidden rows in analysis. Auto means follow the setting in Worksheet Properties → Miscellaneous tab. | |
0 | Speed improvements on Quick Peak tool | Speed of Quick Peak Gadget is improved for large data | For large data, it was very slow to use Quick Peak gadget in previous versions.
Note:
Besides, pkFind tool is also improved, 7 times faster on calculation. |
Statistics
ID | JIRA | SUMMARY | Description | DETAILS |
|---|---|---|---|---|
0 | Allow ANOVA 'Number of Levels' to be > 10 | Number of Levels dropbox for Raw data mode of ANOVA tools is increased to 25 | In Origin 2020, Allow ANOVA 'Number of Levels' to 25. | |
0 | Improve box plot in One-Way ANOVA | Box charts generated in ANOVA tools are plotted with grouped box chart |
| |
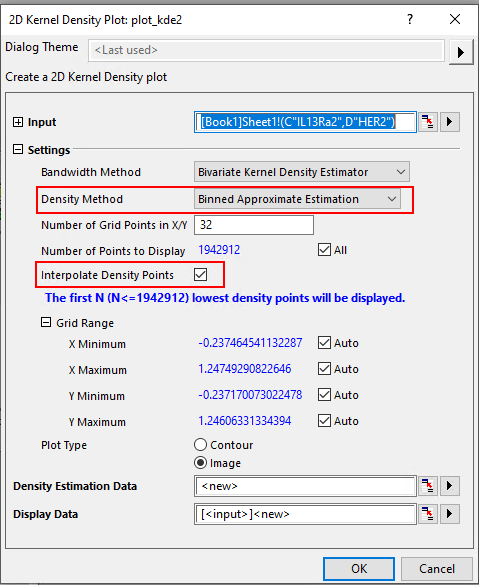
0 | Kernel Density Calculation: New (fast) algorithm | Faster 2D Kernel Density plotting for large datasets | For large datasets to plot 2D Kernel Density, earlier Origin versions take several hours or more. Origin 2020 introduces new Density Method: Binned Approximate Estimation and adds an new option: Interpolate Density Points to improve speed greatly, which takes only several seconds. A New Labtalk function is supported as below: ks2d(vx,vy[, int bandwidth=0, int grid=151, int interp=1, int density=1]) | |
0 | Set Cluster Membership column as Categorical and Ascending type | K-Means Cluster Analysis and Hierarchical Cluster Analysis, Cluster Membership column keeps the order of the original data and is set as Categorical and Ascending type. | In Origin 2019b, K-Means Cluster Analysis and Hierarchical Cluster Analysis, Cluster Membership column was already sorted and without link to the order of the original data. In Origin 2020, K-Means Cluster Analysis and Hierarchical Cluster Analysis, Cluster Membership column keeps the order of the original data and is set as Categorical and Ascending type. | |
0 | Speed improvements on Means Comparison in ANOVA tool | Improved the calculating speed of Means Comparison, and it will be 30% faster than Origin 2019b. | Improved the calculating speed of Means Comparison, and it will be 30% faster than Origin 2019b. Besides, if choose not output the Means Comparison result, previous version will still do the calculation in background and waste time. Now this is fixed in Origin 2020, and will be 83 times faster than Origin 2019b. |
Image Processing
ID | JIRA | SUMMARY | Description | DETAILS |
|---|---|---|---|---|
0 | Video Data Explorer | Explore video and related measurement data. | Download Video Data Explorer app from the page and install the app. This app can be used to explore a video and related measurement data.
|
Data Handling
ASCII Importing
ID | JIRA | SUMMARY | Description | DETAILS |
|---|---|---|---|---|
0 | Multi-threaded ASCII import | Add two system variables for Multi-threaded ASCII import. | The following system variables are added:@IAMT=<auto> /// number of additional threads to use when import, will be auto detected by logical processors. Set to 0 to disable multi-threading. @IAS=10 /// least file size (in Megabytes) to enable multi-threading. |
Database Import
ID | JIRA | SUMMARY | Description | DETAILS |
|---|---|---|---|---|
0 | Enhanced Database Import | Database Import images stored inside the database as pictures in worksheet cells. |
In previous versions, import database by ODBC is slower than ADO, and cannot import large dataset. Now this has been improved in Origin 2020. Setting @ODBCA = 0 (Default), then you should be able to import large dataset now. Also, the performance of ODBC should be faster than ADO method now. Also, when importing using Microsoft OLE DB Provider for ODBC for database connection, Origin will use ODBC by default now. It used to use ADO by default even for ODBC. | |
0 | Option to encrypt or leave database credentials in clear text | In SQL Editor dialog, supply option to encrypt or leave database credentials in clear text | When SQL Editor dialog launches, the user is prompted to encrypt their credentials. If the user choose not to, the password is displayed in clear text in the Edit Connection String... dialog. However, it still appears as *** other places in Origin. If credentials are encrypted the password appears as *** everywhere. Note: This is has late breaking issues which will be addressed. | |
0 | Origin Connector to allow basic SQL selection and Improve Origin Internal Query SQL Support | Following object notations are supported in internal query SQL. New worksheet command to output SQL query result to workbook. |
|
Import Data
ID | JIRA | SUMMARY | Description | DETAILS |
|---|---|---|---|---|
0 | Data Connector Exclude saving only for larger files | Added system variables @DNS, @FSE, @FSEW and @FSEB to control if check Exclude Imported When Saving menu item for Data Connector and Database.Data Connector | Added system variables @DNS, @FSE, @FSEW and @FSEB to control if check Exclude Imported When Saving menu item for Data Connector and Database.
| |
0 | Drag and Drop support of Data Connector | When dragging and dropping data into Origin, inform user there is data connector and let user specify using data connector or old import way to import data. | When dragging and dropping data into Origin, inform user there is data connector and let user specify using data connector or old import way to import data. | |
0 | Filter will be triggered automatically when importing data | After importing new data, Filter will be triggered automatically. | In the past, after importing new data, user needs to manually reapply filter. | |
0 | System variable to control the protection mode of imported range | System variable @IPDC to control the protection mode of imported range | @IPDC(Data Connector) to control the protection mode for imported range.
|
Importing Third Party Formats
ID | JIRA | SUMMARY | Description | DETAILS |
|---|---|---|---|---|
0 | CSV Connector Improvements | CSV Connector supports Import first 50 lines as preview, Partial Import and Data Block Marker options. | E.g. sometimes data block starts or end with some keywords, e.g. [Data] or >>>>Start<<<<<<, etc. User can specify the start and end data block marker. In the past, user needed to specify number of rows before data. | |
0 | CSV connector needs to support ISO time with GMT | CSV Connector supports auto detect ISO time with GMT. | CSV Connector supports auto detect ISO time with GMT(for exmple: 2014-08-04T14:32:27.000+02:00) and set Column Format as yyyy'-'MM'-'dd HH':'mm':'ss'.'###. | |
0 | Specify Long name, Units and Comments in Excel Connector | Excel Connector supports to specify Long name, Units and Comments. | ||
| 0 | Connect to tables and images in Word document. | Connect to tables and images in Word document | Connect to tables and images in Word document.This App connects the Origin project to a Word document in docx format. | |
| 0 | Import NMR data in different formats. | Import NMR data in different formats | This App imports NMR data in different formats, including FID data and processed data. | |
| 0 | Connect to a LeCroy trace data file. | Connect to a LeCroy trace data file | This App connects the Origin project to LeCoy waveforms (*.trc). |
Origin Project Files
ID | JIRA | SUMMARY | Description | DETAILS |
|---|---|---|---|---|
0 | Many Windows in Folder slow to load and switching folders | For project file with many windows in folder, loading the project or switching folders in Project Explorer is very slow. | For project file with many windows in folder, loading the project or switching folders in Project Explorer is very slow. System variable @PEN is introduced. It controls how many windows show at maximum when switching folders. Default is 0, which means no auto hiding. Set it to 20, then when loading opju or switching folders, only up to 20 window shows. Others are hidden. Right click the folder and choose Show All Windows to make them show. | |
0 | Turn off the Autosave of Untitled.opju | When you are working in Origin and haven't saved the project yet, it's called Untitled.opju. | When you are working in Origin and haven't saved the project yet, it's called Untitled.opju.
|
Set Column Values / Cell Formula
ID | JIRA | SUMMARY | Description | DETAILS |
|---|---|---|---|---|
0 | Clear <auto> in From and To box when clicking on it in Set Column Values dialog | In Set Column Values dialog, user can directly key in From or To values. | So user can directly key in From or To values. |
Workbook and Worksheet
ID | JIRA | SUMMARY | Description | DETAILS |
|---|---|---|---|---|
0 | Copy and paste density plot | Support copy and paste density plot. And support add another layer like double-Y kind to overlay another layer with or without data |
| |
0 | Add View: Arrange Graphs menu item for Worksheet | Add View: Arrange Graphs menu item for Worksheet | When worksheet contains floating graphs, user can choose menu View: Arrange Graphs to place in top left corner of data area. This is useful if floating graphs are invisible or beyond the worksheet window. | |
0 | Copy and paste data as as HTML table to other applications such as MS Word, etc. | Copy a block of cells from worksheet or a table from a report sheet and choose Copy Table (HTML, EMF). | Copy a block of cells from worksheet or a table from a report sheet and choose Copy Table (HTML, EMF). and paste to Word or other application either as an HTML table or an EMF image. If the destination App supports editing the pasted HTML or EMF, table design and contents may be changed. EMF is useful for Adobe Illustrator which doesn't support pasting HTML. . | |
0 | Copy display string for hierarchical report table | Improve Ctrl + C to follow the Digits setting in Preferences: Options dialog when copy values in hierarchical report sheet. | Improve Ctrl + C to follow the Digits setting in Preferences: Options dialog when copy values in hierarchical report sheet. User can still user Ctrl + Alt + C to copy full precision. | |
0 | Duplicate Project or Workbook without data keeps cell reference or cell formula | Support to create a new book/sheet with same strucuture and cell formula as original one. | In the past, if there is cell formula and user right click workbook title bar to duplicate without data, or right click sheet tab and choose Duplicate Without Data, cell formula will be cleared. Improved in Origin 2020 so user can easily create a new book/sheet with same strucuture and cell formula as original one. In File: Clone Project... dialog, Clean Raw Data (Exclude Cell Link) radio button is added. | |
0 | Excel like cell reference in cell formula | Excel like cell reference in cell formula. | ||
0 | Faster cursor response when clicking in a large worksheet with column filter | For large data, faster cursor response when data manipulation in worksheet with column filter. | For large data, after adding filter in worksheet, it was very slow to do data manipulation in worksheet, such as select/unselect cell(s) or column(s) move or resize window. | |
0 | Object Manager for workbook window | Add object Manager for workbook window. It lists all sheets in active workbook. And support common operations for the selected sheet. |
| |
0 | Set a column with checkbox, dropdown list or combo list | Set a column with checkbox, dropdown list or combo list. | wks.col2.edit= | |
0 | Sheet level context menu improvements | The quickest way to open Worksheet Properties dialog is by double clicking gray area to the right of column area. | The quickest way to open Worksheet Properties dialog is by double clicking gray area to the right of column area. But for worksheet with many columns, it's hard. And using Format: Worksheet... isn't that convenient. So in Origin 2020, we added Properties... context menu when right clicking sheet tab or right clicking the upper-left corner of worksheet. The context menu on upper-left corner of worksheet is also more compact now. Some old menus are removed from there. | |
0 | Show Column Index and data size in Column List View | Show Column Index and data size in Column List View | ||
0 | Support copy a data range with column label rows | Support copy a data range with column label rows | ||
0 | Unhide all hidden rows or columns Context menu | Unhide all hidden rows or columns Context menu | Unhide All context menus are added under Hide/UnHide Rows and Hide/Unhide Columns context menus. | |
0 | User Tree at Sheet Level | Right-click on any sheet and bring up Worksheet Properties (or double click in gray area of active sheet). There is now a User Tree tab, and user can add and view sheet level entries. | Right-click on any sheet and bring up Worksheet Properties (or double click in gray area of active sheet). There is now a User Tree tab, and user can add and view sheet level entries. | |
0 | View: Show Plot Selection in Workbook menu when graph window is active | View: Show Plot Selection in Workbook menu when graph window is active | It's checked by default so selecting a single plot will highlight corresponding data in other windows, such as worksheet and other graph windows. Uncheck it if user doesn't want to highlight data in other windows. Corresponding system variable @PS=1 by default. | |
0 | Worksheet Short Name, Long Name improvements | In 2020, the context menu is hidden. A system variable @SSL is added to control sheet display name |
In 2020, the context menu is hidden. A system variable @SSL is added to control sheet display name 0 – The way before Origin 2020 1 – Long name if present (default) 2 – Short Name 3 – Long Name Sheet Name to Display context menu is hidden unless system variable @SSL is set back to 0
|
Worksheet Data Manipulation
ID | JIRA | SUMMARY | Description | DETAILS |
|---|---|---|---|---|
0 | Improve Sum function to support rowwise sum | Improve Sum function to support rowwise sum | E.g. sum(A:D) to sum rowwise from column A to D. Sum(A, C:D, F:H) to sum rowwise columns A, C to D and F to H. | |
0 | Worksheet manipulation: Speed Improvement. | Worksheet manipulation: Speed Improvement. | Origin 2020 Worksheet Data Exaction is 10 times faster than Origin 2019b. Origin 2020 Split Worksheet has 208% speed improvement from Origin 2019b. Origin 2020 Split Columns has 14% speed improvement from Origin 2019b. Origin 2020 Worksheet transpose has 24% speed improvement from Origin 2019b. Origin 2020 Worksheet Convert to XYZ has 60% speed improvement from Origin 2019b. Origin 2020 Worksheet Unstack Data has 24% speed improvement from Origin 2019b. |
Graphing
3D Graphs
ID | JIRA | SUMMARY | Description | DETAILS |
|---|---|---|---|---|
0 | 3D XYY Stacked Bar/Wall Plot | 3D XYY Stacked Bar/Wall Plot | Support Incremental stack for 3D plot. For 3d XYY Bar, stack offset means offset in Y direction. | |
0 | Edit Range by X, Y and Z value in 3D graph | Edit Range by X, Y and Z value in 3D graph |
|
Axes
ID | JIRA | SUMMARY | Description | DETAILS |
|---|---|---|---|---|
0 | Axis Tick label: Show zero as 0, no decimal places | Axis Tick label: Show zero as 0, no decimal places | Set @tlc=1 to show zero as 0, no decimal places. Default @tlc=0 so zero isn't treated differently. | |
0 | link axes in child layer to parent with same from to should update scale mutually | link axes in child layer to parent with same from to should update scale mutually |
In Origin2020, child layer change could also affect parent layer. | |
0 | Reduce graph refresh when modify axis properties | Reduce graph refresh when modify axis properties | Origin refreshed the whole graph when customing axis ticks, tick labels, title, color scale object, etc. in old versions, which could be very slow for large graph. This is improved in Origin 2020 to reduce some unnecessary refreshing of graph. | |
0 | Reverse Axis for Polar Radial Axis | Reverse Axis for Polar Radial Axis | Polar radial axis support to reverse. |
Box Chart
ID | JIRA | SUMMARY | Description | DETAILS |
|---|---|---|---|---|
0 | Allow show Median Line when there is no box | Allow show Median Line when there is no box | Support show median line if there is no box as Box Type | |
0 | Highlight corresponding data when selecting a single Box Plot | Highlight corresponding data when selecting a single Box Plot | In Origin 2019b, highlighting corresponding worksheet data only worked for basic graphs such as line, scatter, column/bar.. | |
0 | Offset data points in box chart and alternating the offset in pairs | Offset data points in box chart and alternating the offset in pairs |
Contour
ID | JIRA | SUMMARY | Description | DETAILS |
|---|---|---|---|---|
0 | Faster contour plot drawing speed | Improved Contour plot drawing speed for large dataset, especially when some level's fill colors are set to be none. | Improved Contour plot drawing speed for large dataset, especially when some level's fill colors are set to be none. E.g. for 130,000 row of XYZ data, if you plot contour and turn the speed mode off. It may take a few minutes. In Origin 2020, it will be a few seconds. | |
0 | Improved tooltip for Contour, and Heatmap graphs | Improved tooltip for Contour, and Heatmap graphs | For contour, X, Y and Z values will show. For contour, interpolation will be used. |
Customizing Color
ID | JIRA | SUMMARY | Description | DETAILS |
|---|---|---|---|---|
0 | Color Scale Improvements | Color Scale Improvements, such as Color Scale support specified range | ||
0 | Support density color mapping | Support density color mapping | By points:Density color mapping. Do not support 3D symbol for now. |
Data Label
ID | JIRA | SUMMARY | Description | DETAILS |
|---|---|---|---|---|
0 | Allow edit data label format for group plot | Allow edit data label format for group plot | Allow edit data label format for group plot when edit mode=dependent | |
0 | More Data Label Position Control for Polar | More Data Label Position Control for Polar | We support following options for Position and Rotate for data label in polar coordinate:
|
Drawing Objects
ID | JIRA | SUMMARY | Description | DETAILS |
|---|---|---|---|---|
0 | Auto Fill color for Error Bar | Auto Fill color for Error Bar | Add en option for Error bar for fill. When it's enable, error bar will show as lighter version of line color. | |
0 | Improvements on Rectangle box for Enlarged graph | Improvements on Rectangle box for Enlarged graph | When the name of rectangle object is ZOOMRECT, 1. open Object Properties dialog should go to Dimensions tab by default. 2. Unit should be Scale by default. For Rectangle/Circle/Polygon/Polyline/rake object, Add Update Dimensions to context menu of Zoom ROI, above Properties. Click it could get the scale info of related enlarged graph. | |
0 | Supersubscript button and Align Columns checkbox in Text Object Properties dialog | Supersubscript button and Align Columns checkbox in Text Object Properties dialog | ||
0 | Support deleting rectangle box in enlarged graph | Support deleting rectangle box in enlarged graph | Before this change, if user clicks Scale in button, and then single clicks in graph window to create an independent enlarged graph with a rectangle box in source graph, it was very hard to delete the rectangle box. User had to choose Edit: Edit Mode and then delete it. Now user can select the rectangle object and press Delete key to delete it together with the enlarged graph. |
General
ID | JIRA | SUMMARY | Description | DETAILS |
|---|---|---|---|---|
0 | Compact Popup for Font and Line Format | Compact Popup for Font and Line Format in Plot Details | Font and some Line format controls are combined to make Plot Details dialog more compact. E.g. Font control are combined into one with down arrow at the end to customize further. Box Chart Line and Connect Lines control are also combined. | |
0 | Customizable Floating Toolbar for graphs | Customizable Floating Toolbar for graphs | Install the GToolbar.opx and WToolbar.opx, customized different Graph/Worksheet Toolbar respectively, hotkey F6 to open the Toolbar locates at current cursor, F6 again or switch to other window to hide it. | |
0 | Data Highlight speed improvements for large data | Data Highlight speed improvements for large data | If user has a large scatter plot with many points and use data highlight tool to highlight a region, it was very slow in the past. E.g. plot a scatter graph with 2million points. Turn off speed mode. Highlight a region with >28k points. It takes about 5 sec in Origin 2020 vs 100 sec. in Origin 2019b. | |
0 | Dense Data Mode | Improve graph customization by turn on the dense data mode | Improve graph customization by turn on the dense data mode. After customization done, user can refresh graph to update image. It's on Page level mini toolbar. Click close to border of white page to see the page mini toolbar | |
0 | Do not select point if user click again exceed certain time frame | Do not select point if user click again exceed certain time frame | After user selects a plot, only if clicks again in a very small time 2 sec, then select a single point. | |
0 | Easy way to plot selected YX columns | Easy way to plot selected YX columns | Sometimes user's X column is on the right side of Y, if user selects Y and right X columns, Y will be plotted against the right X. System variable @DXR=1 to turn it off | |
0 | Improve Plot Highlight effect to work better with Customization | Improve Plot Highlight effect to work better with Customization |
| |
0 | Indicate the selected graph in preview of Merge Graphs dialog | Indicate the selected graph in preview of Merge Graphs dialog | ||
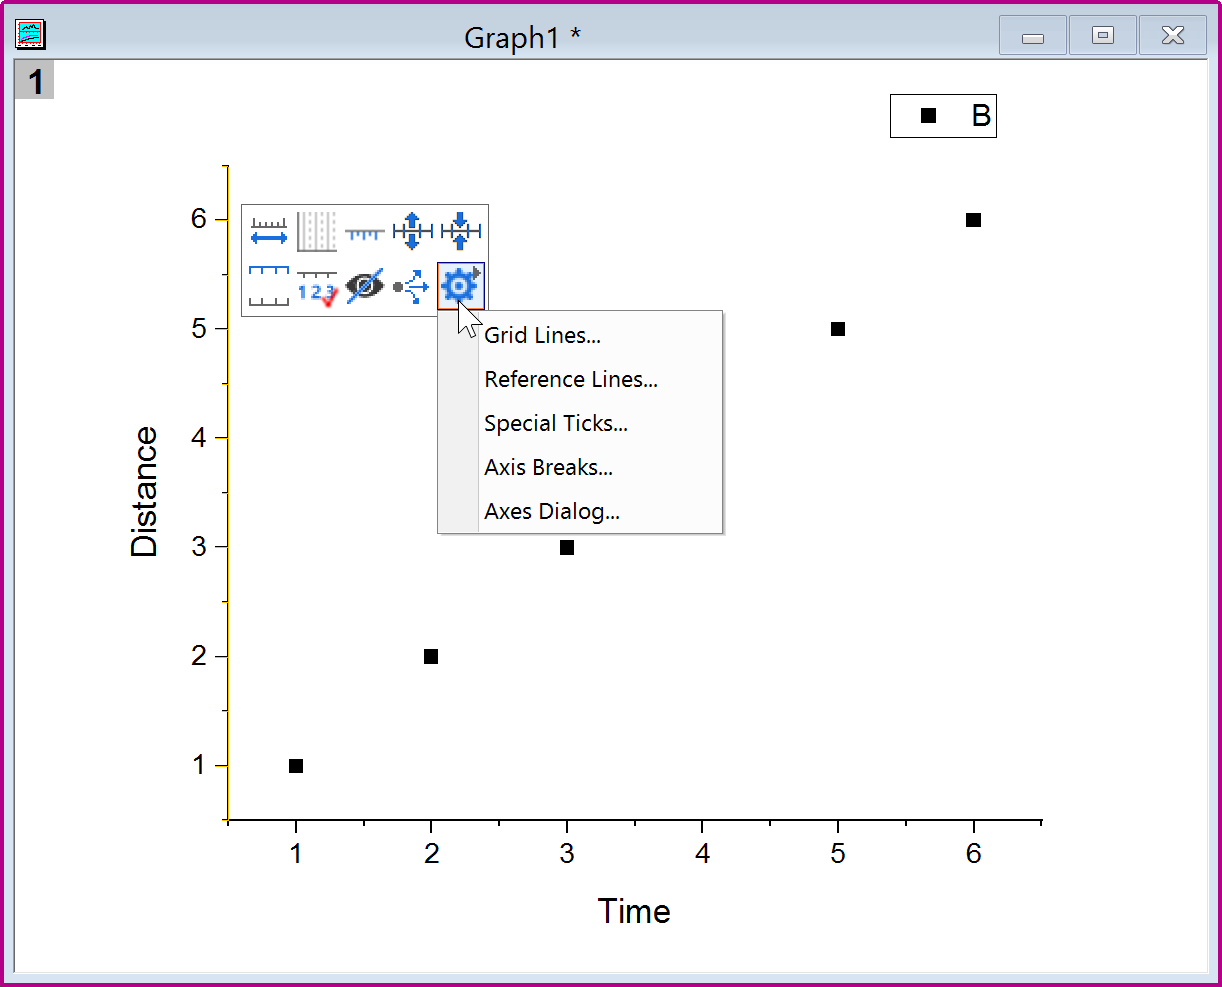
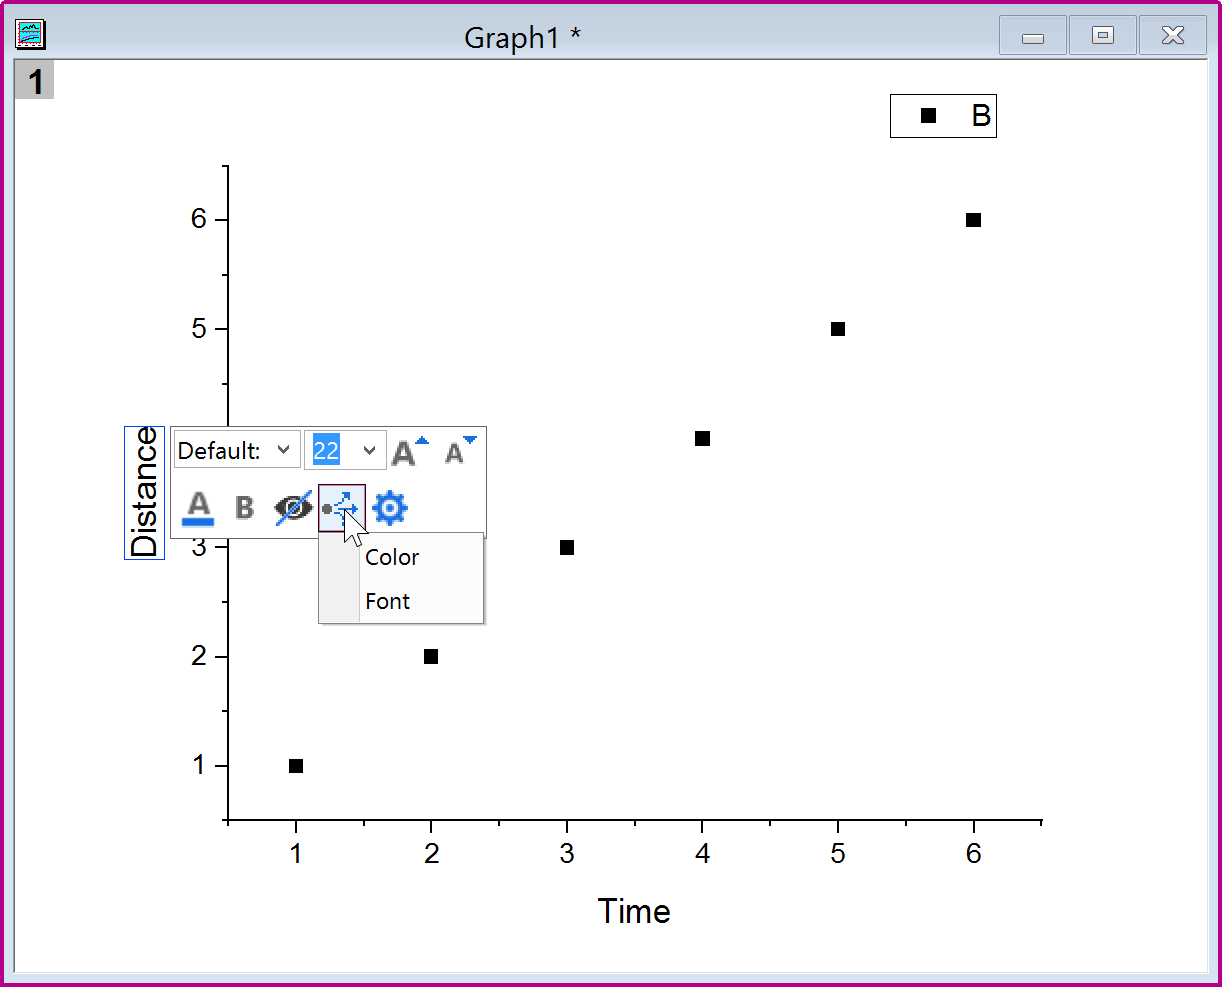
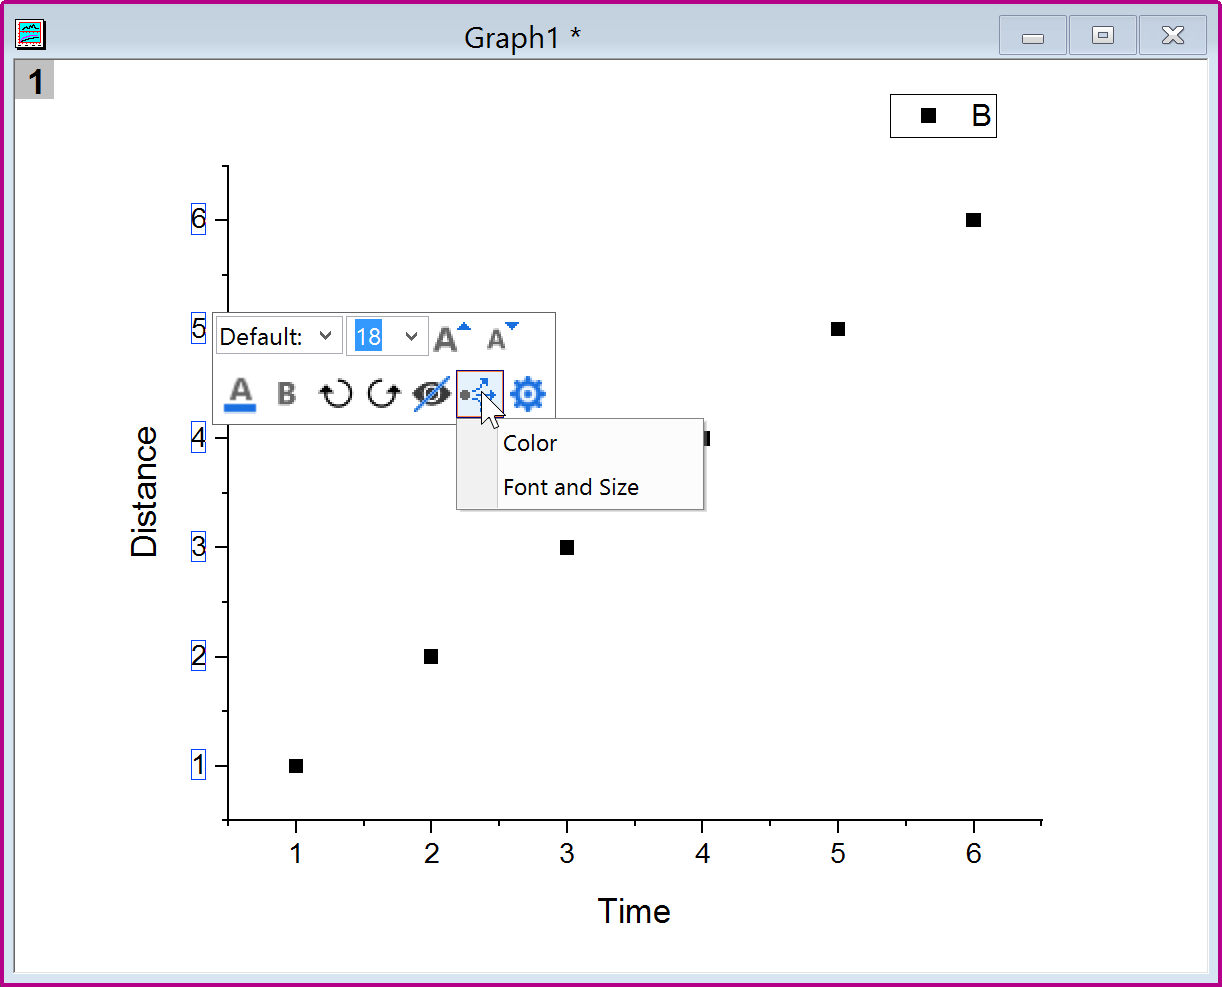
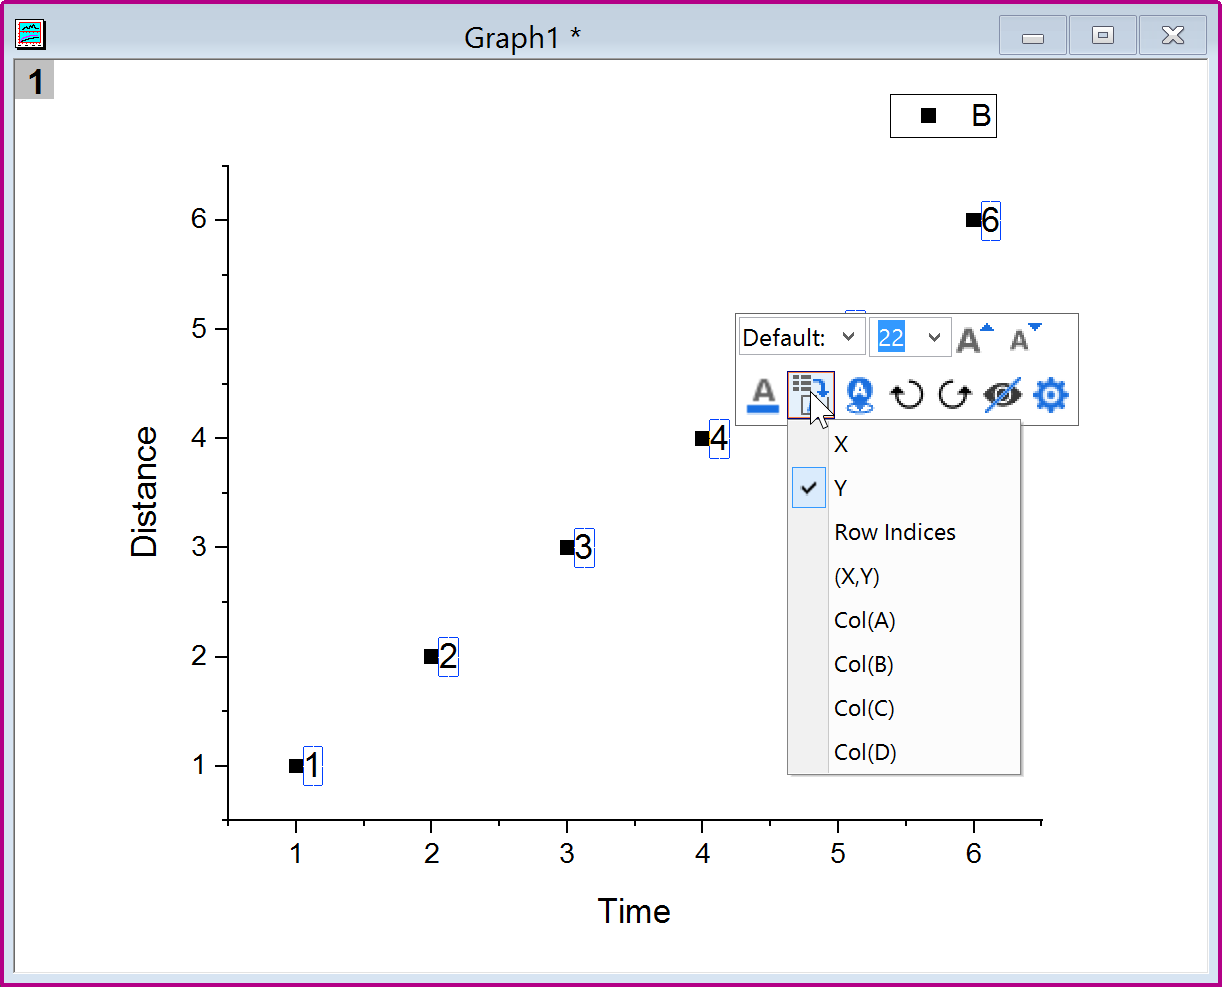
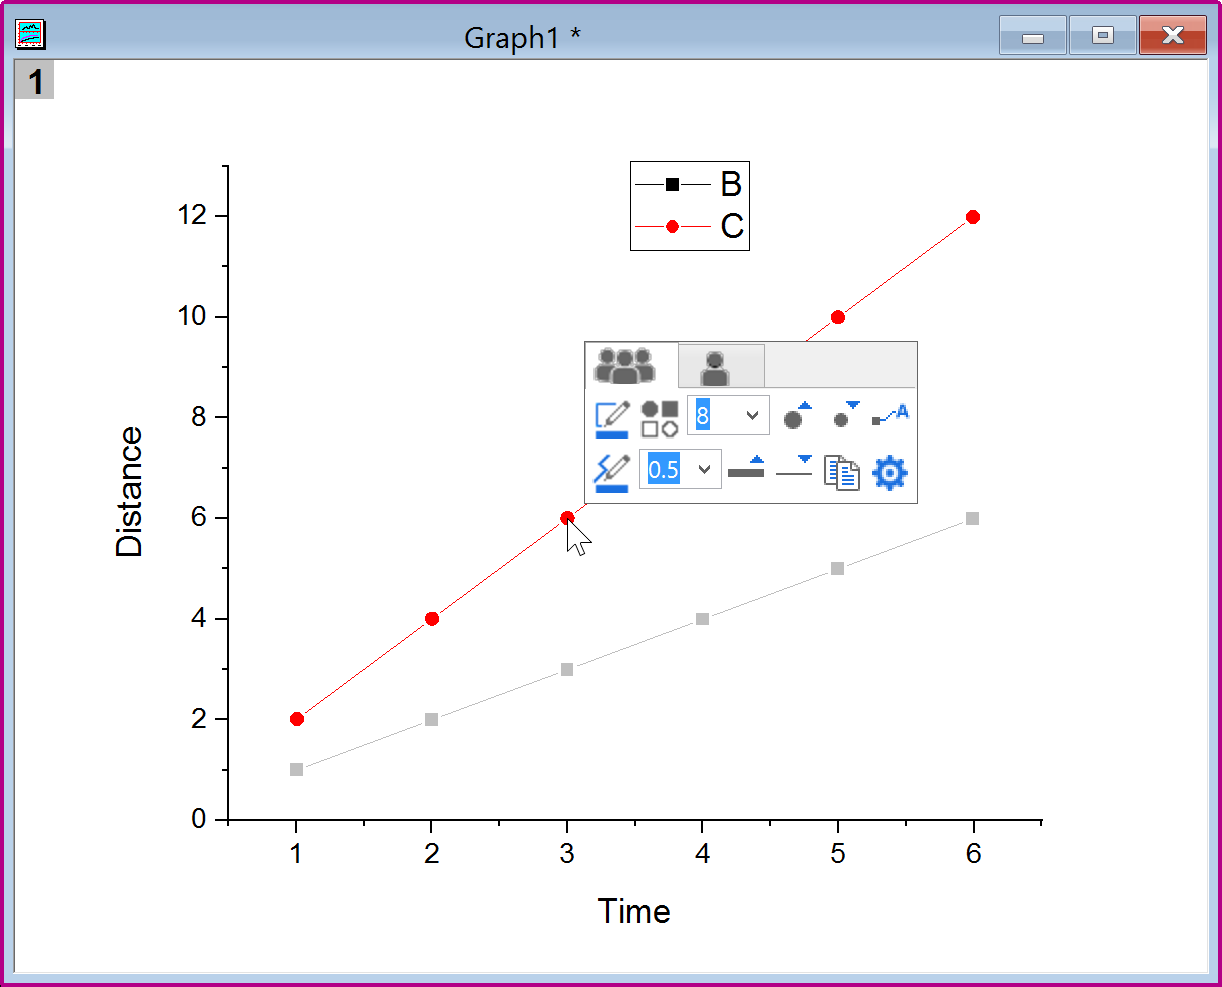
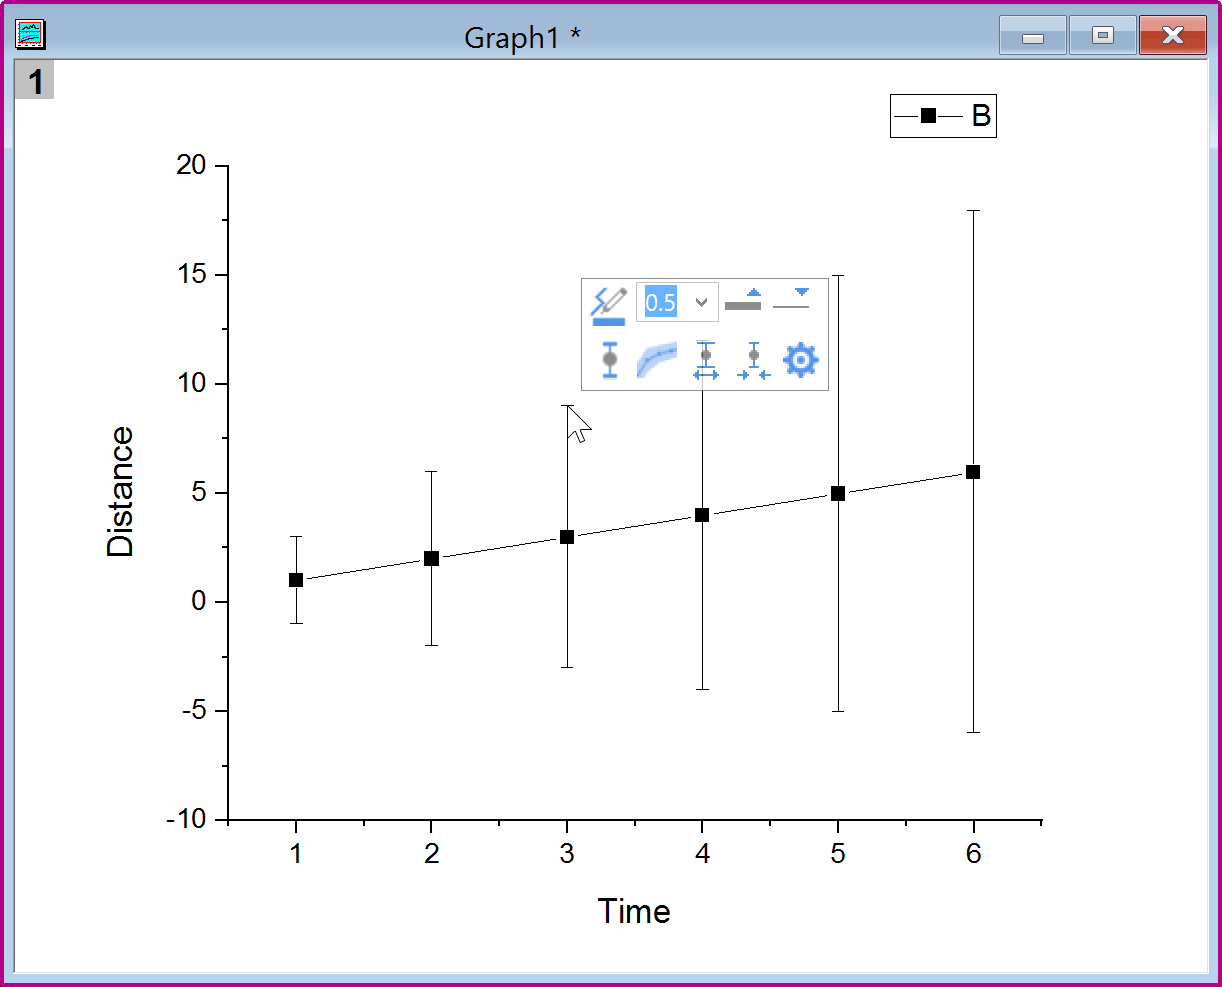
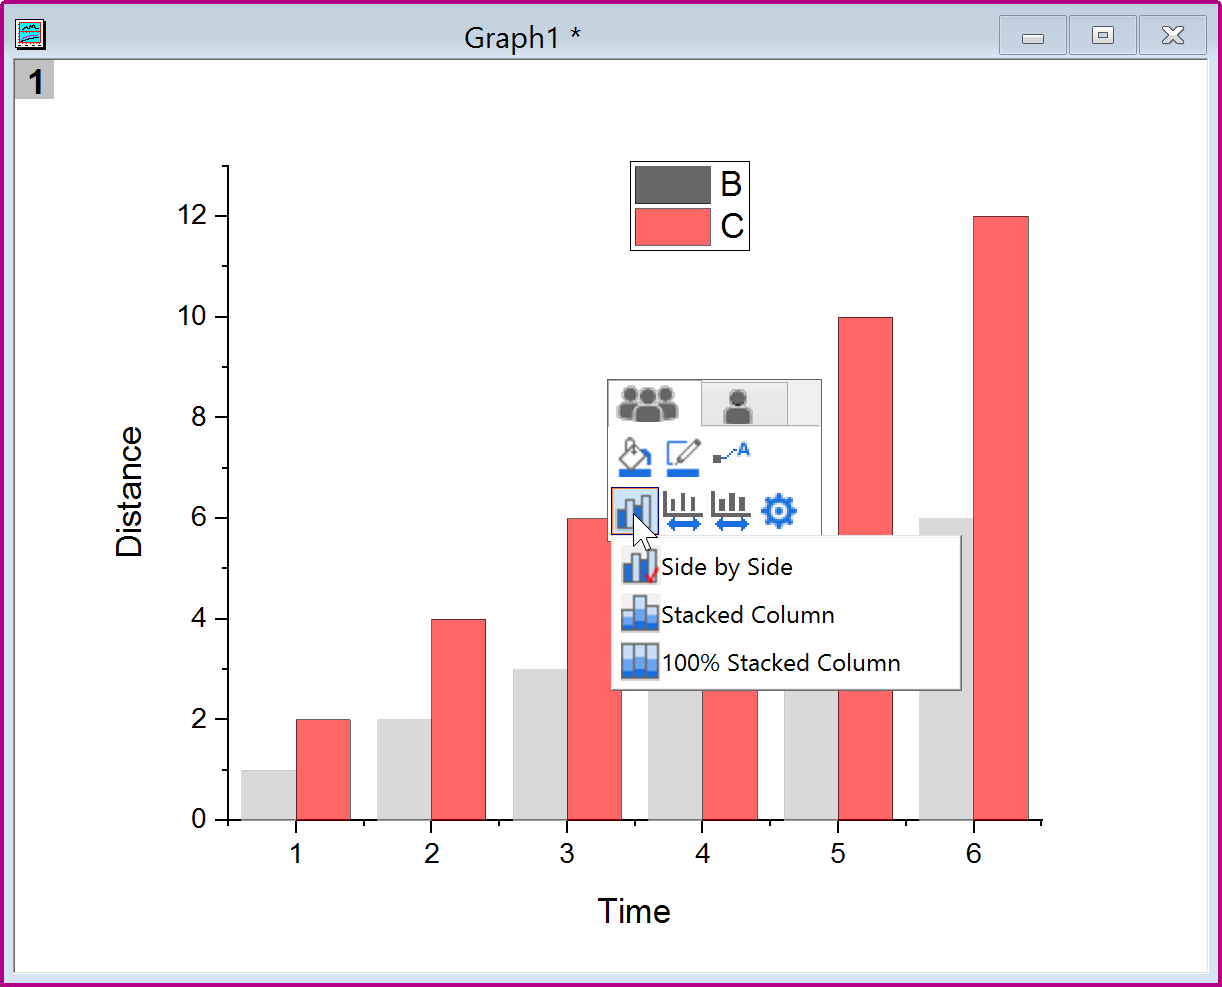
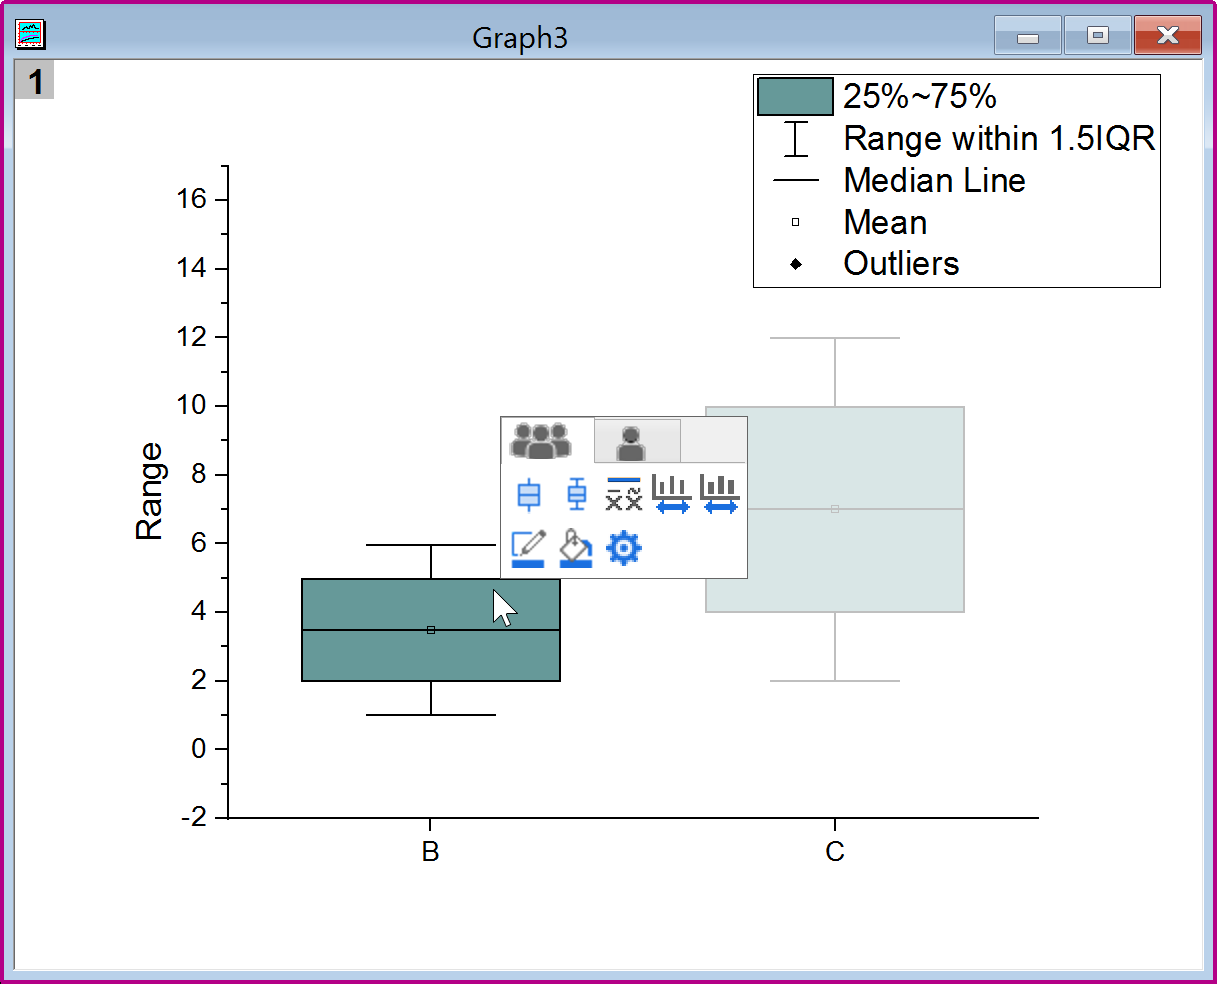
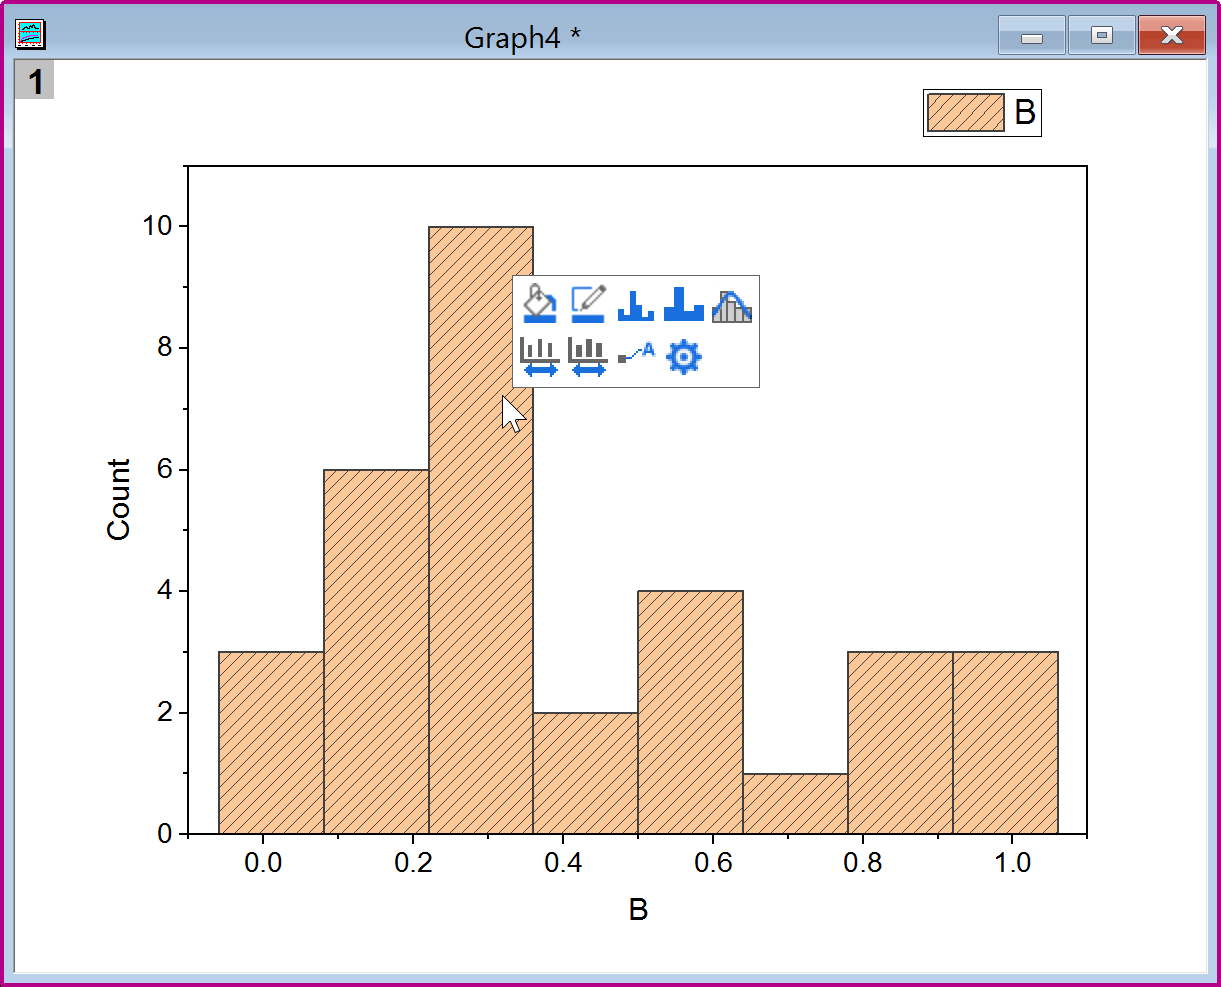
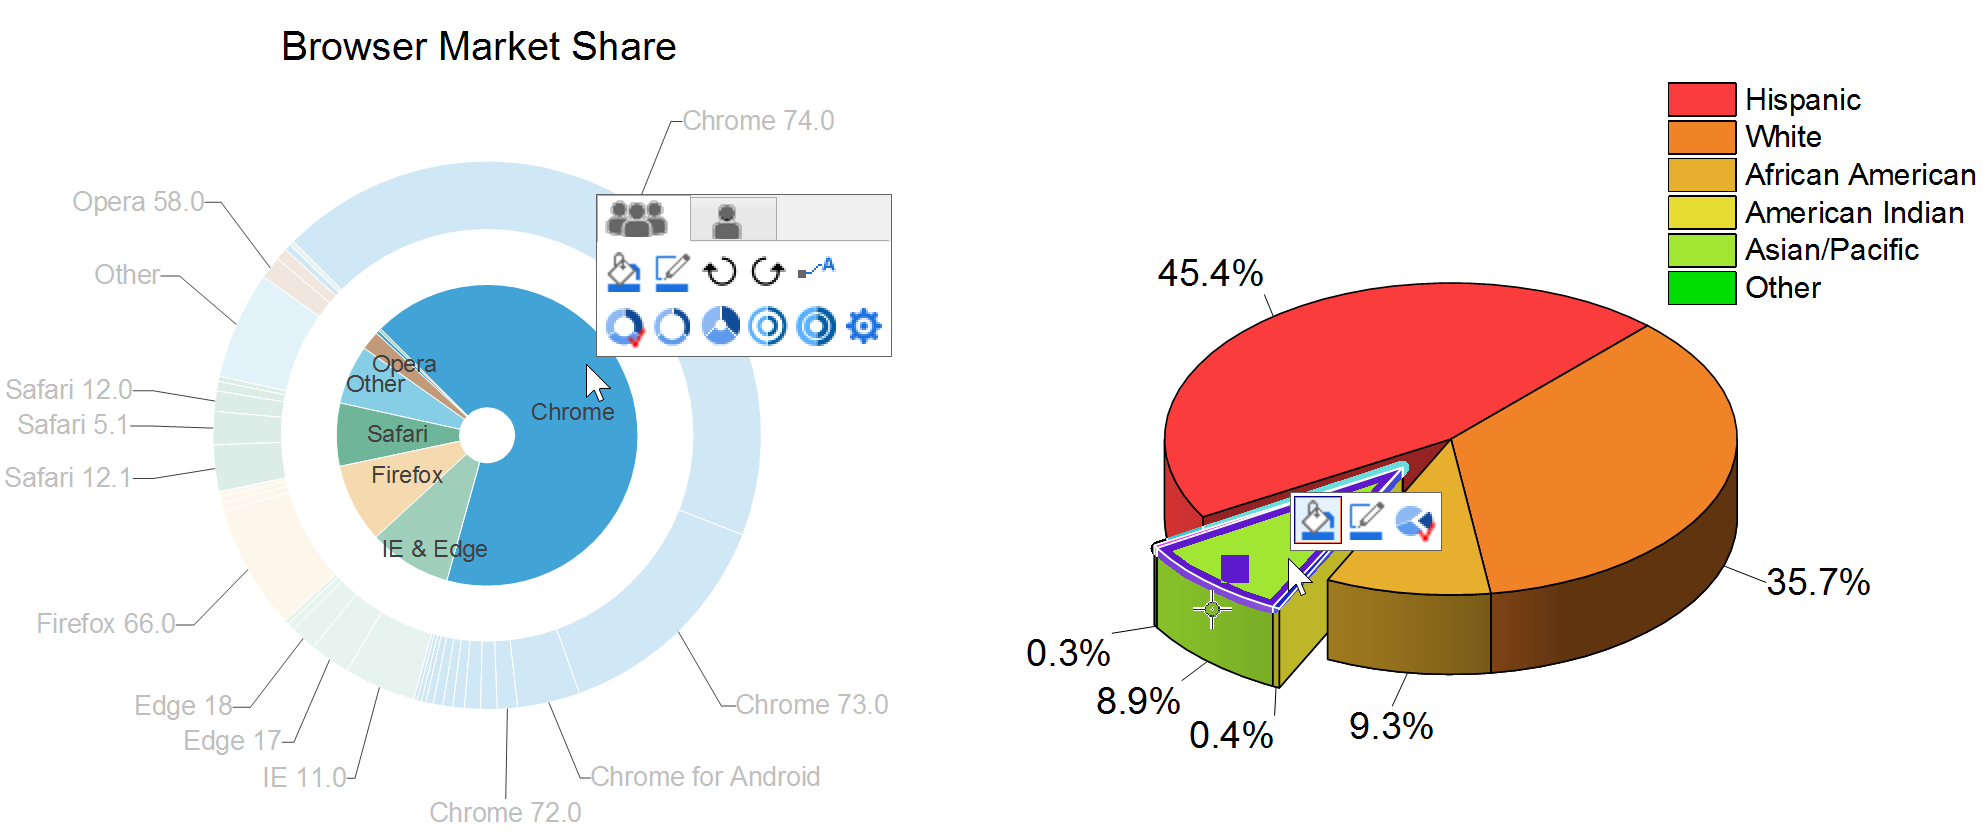
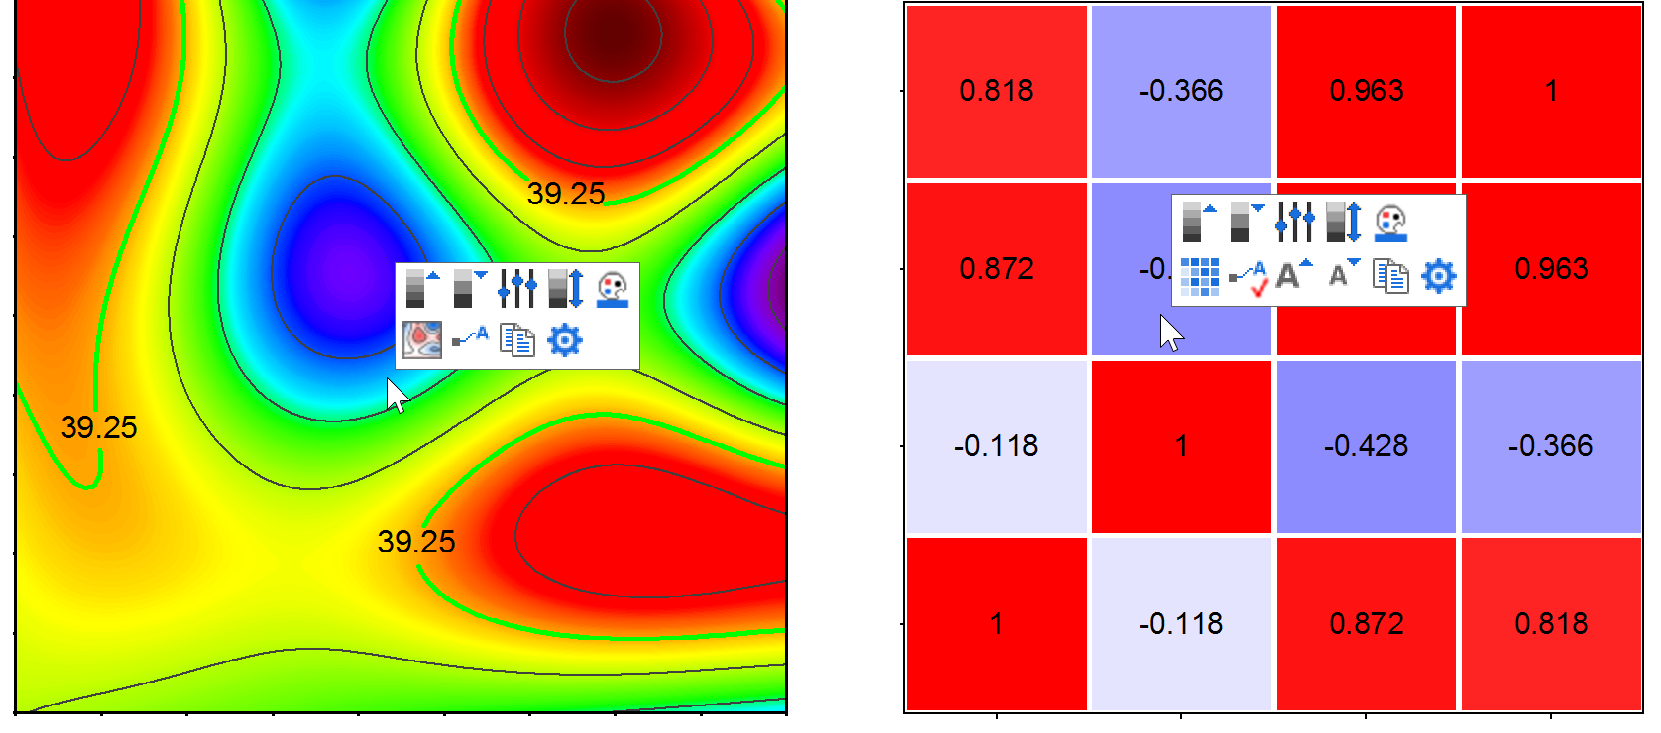
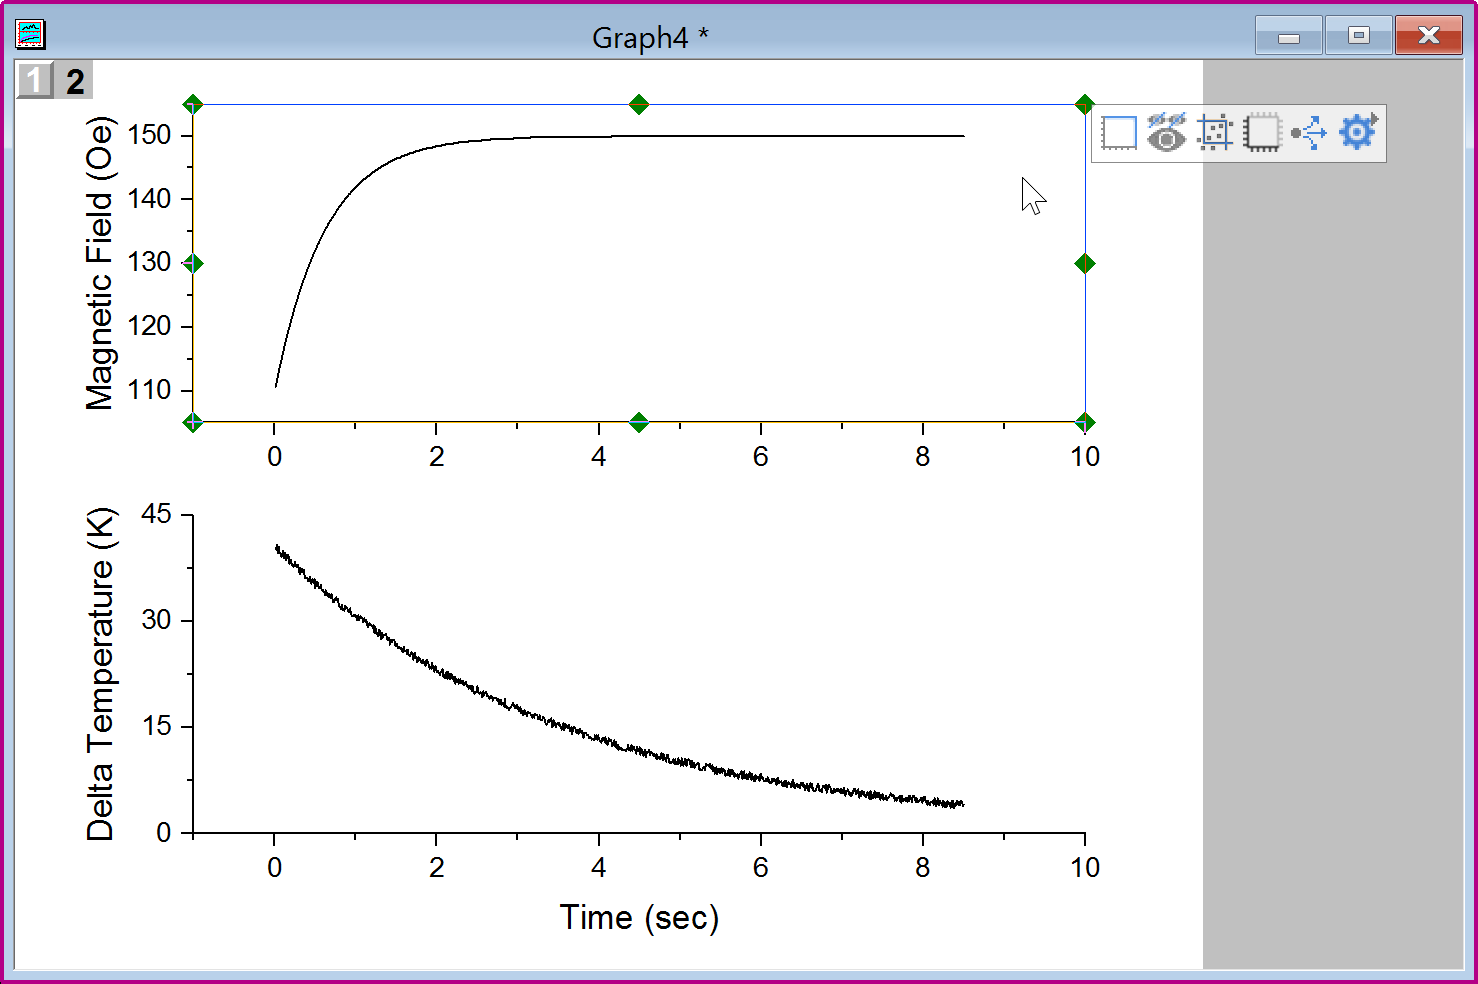
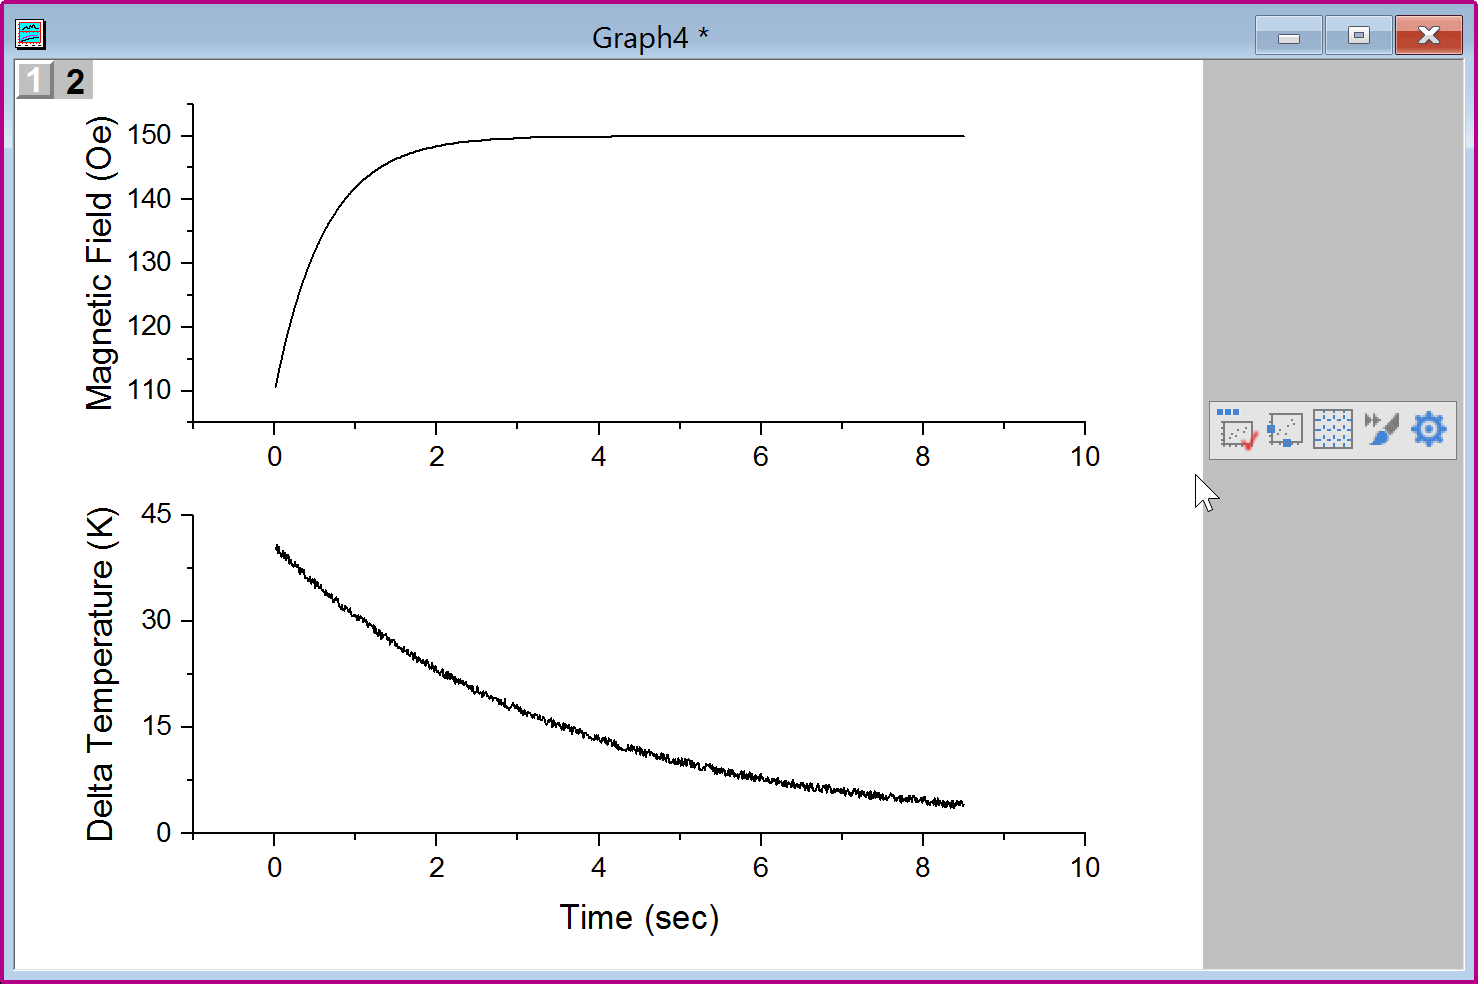
0 | Mini toolbars for easier 2D graph customization | Mini toolbars for easier 2D graph customization | Popup buttons when clicking on plot, axis, label, layer or page for easier customization. Note: For a group of plots, 1st click will select a single plot. The popup shows two tabs. One is Group tab to customize the whole group. The other tab is Single plot to customize that plot only. You can Shift+click to select group of plots.
| |
0 | More work on Clip Data to Frame for edge points | More work on Clip Data to Frame for edge points | Do not draw point when its value is outside axis scale in Origin2020. | |
0 | Single click in graph is changed to select a single plot for grouped plots | Single click in graph is changed to select a single plot for grouped plots | When multiple data are plotted together, they are grouped. In the past, when click on a plot in the group, the group will be selected. 2nd click will select a single plot. 3rd click will select a single point. In Origin 2020, 1st single click on a plot will select the single plot, 2nd click will select a single point. If you want to select the whole group, press Shift key when clicking on plot. Set system variable @gsm=0 to roll back to the old behavior. | |
0 | Skip Points (or speed mode) keeps last point by default | Skip Points (or speed mode) keeps last point by default | When skip points in scatter graph, last point may be skipped. In Origin 2020, last point will be forced to show by default. Set @smep=0 to roll back to old behavior. | |
0 | System variable to disable graph rendering | System variable to disable graph rendering | For project file contains graph that will take forever to draw, can set @DDP to 1 to prevent graph drawing. |
Graph Types
ID | JIRA | SUMMARY | Description | DETAILS |
|---|---|---|---|---|
0 | Before-After Plot | Before-After Plot | Plot: Basic 2D: Before-After | |
0 | Density Dots and Color Dots for Large Data | Density Dots and Color Dots for Large Data | Plot: Basic 2D: Density Dots and Plot: Basic 2D: Color Dots | |
0 | Kite Diagram | Kite Diagram | Plot: Specialized: Kite Diagram | |
0 | Pie Chart Improvements | more Pie Chart types supported | Plot → Basic 2D Many Pie/Donut samples in Help: Learning Center. | |
0 | Population Pyramid | Population Pyramid graph | Plot: Statistics: Population Pyramid It's a two layer histogram side by side. | |
0 | Sankey Diagram | Sankey Diagram | Plot: Categorical: Sankey Plot: Categorical: Aluvial | |
| 0 | Piper Diagram | Make piper diagram using specified ions dataset. | Download Piper Diagram app from the page and install the app. This app can be used to create piper diagram used the specified ions data.
| |
| 0 | Create marginal abatement cost curve. | Create marginal abatement cost curve | This App create a marginal abatement curve from worksheet columns. | |
| 0 | Soil and Rocks Classification Diagrams | Help to create Soil and Rocks Classification Diagrams with provided templates | Download Soil and Rocks Classification Diagrams app from the page and install the app. This app is to provide you a few popular ternary plot templates to show the relative compositions of soils and rocks:
|
Layer and Plot Management
ID | JIRA | SUMMARY | Description | DETAILS |
|---|---|---|---|---|
0 | Copy Paste Data Plots between Graph Layers | Copy Paste Data Plots between Graph Layers | Click on a plot and then choose Copy Plot button on Mini toolbar E.g. on the left graph below, click the continent border (black plot plot) and click Copy Plot button. Then on the right graph, Ctrl+V. Border lines will be added. Labtalk command layer.plot.copy() //copy active plot or group of plots layer.plot2.copy() //for ungrouped plot, copy 2nd plot |
Line and Symbol
ID | JIRA | SUMMARY | Description | DETAILS |
|---|---|---|---|---|
0 | Faster scatter plot drawing speed | Faster scatter plot drawing speed and new Color Dots graph | Improved scatter drawing speed when turning off speed mode to show all data, specially for square shaped scatter plot and colormapped scatter plot, it's almost 5-10 times faster. Also, support a new plot type, Color Dots. It can be almost 8 times faster than normal colormapped scatter plot. For scatter plot with solid rectangle and circle shapes, improve the drawing speed when turn on transparency. It can be 1.5 times faster than before. | |
0 | Show Scaling Factor even if Symbol Size isn't indexed to a column | Show Scaling Factor even if Symbol Size isn't indexed to a column | Size Unit can be set. We can choose Point, X scale, Y scale. Precision and maximum value for Size option should follow axis scale, when size unit=X scale, Y scale. |
Multi-Axes/Multi-Panel
ID | JIRA | SUMMARY | Description | DETAILS |
|---|---|---|---|---|
0 | Move Multi-Panel/Axis plots to new tab of Plot menu | Move Multi-Panel/Axis plots to new tab of Plot menu | There are too many plot types under Plot: Basic 2D. So we moved multi-panel and multi-axis plot types into a new tab: Multi-Panel/Axis | |
0 | Separate rugs for each panel of Trellis Plot | Separate rugs for each panel of Trellis Plot |
Specialized
ID | JIRA | SUMMARY | Description | DETAILS |
|---|---|---|---|---|
0 | Data Point Tooltip should not open dialog for sankey/alluvial/parallel | Data Point Tooltip should not open dialog for sankey/alluvial/parallel | Turn off the Data Point Tooltip dialog for sankey/alluvial/parallel | |
0 | More options in Windrose Plot | More options and controls for WindRose Plot | ||
0 | Plot Data Organized as X,XErr,Y,YErr, Z as a 3D Graph with X and Y direction error | Plot Data Organized as X,XErr,Y,YErr, Z as a 3D Graph with X and Y direction error | If there is another Z column after Z column and you choose Plot: 3D: 3D Scatter + Z Error, the last Z will be plotted as Z direction error bar. |
Text Labels & Legends
ID | JIRA | SUMMARY | Description | DETAILS |
|---|---|---|---|---|
0 | Left Arrow options when adding custom legend symbol | Left Arrow options when adding custom legend symbol |
Theme and Template
ID | JIRA | SUMMARY | Description | DETAILS |
|---|---|---|---|---|
0 | List View in Template Library | List View in Template Library | Template Library with large thumbnail view is not easy to use if there are many user-defined graph template. List View is added. |
Installation and Licensing
Start-up
ID | JIRA | SUMMARY | Description | DETAILS |
|---|---|---|---|---|
0 | Speed Up Origin Startup | Origin startup speed has been improved especially when User Files Folder is on LAN. | Origin startup speed has been improved especially when User Files Folder is on LAN. |
Trail
ID | JIRA | SUMMARY | Description | DETAILS |
|---|---|---|---|---|
0 | Invite colleague to try Origin | Users with active maintenance service can choose Help: Invite a colleague to try Origin... to offer colleague a fully functional license for 21 days. | Users who have active maintenance service can choose Help: Invite a colleague to try Origin... to offer colleague a fully functional license for 21 days. |
Miscellaneous
Origin Workspace
ID | JIRA | SUMMARY | Description | DETAILS |
|---|---|---|---|---|
0 | Add a Find Apps... menu under Fitting, Peak Analysis, and Statistics menu | Add a Find Apps... menu under Fitting, Peak Analysis, and Statistics menu | There are many Free and easier to use apps in these area and hidden. When built-in ones don't fit your need, click Find Apps in these areas. | |
0 | Double Click tooltip should not open preference dialog | Turn off double click tooltip to open Preference dialog | Turn off double click tooltip to open Preference dialog | |
0 | In Load Template dialog, arrow shows on top of column header by default | In Load Template dialog, arrow shows on top of column header by default | Choose File: New: From Template... to open a dialog. Templates here can be sorted by clicking column header. But it's not obvious. In Origin 2020, an arrow shows on column header by default to indicate sort-ability. | |
0 | Reduce unnecessary redraw of Object Manager to save time when editing large graph. | Reduce unnecessary redraw of Object Manager to save time when editing large graph | For graph which many data, object manager will NOT be updated unless there are actual changes to data plot in any of the layer. This will avoid slowness causes by necessary update of Object Manager. | |
0 | Support Column to use Combo List or Checkbox control | Support Column to use Combo List or Checkbox control | wks.col.edit Adds to each cell in the column, one of the following: 1 = unselected check box 0 = Remove controls
| |
0 | Support Recently Used Fonts in some dialogs, such as Plot Details, Text Object, etc. | Support Recently Used Fonts in some dialogs, such as Plot Details | Click Font control in the dialog, user can see recently used font on the top of the dropdown list. Not supported in Axis dialog. |
Settings
ID | JIRA | SUMMARY | DESCRIPTION | DETAILS |
|---|---|---|---|---|
0 | Increase Row Size Limit for 64bit | Increase Row Size Limit for 64 bit | Increase the worksheet row size limit from 90M to 200 M for 64bit. | |
0 | Hotkey improvements in Worksheet | Hotkey improvements in Worksheet | CTRL+SIFT+END extends to end of data column. CTRL+SHIFT+HOME extends to 1st column SHIFT + Arrow to select multiple columns or rows like in Excel | |
0 | Use different shortcuts for main menu beginning with same initial letter | Use different shortcuts for main menu beginning with same initial letter | In 2020, we changes some menu shortcuts |
Programming
Labtalk
ID | JIRA | SUMMARY | DESCRIPTION | DETAILS |
|---|---|---|---|---|
0 | Control Polygon or Polyline object thru LabTalk | Control Polygon or Polyline object through LabTalk |
Suppose user has a polygon of 4 points, then script "polygon.pointcount =;" will return 4. Also, can set polygon.pointcount=5 to add more points, then use polygon.x5= and polygon.y5= to specify the 5th point coordinates.
// objname.GetXY(xDataset, yDataset); // copy from obj to dataset
| |
0 | Faster Date and Time LabTalk functions | Faster Date and Time LabTalk functions | Origin Labtalk functions belong to Date and Time category are moved to VC level to have faster speed. E.g. Column A is filled with 1million rows of date data Set Column B formula as WeekDayName(A) In Origin 2019b and earlier build, it took about 95 sec, while in Origin 2020, it only takes about 1 sec. Note: In Set Column Values dialog, you can click Function: Date and Time menu to see all date and time functions Origin supports. | |
0 | LabTalk option to generate gadget output for all curves, all layers, etc. | LabTalk option to generate gadget output for all curves, all layers, etc. | We had the following to generate new output of a gadget. | |
0 | LT command to reduce file size | LT command to reduce file size | Labtalk command file -cp is very useful to reduce a huge data file, E.g. a 14G CSV file, you cannot open it anywhere. You can reduce it to a manageable size first. The code is like this dlgfile g:=*.csv; to reduce it to 3Mb. | |
0 | Origin C OC and LT Access to Data Connector | Origin C and LabTalk Access to Data Connector | 1. OC call LT Sub method in Page level, for example: void test() 2. Support "wbook.DC.type$" to get the DC type. 3. Simpler syntax for web connector in LT, for example: newbook; | |
0 | Support numeric access to label cell | Support numeric access to label cell | When label cell is a numeric value, you can access it as numeric value instead of string now. E.g, col(A)[D1] =; This can be disable by setting @LRNA = 0. | |
0 | Support simple LT expression in Add Straight Line and other XFs | Support simple LabTalk expression in Add Straight Line and other X-Functions |
|
Origin C
ID | JIRA | SUMMARY | DESCRIPTION | DETAILS |
|---|---|---|---|---|
0 | Add OriginC for note window | Add OriginC for note window | void test(string str = "Hello World.html") { string strFile=GetOriginPath(ORIGIN_PATH_SYSTEM) + "\\Samples\HTML\\" + str; string strExport = "c:\\test\\test.html"; int n; Note note; note.Create(); n = note.DoMethod("Load", strFile); n = note.DoMethod("EXPORTHTML", strExport); n = note.SetProp("View",0); n = note.SetProp("Syntax",0); n = note.DoMethod("DUPLICATE"); n = note.DoMethod("Close"); } | |
0 | Convert floating-point from other formats to IEEE 754 | Convert floating-point from other formats to IEEE 754 | Added following OC funtion to convert floating-point from other formats to IEEE 754. typedef enum { FLOATING_POINT_TYPE_IEEE_FLOAT = 0, // 32-bit FLOATING_POINT_TYPE_IEEE_DOUBLE, // 64-bit FLOATING_POINT_TYPE_VAX_F, // 32-bit, ~[-2.9E-39, 1.7E+38] FLOATING_POINT_TYPE_VAX_D, // 64-bit, ~[-2.9E-39, 1.7E+38] FLOATING_POINT_TYPE_VAX_G, // 64-bit, ~[-5.6E-309, 0.9E+308] FLOATING_POINT_TYPE_IBM_SHORT, // 32-bit FLOATING_POINT_TYPE_IBM_LONG, // 64-bit FLOATING_POINT_TYPE_IBM_LONG_XPORT, // 64-bit bool convert_floating_by_format(LPVOID lpOutputBuff, LPVOID lpInputBuff, size_t nNumValues, FLOATING_POINT_TYPE nOutputFormatType, FLOATING_POINT_TYPE nInputFormatType);For example: | |
0 | NAG Mark 26.1 | NAG Mark 26.1 | NAG library is upgraded to Mark 26.1 version | |
0 | Support copy and paste link for GetN numeric or string input | Support copy and paste link for GetN numeric or string input | User can copy a label cell or a data cell, and paste link to edit box in XF dialog. |
Python/R
ID | JIRA | SUMMARY | DESCRIPTION | DETAILS |
|---|---|---|---|---|
0 | Preshipped Python 3.7.2 | Pre-shipped Python 3.7.2 | Preshipped Python version upgraded to 3.7.2 | |
0 | Support Python Input() Method | Support Python Input() Method | Python 3.x: var1 = input ("Enter a number:") Python 2.7: var1 = raw_input ("Enter a number:") This will prompt a GetN box. |
