Origin 2016 Highlights
The table below only lists some highlights of Origin 2016. To see more features in 2016, please use the navigation bar on the left panel of this page.
Origin Interface
JIRA | SUMMARY | DETAILS |
|---|---|---|
Graphing
New Graph Types
JIRA | SUMMARY | DETAILS |
|---|---|---|
Labels, Legend, Color Scale and Bubble Scale
| JIRA | SUMMARY | DETAILS |
|---|---|---|
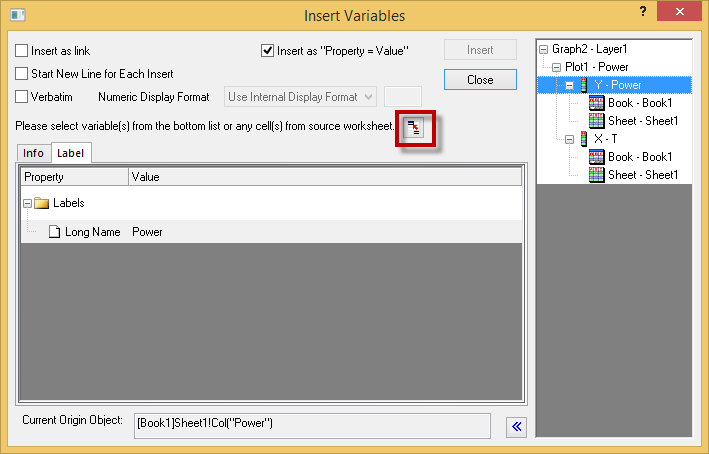
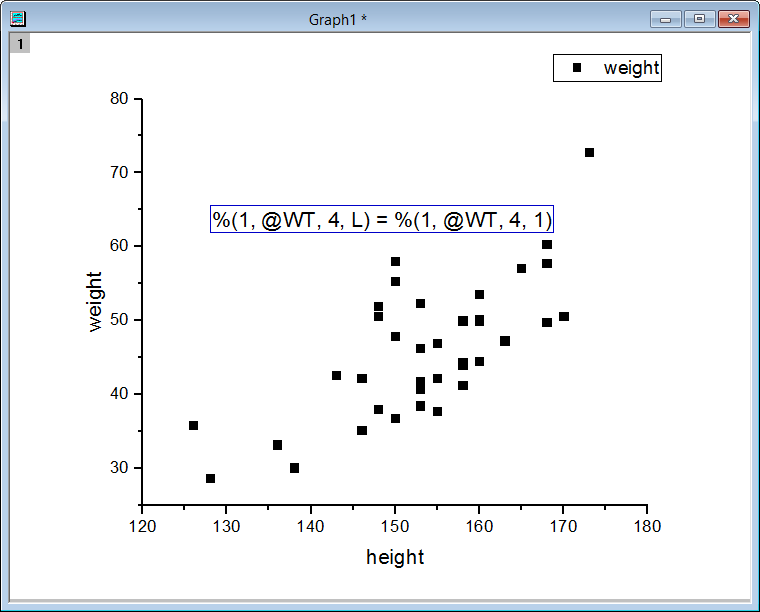
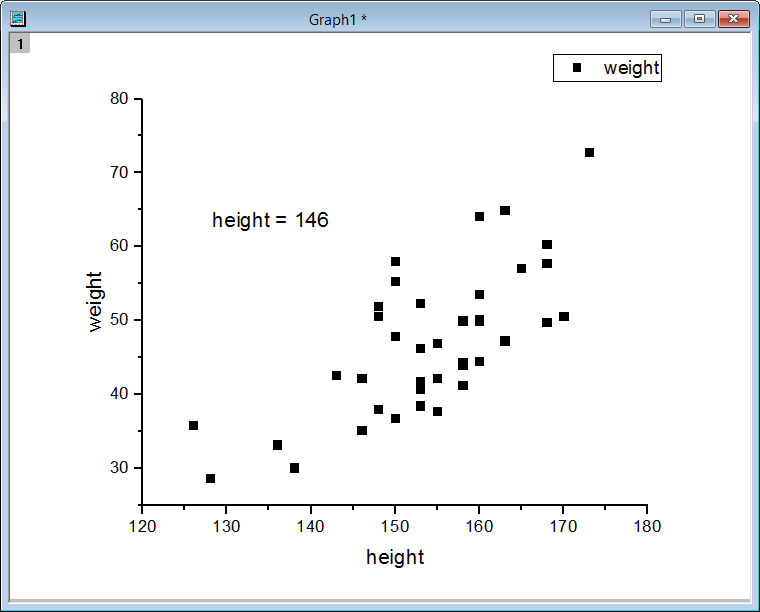
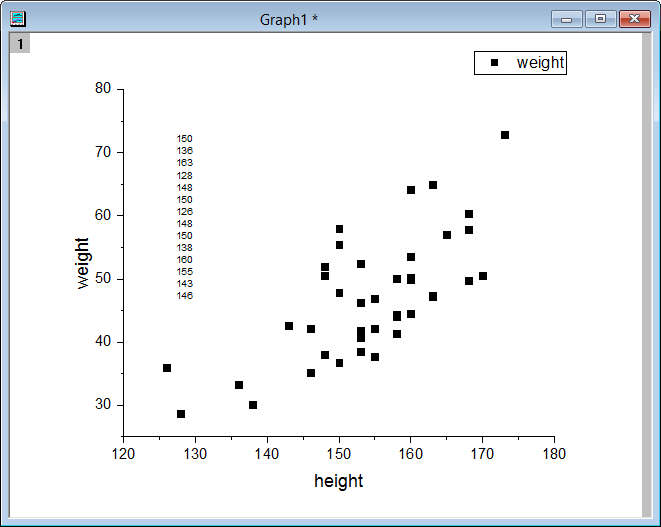
Easier Way to Annotate Graph with Data or Label in Worksheet and Project&Window Information | Support inserting variables from worksheet cell into text (only for graph) Add a button in Insert Variable dialog, which can hunt worksheet cell and then insert it:
Additional Info (%G, %X, %H) in Plot level for Insert Variable Dialog In the Insert Variable Dialog, if the root folder(root node) of the worksheet(graph) on the right panel is selected, we are able to insert: 1. Active Window Name //%H into the graph or worksheet. Worksheet insert variable dialog: Graph insert variable dialog: | |
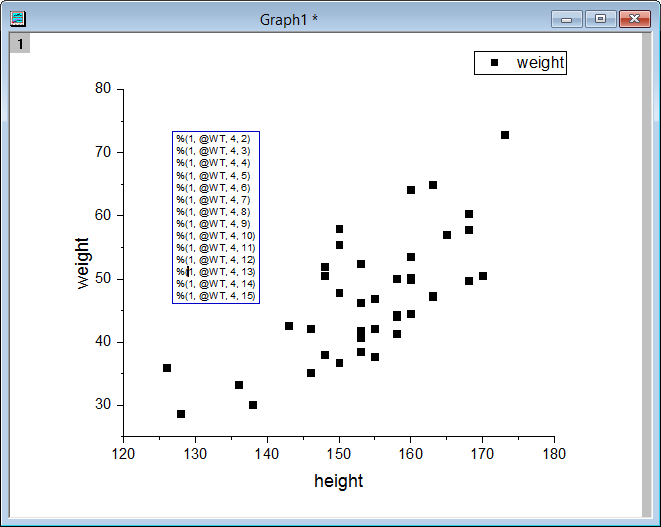
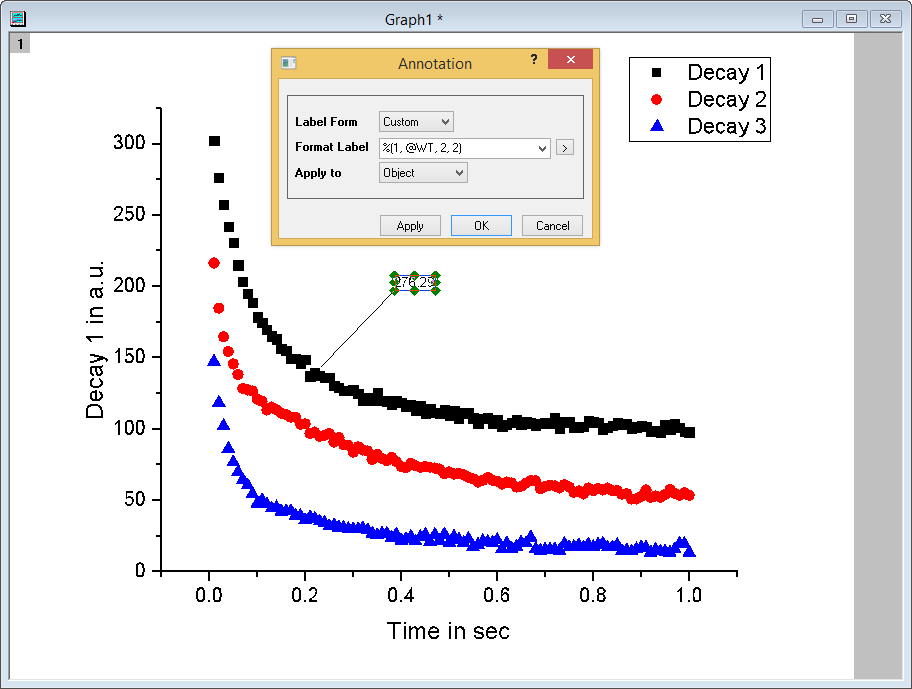
| ORG-6449 | Annotation Tool: Customize Display Label, including metadata support, etc. | Allow to customize the format of the annotation added to the plot. It is available for 2D XY plot and polar, and contour from both XYZ data and matrix. How to...
|
Plot Manipulation
JIRA | SUMMARY | DETAILS |
|---|---|---|
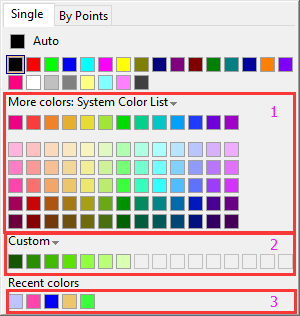
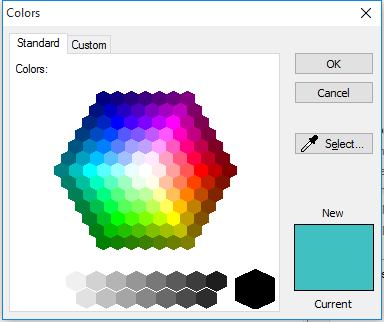
| ORG-373 | Improved Color control: More Colors to pick from, Recent Color remembered, and Easier way to pick Custom Colors | New Color chooser for all elements in Origin that supports color customizatin, such as plots, axis, text labels, graphic object, cells in worksheet, etc.
Color button-menus for various type of single plot is improved:
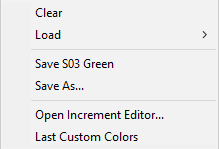
Custom dropdown list: User can load increment color list, save user's own color list and edit existing color list, etc.
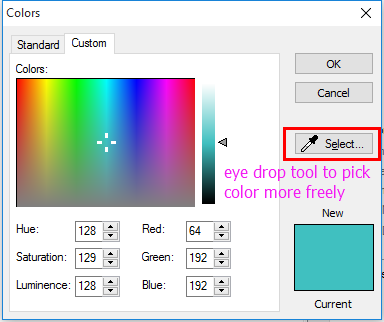
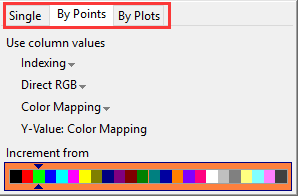
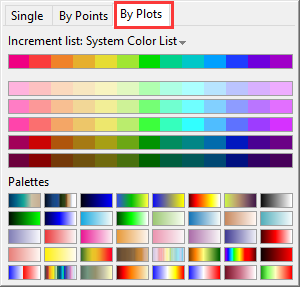
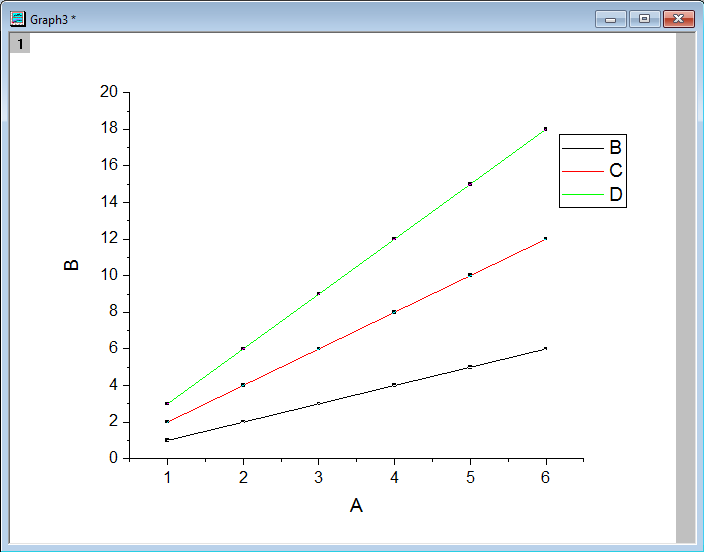
Customer color dialog is improved. Add eye drop tool so that user has more freedom to choose color any where on the screen Users can customize the color of the plots through toolbar control icons and the tab style color selection fly-out offers user more options for color control of the plots. By Points tab:
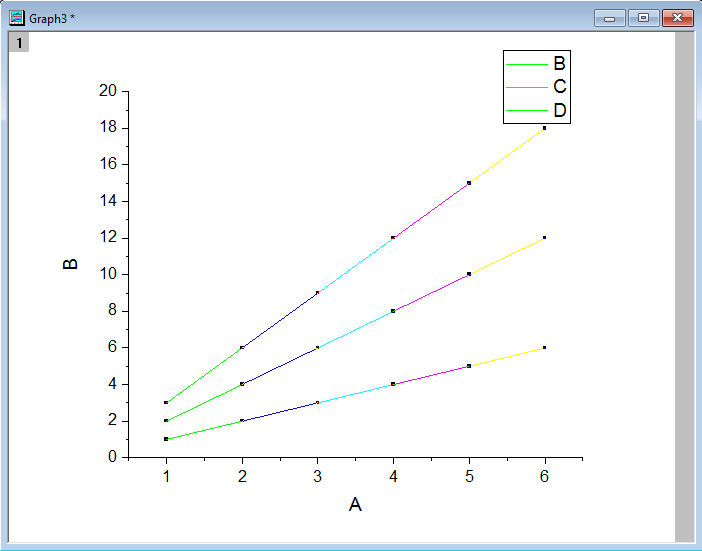
By Plots tab:
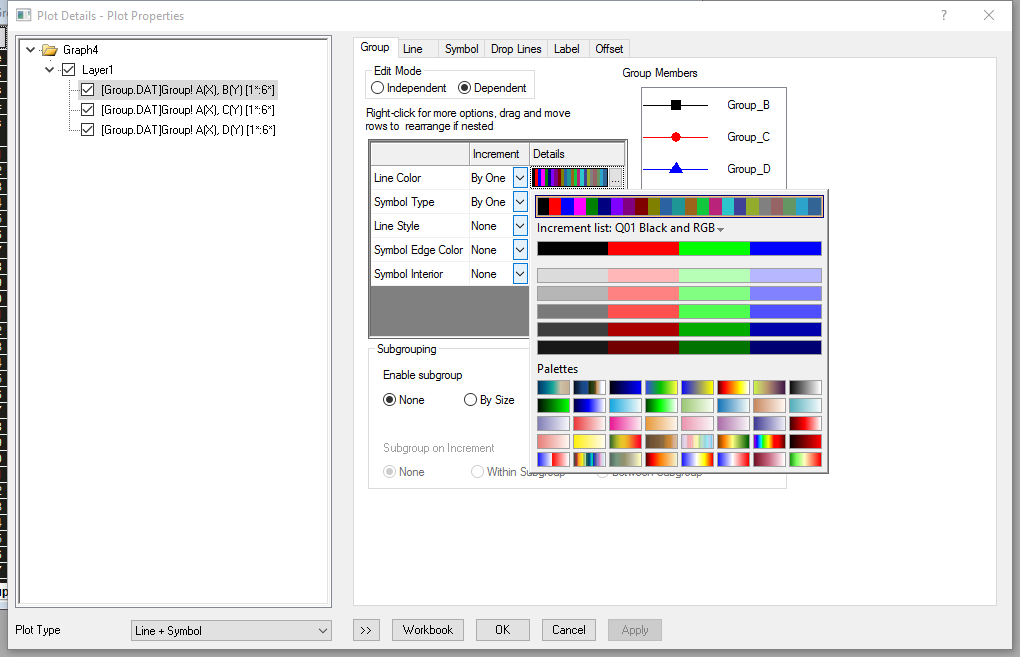
3. The increment list or palettes for "by plots" coloring can also be adjusted in the group tab in plot detail dialog. |
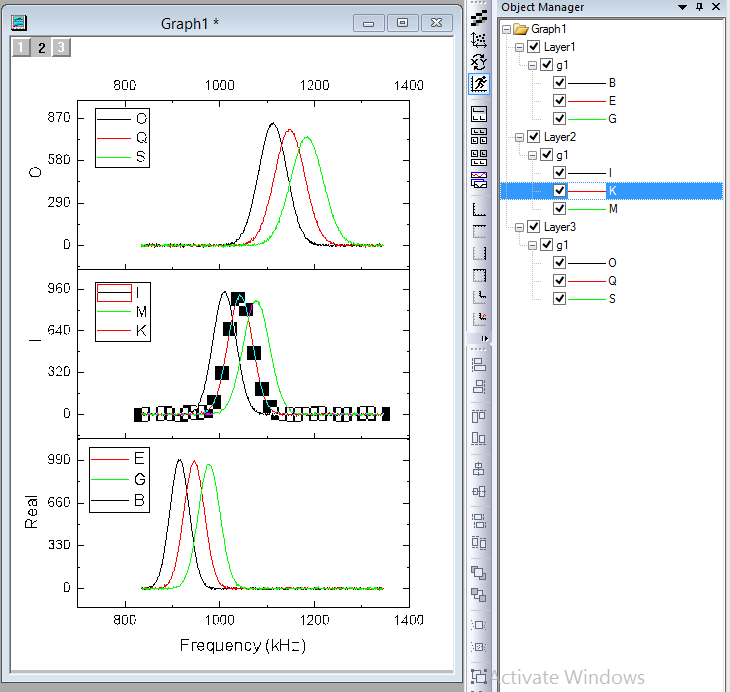
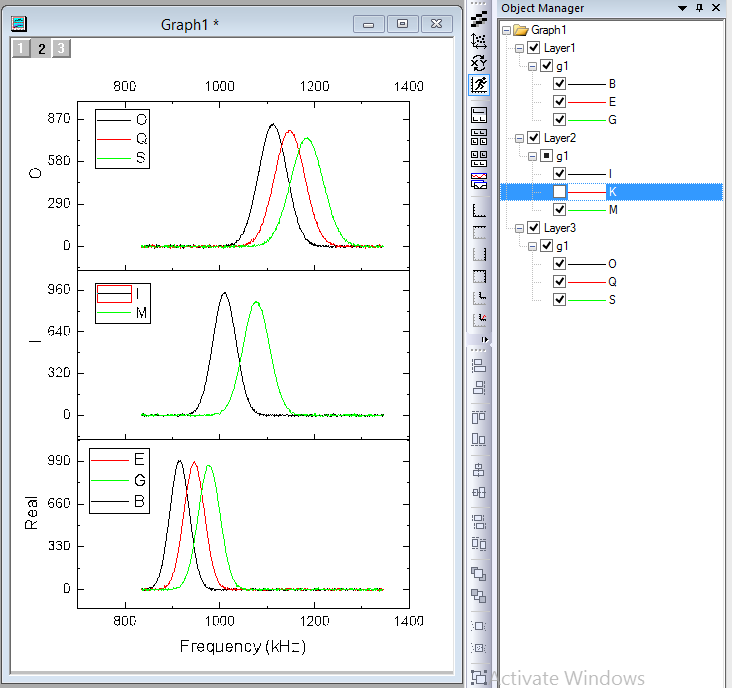
| ORG-10737 | Dockable Object Manager to easily Show or Hide Plots on Graph | Hide and show plots using Object Manager
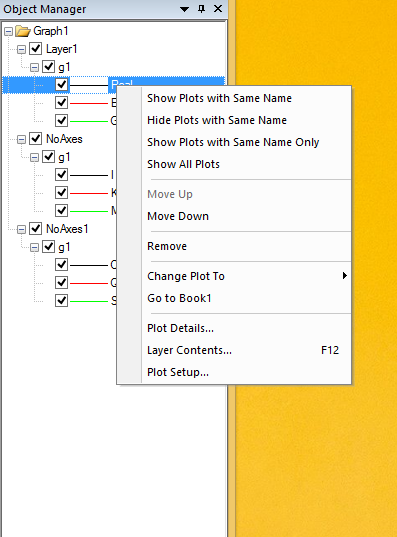
Useful context menu tools inside Object Manager
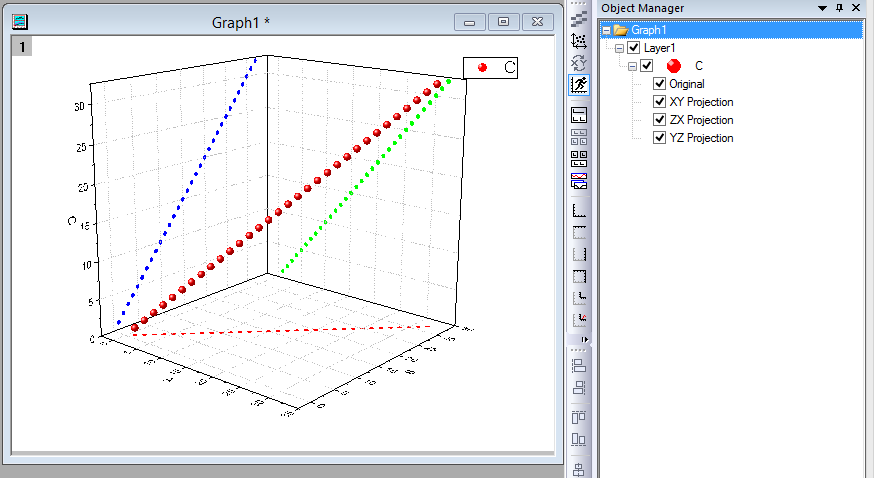
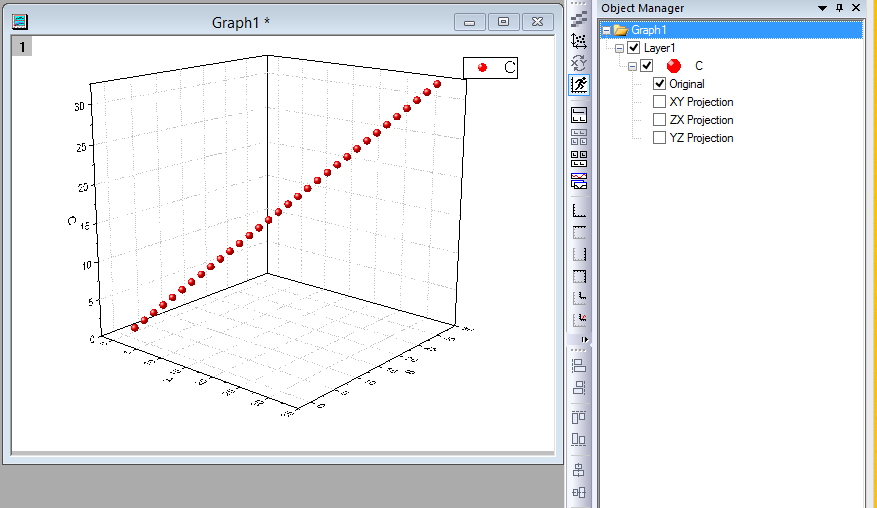
For 3D Scatter plots, XY Projection, ZX Projection, YZ Projection items are included in object manager as well. |
Graph Page and Layer
| JIRA | SUMMARY | DETAILS |
|---|---|---|
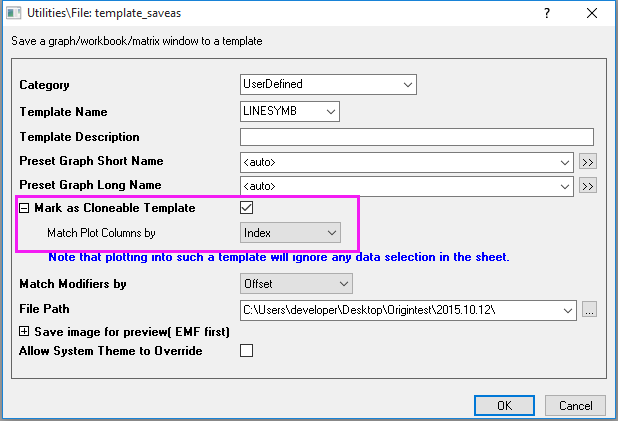
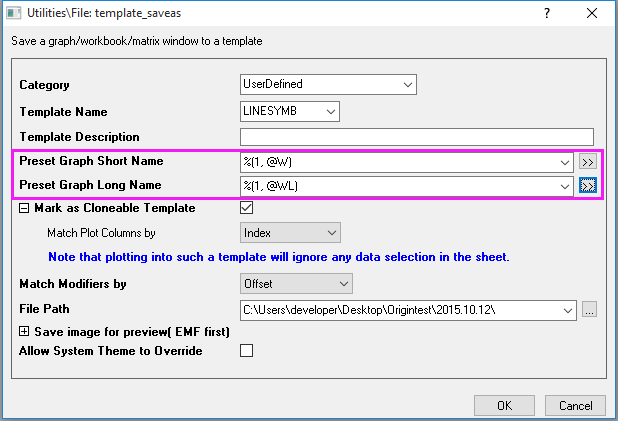
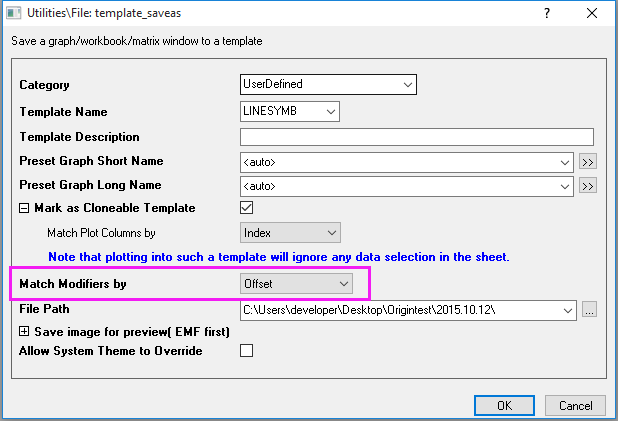
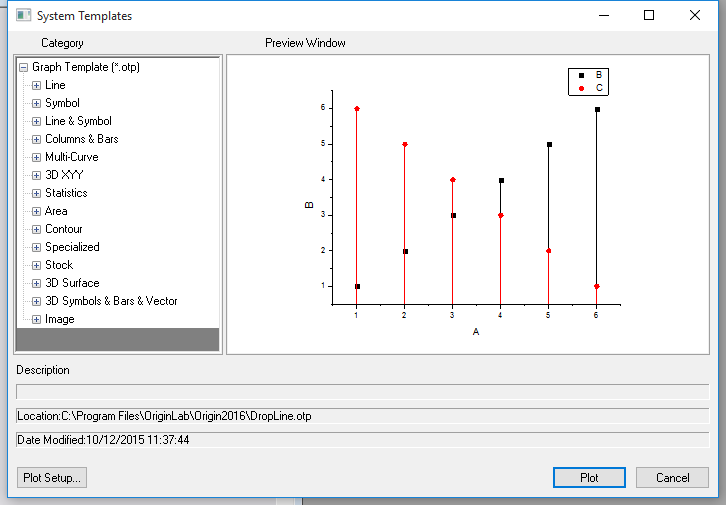
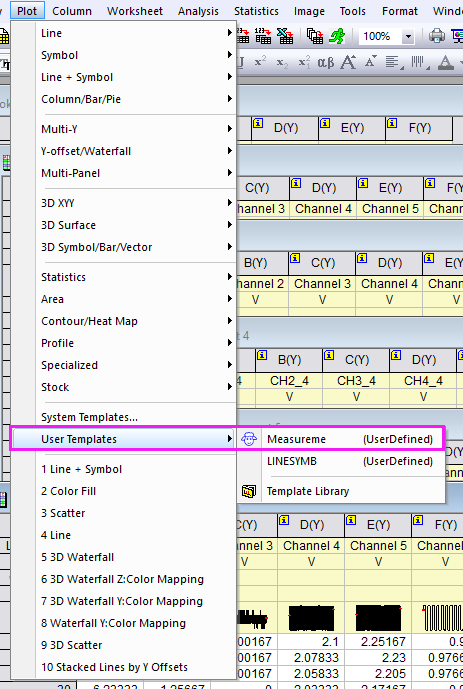
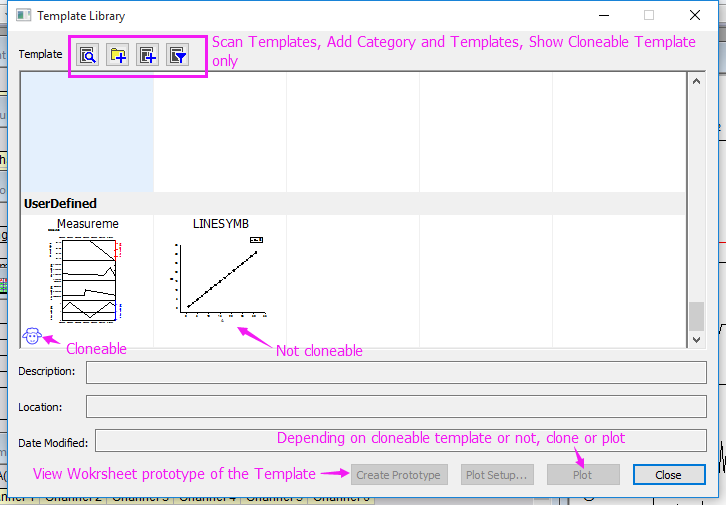
| ORG-12495, ORG-12522, ORG-13209, ORG-13664 | Smart Plotting from Cloneable Template and New Template Library | Save Template As Dialog Changes
|
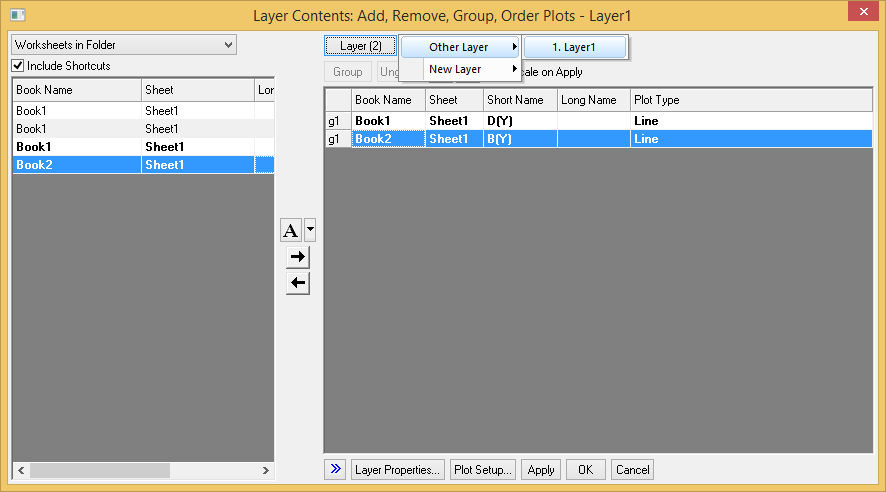
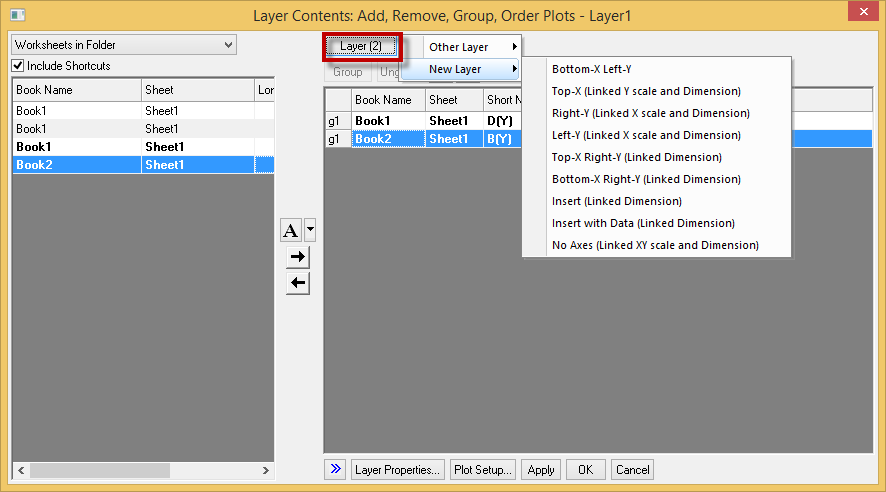
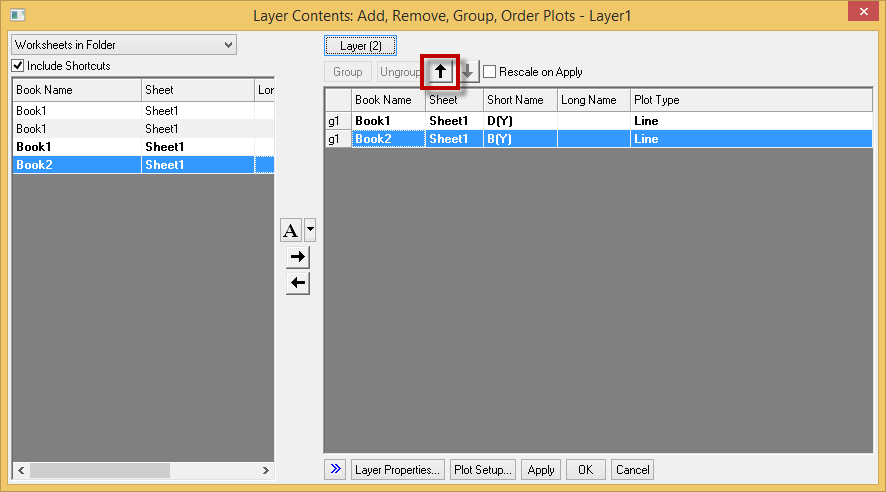
Switch Layer or Create New, and Move Plot Order in a Group in Layer Contents Dialog | Switch Layer or Create New to easily add or remove plots on different layers in graph
Change the order of plots within a group Change plot order within a group with no need to ungroup first |
Axis
| JIRA | SUMMARY | DETAILS |
|---|---|---|
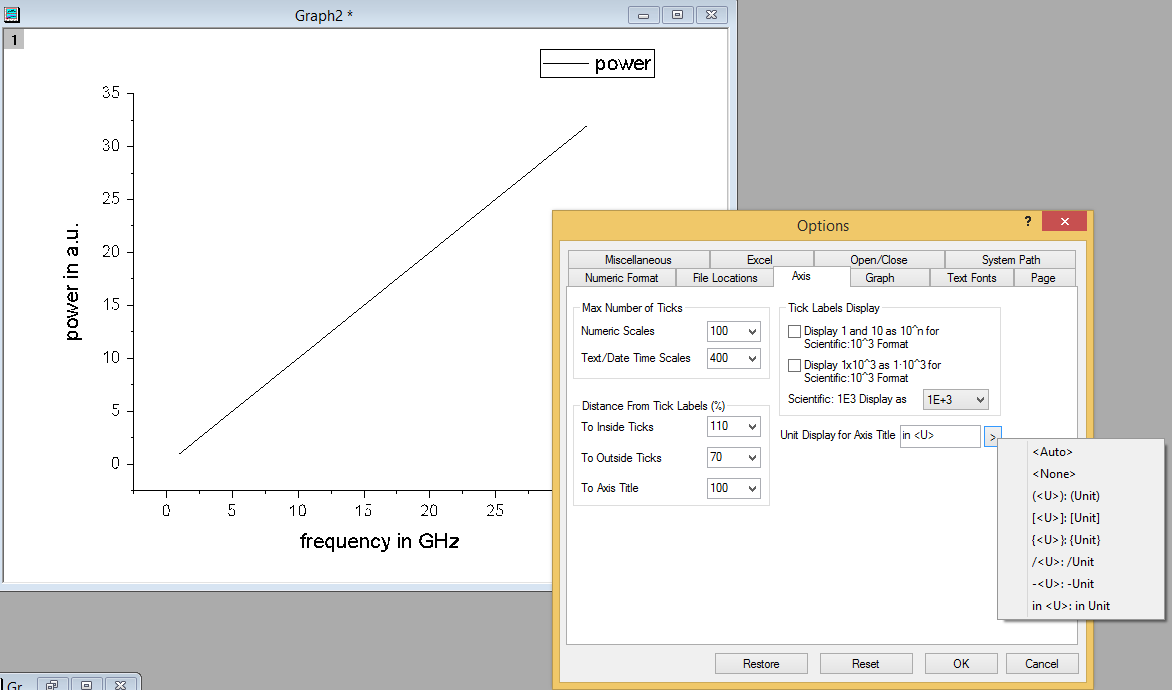
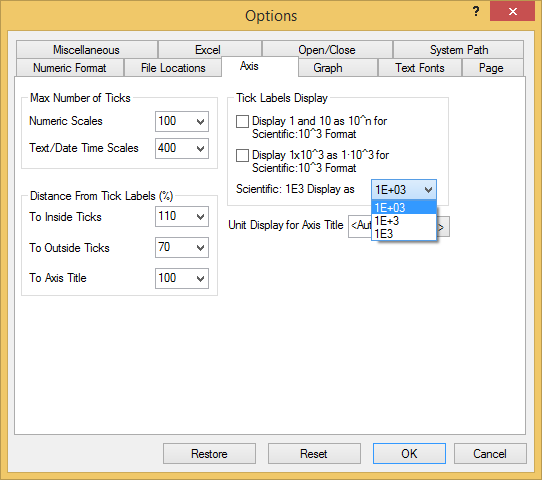
Set Units and Scientific tick label display in Tools: Options. | Various unit formats to choose from in Tools:Options:Axis Different unit format are now supported and can be selected in Options dialog. More Scientific Format Display Control Different scientific format displays can be selcted in the options dialog. | |
3D and Contour
Analysis
Data Processing
| JIRA | SUMMARY | DETAILS |
|---|---|---|
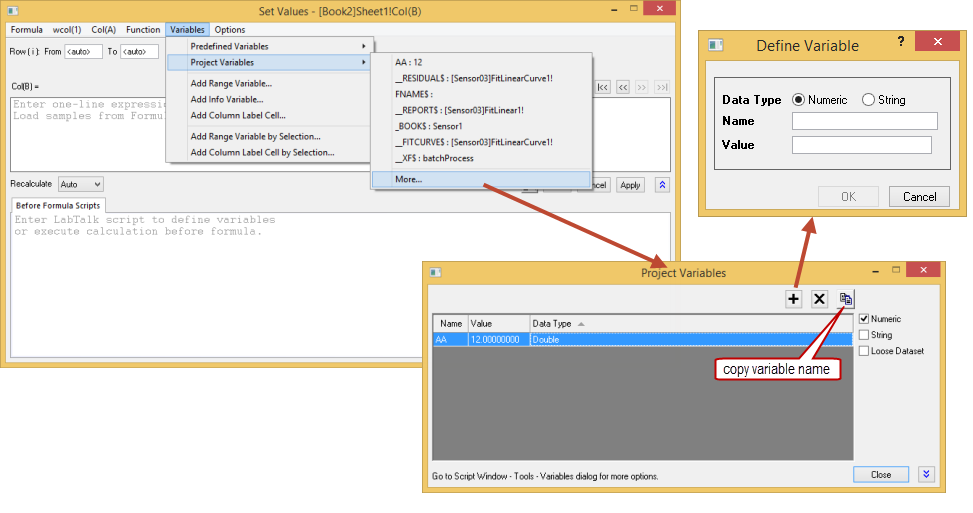
| ORG-12971 | Define and access Project Variables in Set Column Values dialog | Allow inserting project variable in Set Column Value dialog. How to...
|
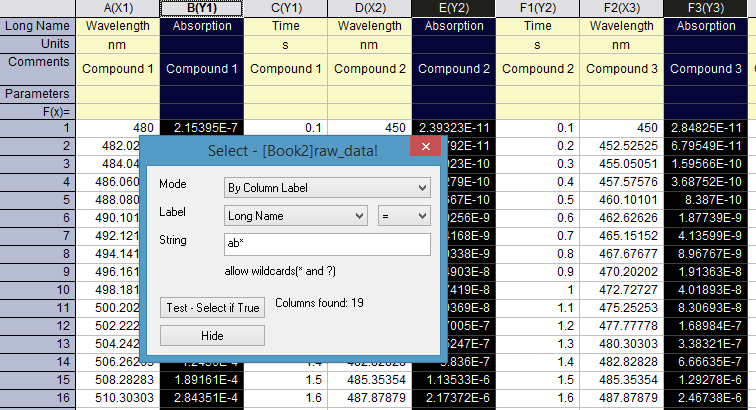
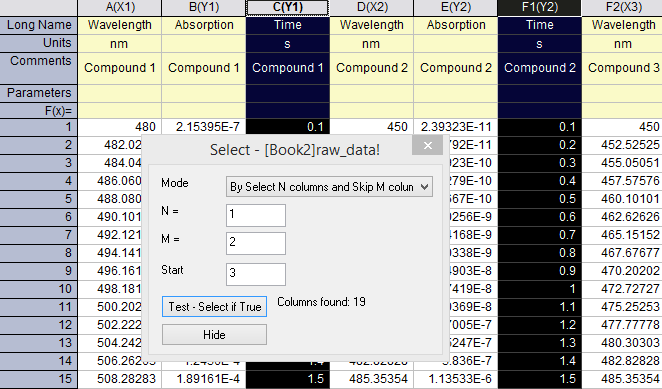
| ORG-13044 | Edit: Select... menu to Select or Hide Columns by Column Label Rows or Skipping | Choose Edit: Select... menu will open Select dialog where user can easily select and hide columns which fit the column label string, or by select N columns and skip M columns. Since it's a modeless dialog, you can keep this dialog open and keep on doing selection and plotting or analysis. Note: if the column label row has numbers, you can even set the >, <, etc. as conditions to select such columns. Select or Hide Columns by Column Label Rows
Select or Hide Columns by Skipping
|
Importing
Exporting and Presentation
Batch Processing
Project and Data Management
Programming and Connectivity
Other
| JIRA | SUMMARY | DETAILS |
|---|---|---|
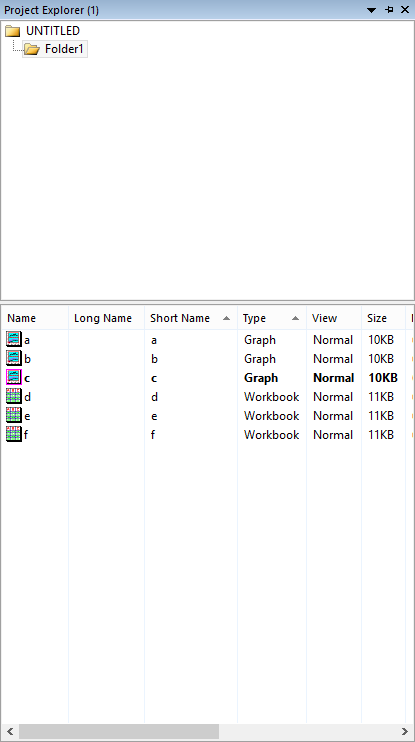
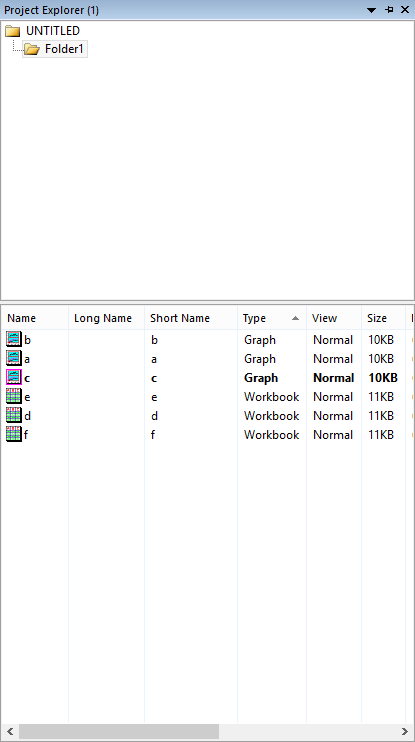
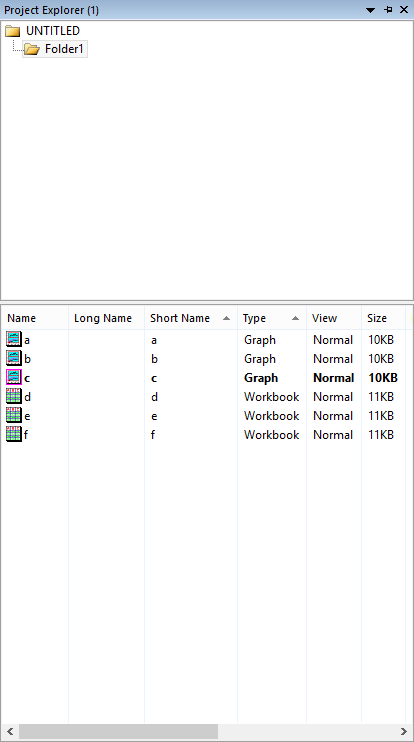
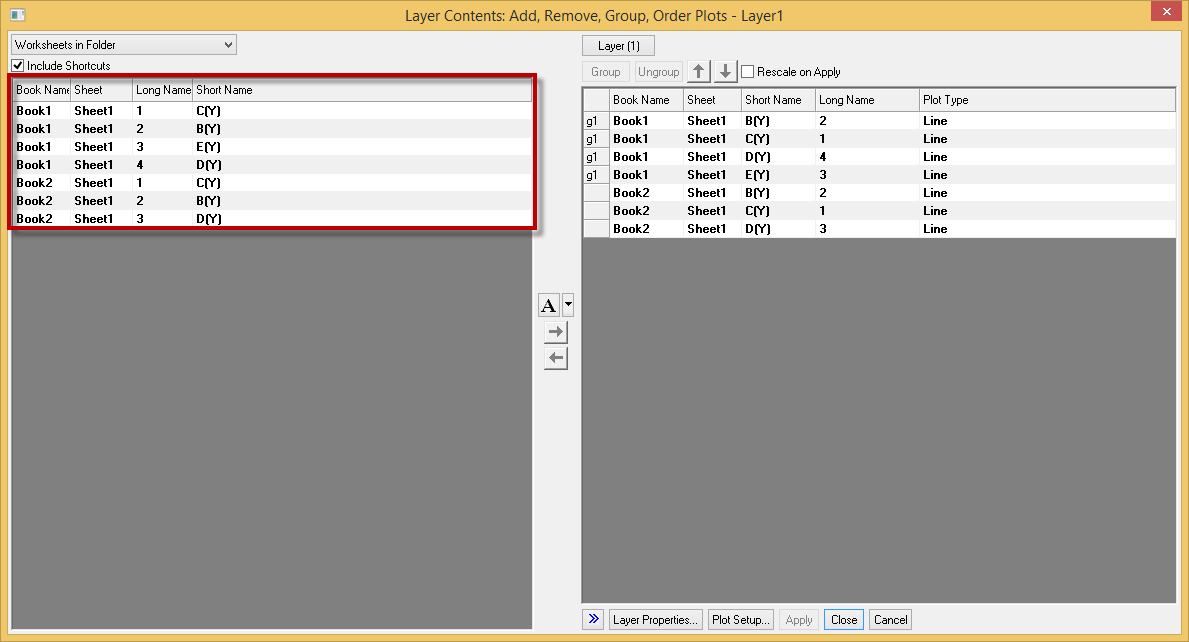
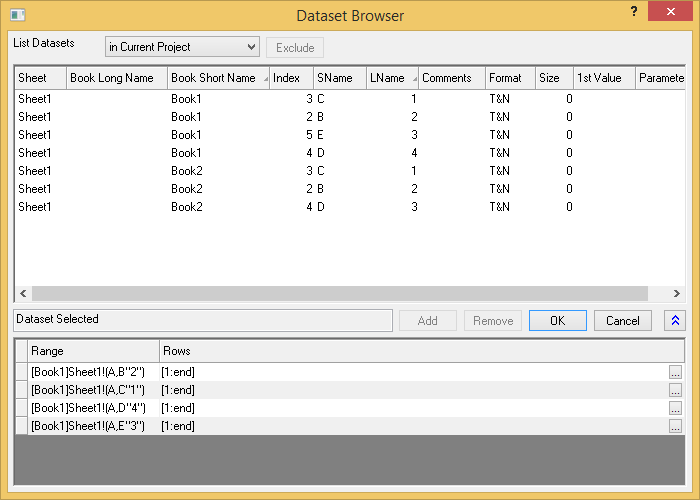
| ORG-11972 | Nested Sorting in Project Explorer, Layer Contents dialog, and Dataset Browsers with Shift key | Nested sorting will be helpful for customers to quickly find Supported in Detailed View of Project Explorer Left Panel of Layer Contents dialog Column/Dataset/Matrix Browsers in different analysis tools that supports multiple Input. PE now support nested sort that allowing files to be sorted within each group
2. Click Type to sort the files by type first, notice that they are still disordered by short name. 3. Want to sort by short name within each type group, Hold shift key and click Short Name. Now within each type, files are sorted by short name. Layer contents dialog now supports nested sort The Long Name is sorted within each Book group: Dataset Browser supports nested sort The Long Name is sorted within each Book group: |
Origin 2016 Highlights on YouTube
...
- Improved Color control: More Colors to pick from, Recent Color remembered, and Easier way to pick Custom Colors
- Dockable Object Manager to easily Show or Hide Plots on Graph
- Smart Plotting from Cloneable Template and New Template Library
- Switch Layer or Create New, and Move Plot Order in a Group in Layer Contents Dialog
- Set Units and Scientific tick label display in Tools: Options.
- Easier Way to Annotate Graph with Data or Label in Worksheet and Project&Window Information
- Annotation Tool: Customize Display Label, including metadata support, etc.
- Define and access Project Variables in Set Column Values dialog
- Edit: Select... menu to select or hide columns by column label
- Nested Sorting in Project Explorer, Layer Contents dialog, and Dataset Browsers with Shift key
Graphing
- New Axis scale type: Discrete to support skipping weekend and holidays in financial plots
- Data Labeling on Indiced Points Only and More Label Format Controls
- Line Spacing Control of Multi-line Text Object in Graph
- Legend and Color Scale improvements such as legend text following symbol color, color scale showing as color blocks with corresponding range
- Non-Zero Baseline in Axis dialog for Column/Bar, Drop lines and Area Plot
- Multi-layer Graph Improvements: Set Layer Width or Height by Common Scale and Align Layers with Specified Value
- Set Graph window Short and Long Name during Batch Plot and in Graph Template
Analysis
- Word template with Bookmark for Report Creation in Batch Processing
- Batch Process improvements: set Script Before Process, and append results by columns.
- Peak Analysis Improvements: Snap to Spectrum, Relative Baseline, Set Upper and Lower Bound of Peaks, etc.
- Provide GUI for customization of LR report table on graph
...
Apps
We will continue to make more Add-in tools available for Origin 2016. To find out what is available, choose Tools: Apps on File Exchange: menu and see what's available there. E.g. Insert Map Images, Plot Submatrix and ODESolver for now.
...
- Solve Ordinary Differential Equations
- Heat Map with Dendrogram
- Tangent
- Plot Sub matrix
- Send Graphs to Word
- Simple Fit
- Maps Online
...
