Peak Analysis Improvements
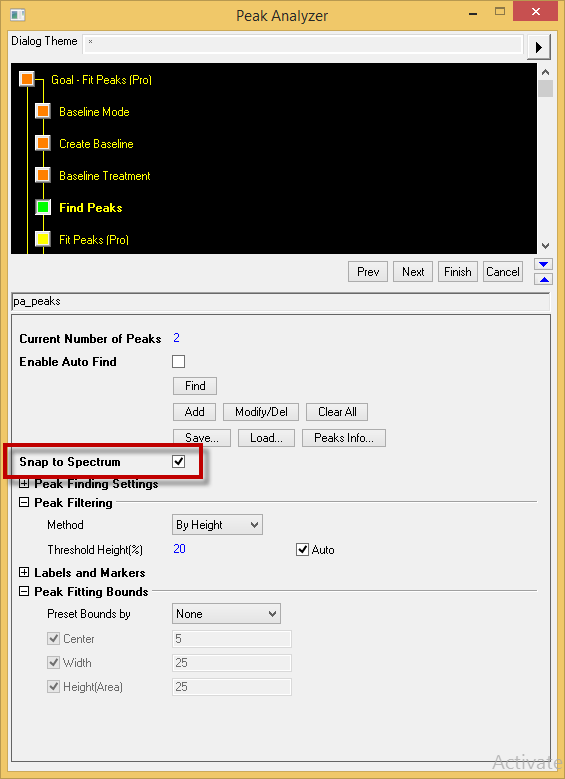
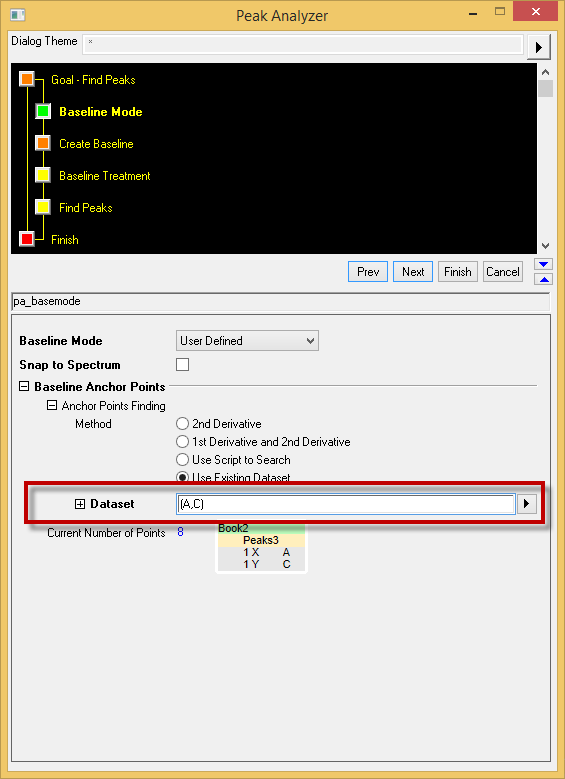
| support Snap to Spectrum in peak finding | Batch Peak Analysis supports relative column on using existing dataset as baseline |
|---|---|
In PA dialog, add an option Snap to Spectrum in find peaks page so that the spectrum height will be automatically calculated from the curve. This is useful that customer only need to save the peak center in the theme and the height will be calculated. | In the PA setting baseline step, relative column position is used as baseline input if only column number is set in Dataset. This is useful in Batch processing that user wants the same column in each worksheet as baseline.
|
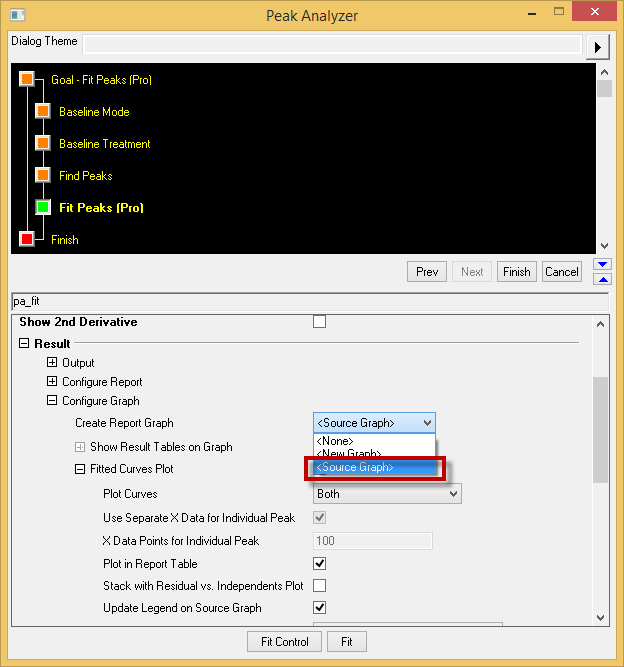
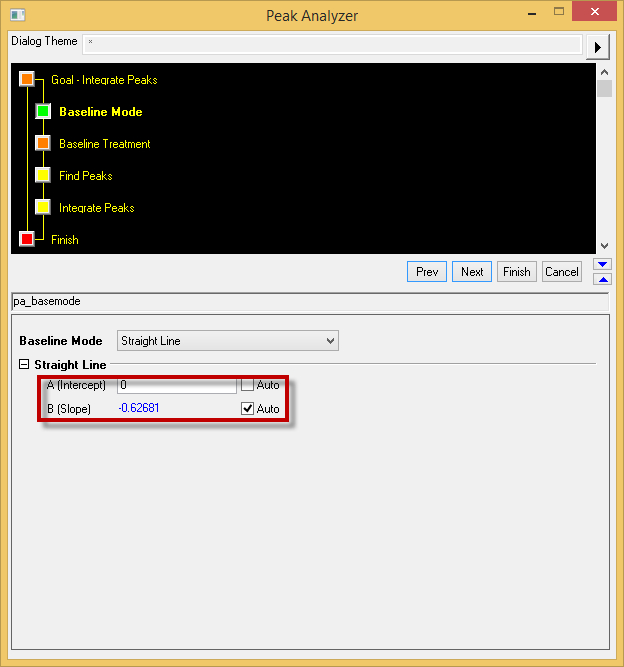
| output the Peak field table to source graph, when start PA with a graph | Allow User to set Slope and Y intercept for Straight Line Option on Baseline mode Page |
Under Result:Create Report Graph, can add result table to the source graph. | Customer is now able to set the intercept and slope of the straight line as the base line. |
| Set upper and lower bound of peaks in Peaks Find Page | Support to only save initial peak parameters instead of baseline |
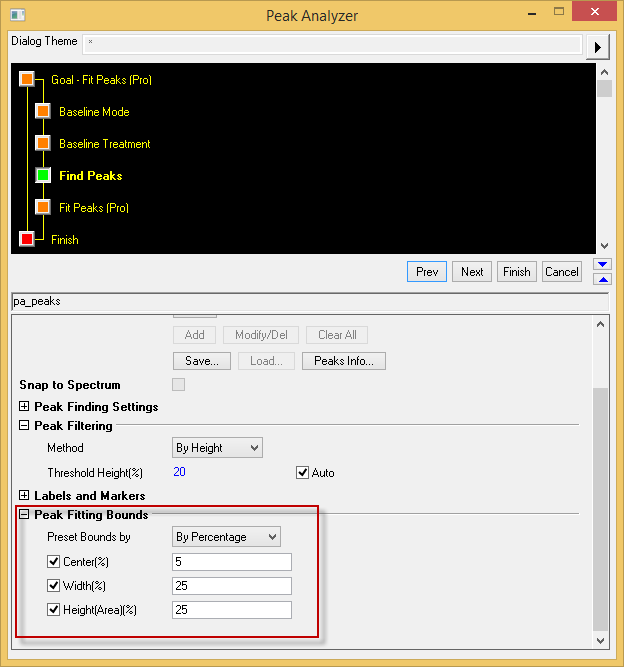
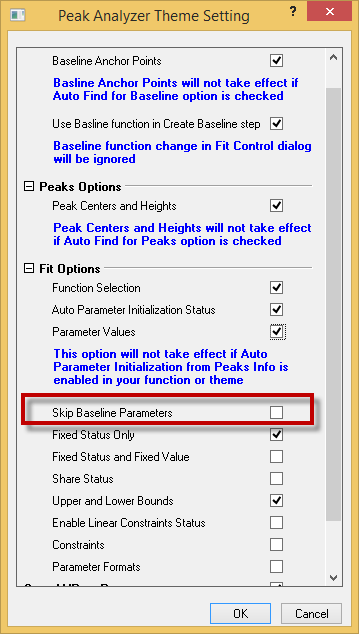
When peak analysis goal is Fit Peaks, we added a Treenode type branch Peak Fitting Bounds that customer can preset the bounds of fitting parameters. | User has the option now to exclude the baseline info from the saved theme that user can manually set the baseline with other parameters are predefined in a theme. |
| Make it easy to delete peaks / anchors in Peak Info dialog | Add ALS baseline method (Pro-only) to PA and Quick Peaks |
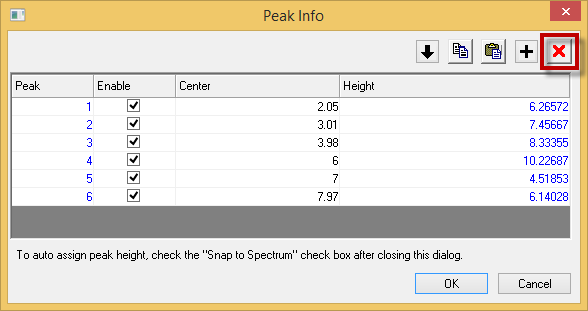
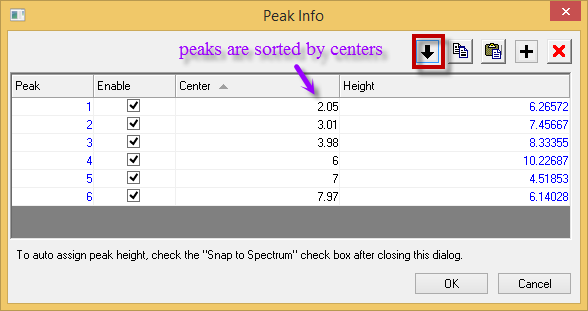
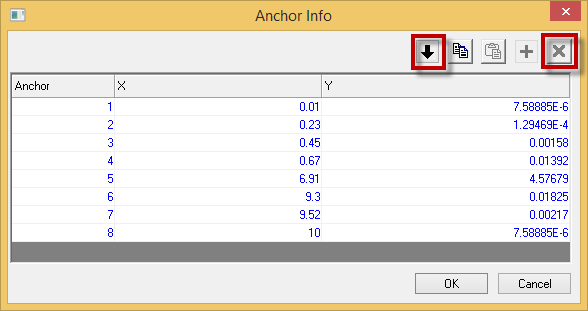
In the Peak Find page, inside Peak info dialog, peaks can be selected/deselected through the enable check box. Peaks can also be sorted using the sort center ascending button. It also works for anchor info dialog.
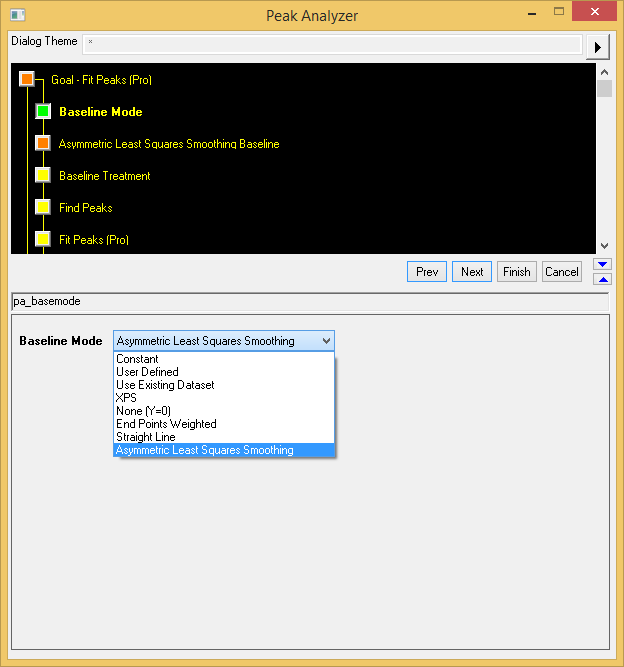
| Add Asymmetric Least Squares Smooting option in Baseline Mode drop-down list.
|
