Provide GUI for customization of LR report table on graph
- Yiming Chen
- Wall-E
- Sabrina (Unlicensed)
Owned by Yiming Chen
Last updated: Nov 07, 2017 by Wall-E
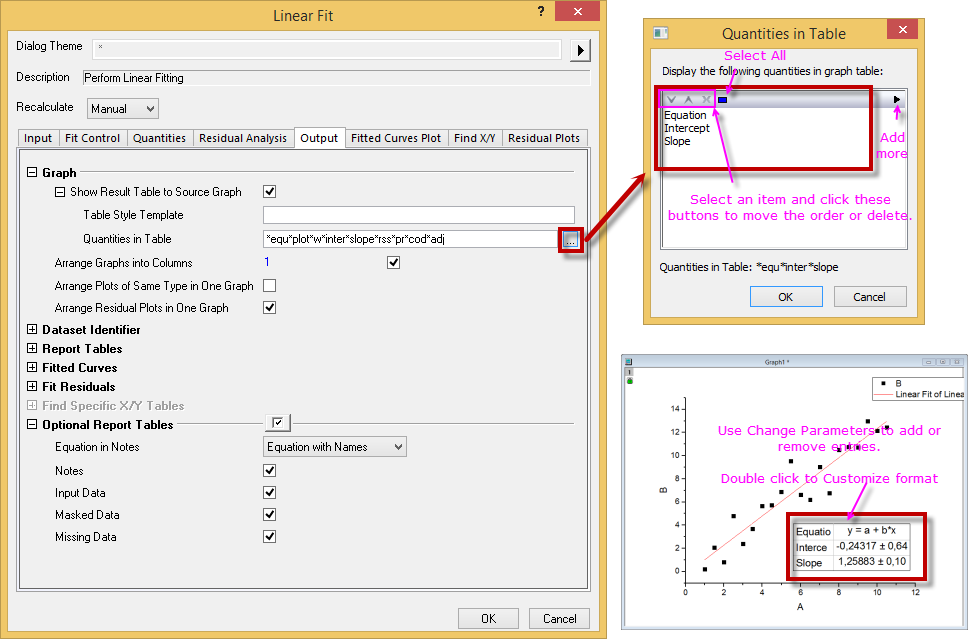
In doing Linear Fit, NLfit, Fit Linear with X Error, Polynomial Fit dialog on graph, add a "..." button after the edit box of Quantities in Table. It will open a dialog to add or delete the quantities to put in the graph table. In the following example, when only "Equation","Intercept","Slope" are selected, the table displayed in the graph only shows these three items.
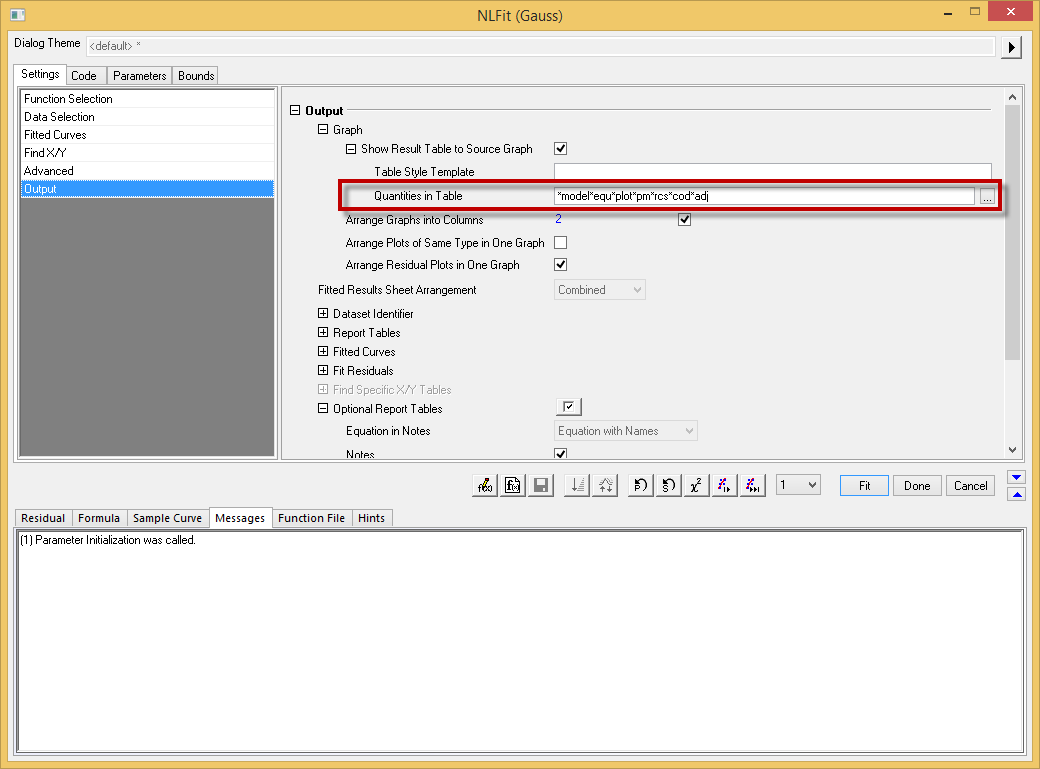
The nonlinear fitting dialog also has this feature.
double click the report table will open the Quantities in Table dialog that can choose the variables displayed in the table. Right click the table and select "Go to Worksheet" context menu leads to the real worksheet of the table.
, multiple selections available,