Origin 2016 Highlights
The table below only lists some highlights of Origin 2016. To see more features in 2016, please use the navigation bar on the left panel of this page.
Origin Interface
JIRA | SUMMARY | DETAILS |
|---|---|---|
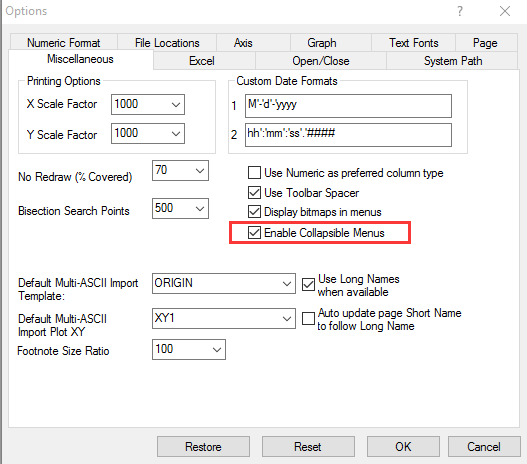
| ORG-13548 | Enable/Disable Collapsible Menus from Tools:Options | User can disable/enable collapsible menus by check box in Miscellaneous tab of Tools:Options.
|
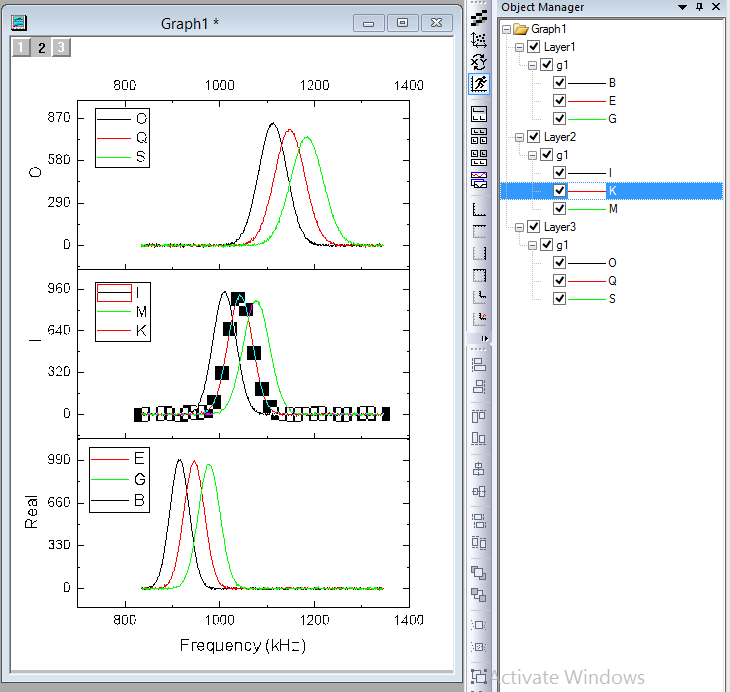
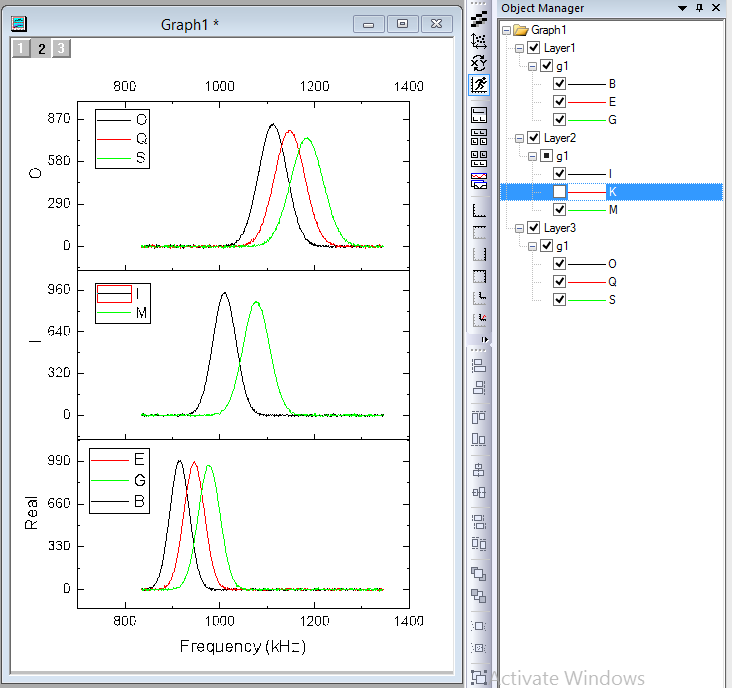
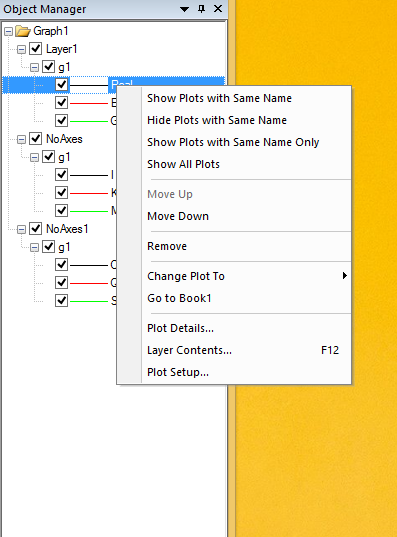
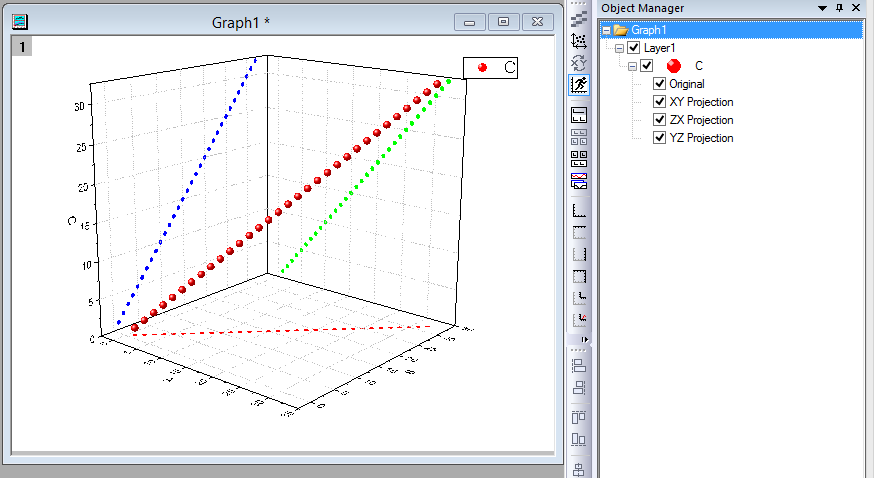
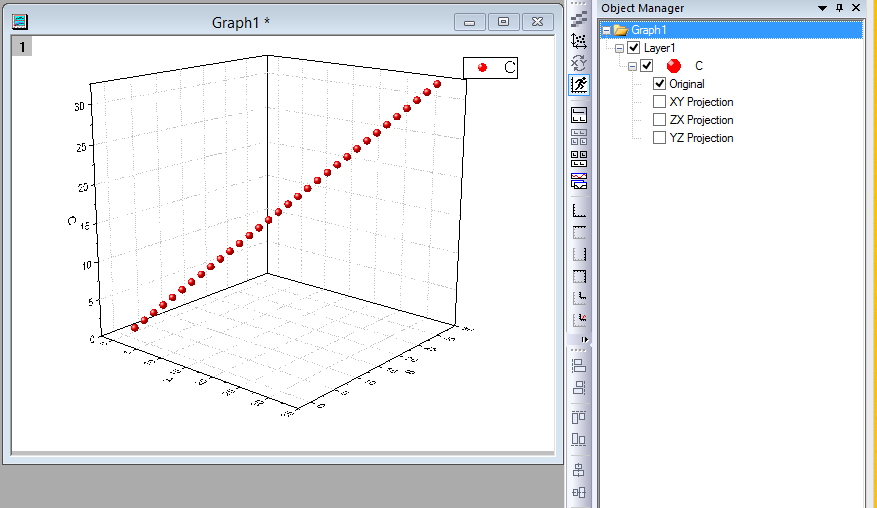
| ORG-10737 | Dockable Object Manager to easily Show or Hide Plots on a Graph | Hide and show plots using Object Manager
Useful context menu tools inside Object Manager
For 3D Scatter plots, XY Projection, ZX Projection, YZ Projection items are included in object manager as well.
|
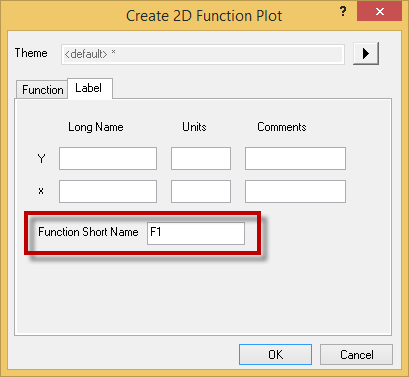
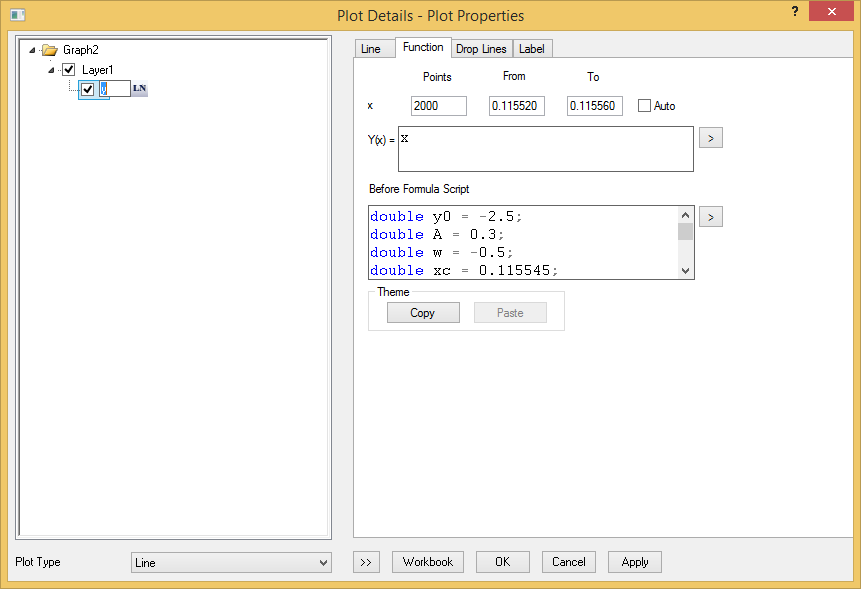
| ORG-12904 | GUI to Rename Plots with Loose Data (2D function plot & virtual matrix) | Set the short name of the 2D function plot Under the label tab of the Create 2D Function Plot dialog, we can set the Function short name.
Short name or long name of the loose data can be changed in plot detail dialog Open the plot detail dialog of a 2D function plot or virtual matrix plot, we can change the short name or long name of the plot. Clicking the small button besides the name will toggle between long name and short name.
|
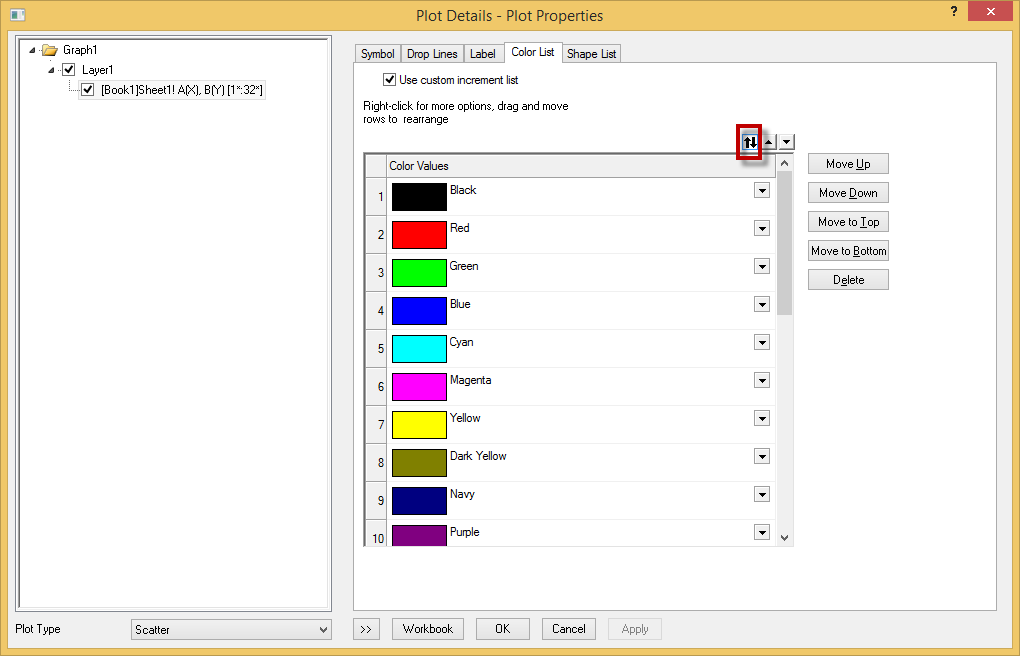
| ORG-12763 | Support flip color increment list | Allow the order of colors in the color list or the order of shapes in the shape list be flipped. When the Symbol Color is set to increment, can flip the order in the Color List tab. This also applies to the symbol shape.
|
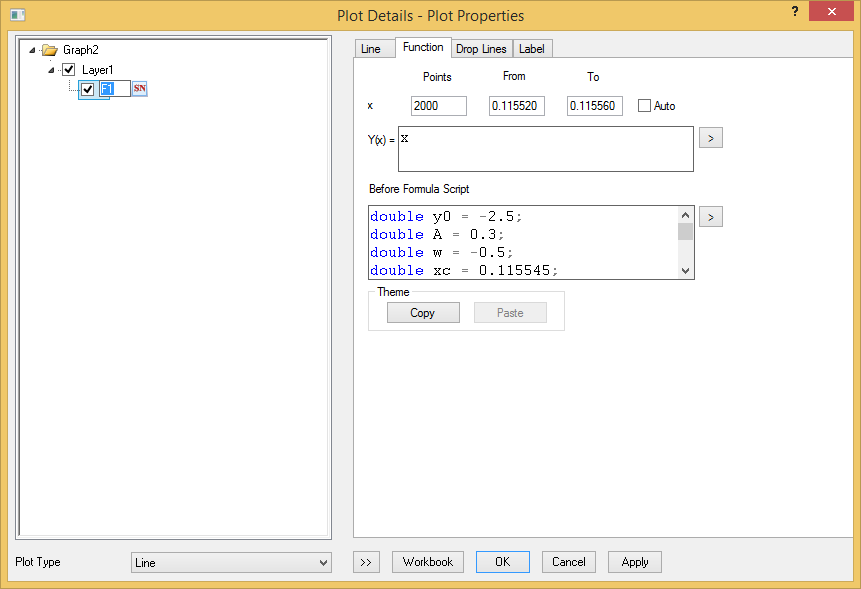
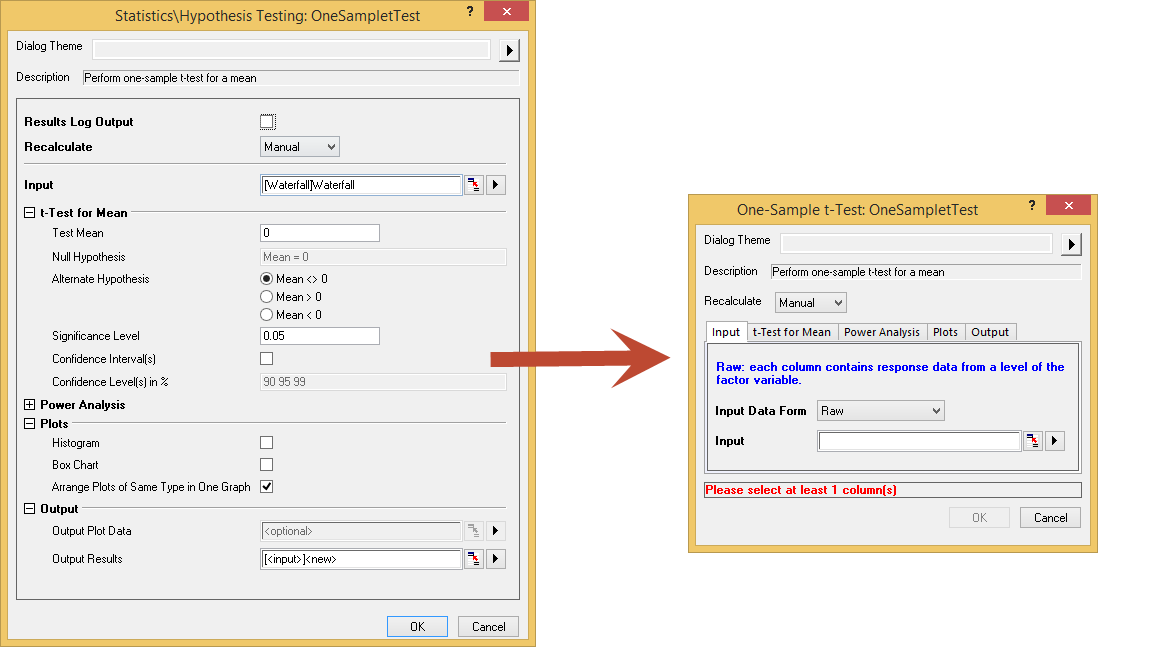
| Use tab style dialog for more analysis and statistics tools | Changed the dialog to be tab-based for the analysis/statistics tools with long trees, especially those statistics tools. User can change back to old GUI by setting system variable @TSD to 0. (Choose Tools: System Variables... menu. Enter TSD as Variable and enter 0 as Value.)
| |
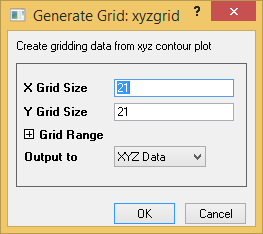
| ORG-10207 | Support Generating Grid from Triangulation | Right click on the contour plot created from XYZ data and choose "Generate Grid" to generate the grid data.
In the pop-up dialog, can export the grid to XYZ data or matrix.
|

Graphing
New Graph Types
JIRA | SUMMARY | DETAILS |
|---|---|---|
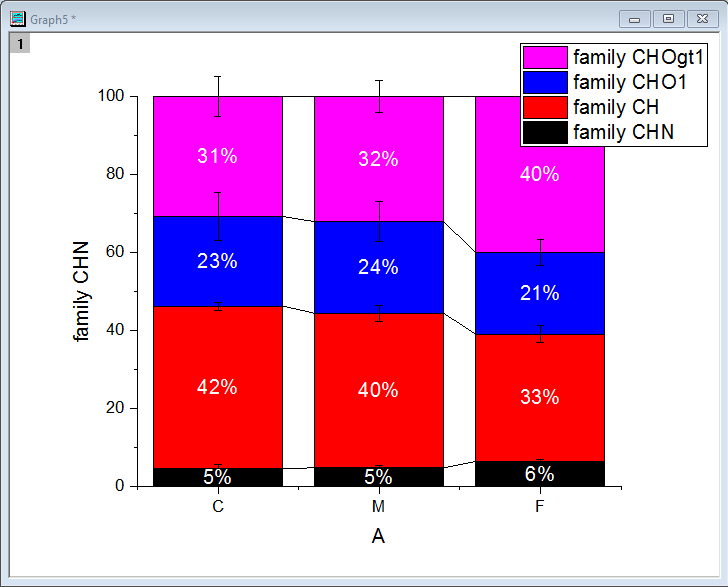
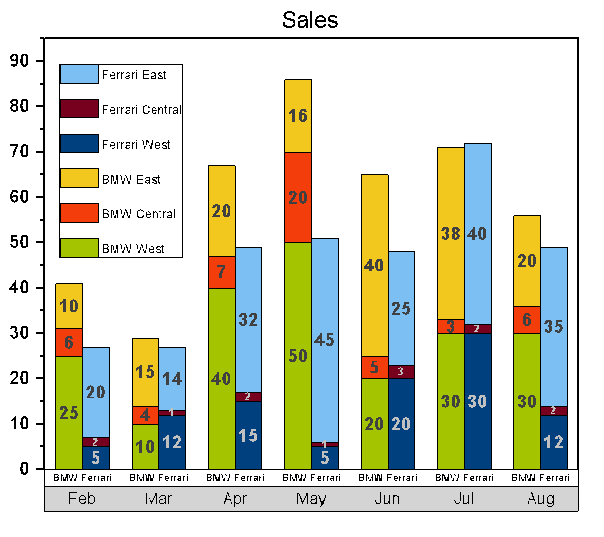
| ORG-12500 | Support 100% stacked column/bar plot with error bar | Error bar is supported in 100% stacked column/bar plot.
|
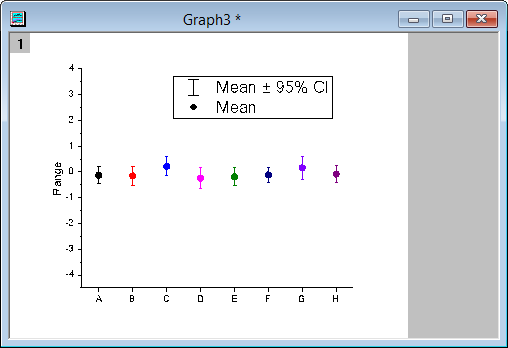
| ORG-7860 | Support Interval Plot | Add Interval Plot under the Plot:Statistics. Interval Plot plots the mean and 95% confidence interval for grouped data.
|
Labels, Legend, Color Scale and Bubble Scale
| JIRA | SUMMARY | DETAILS |
|---|---|---|
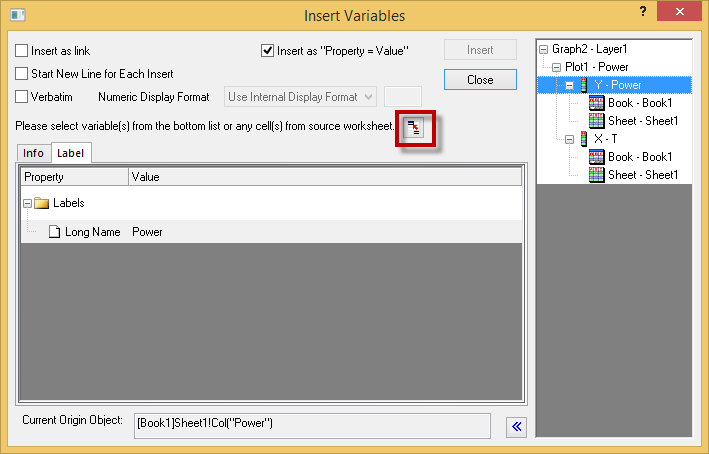
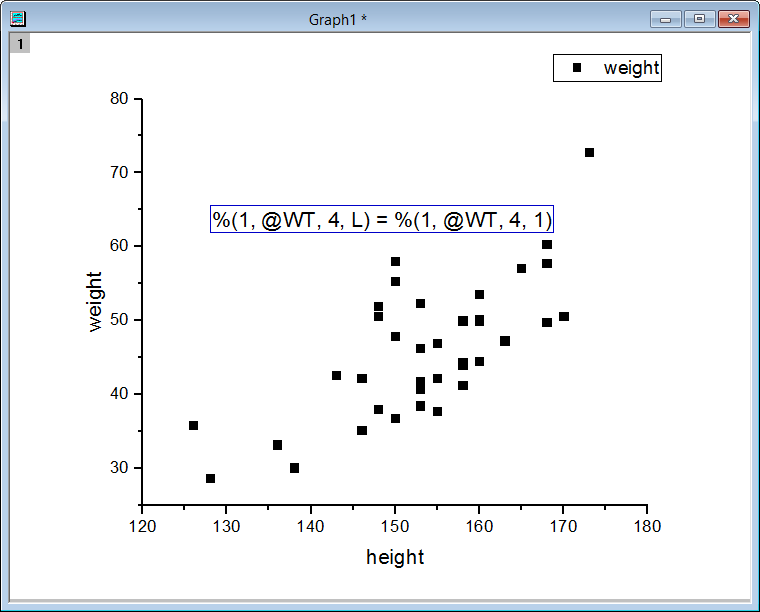
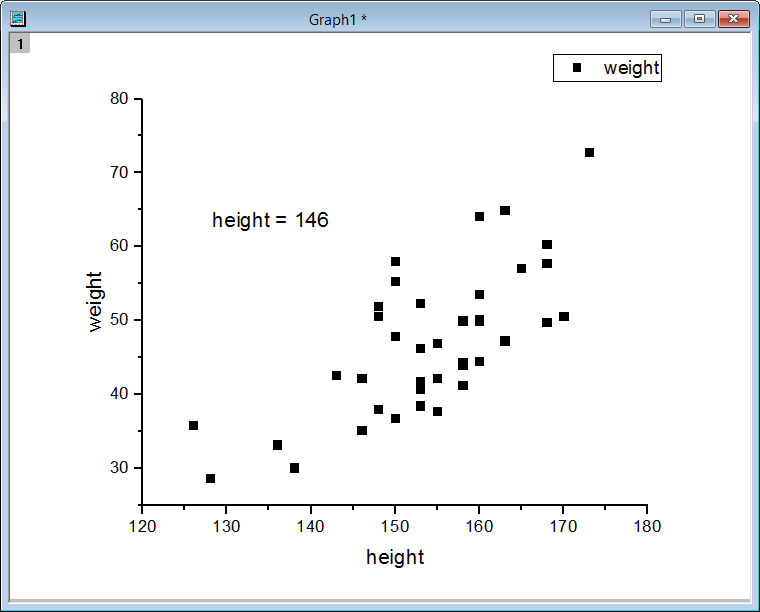
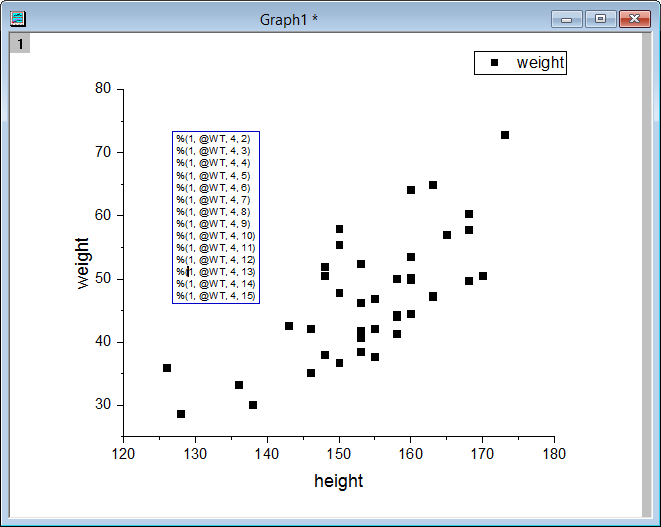
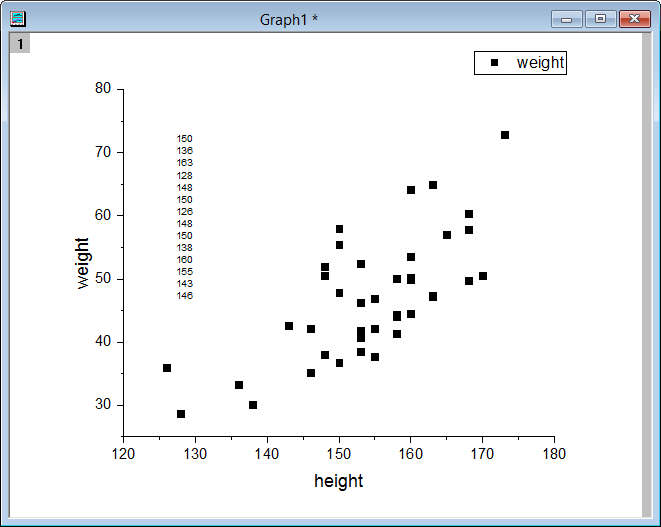
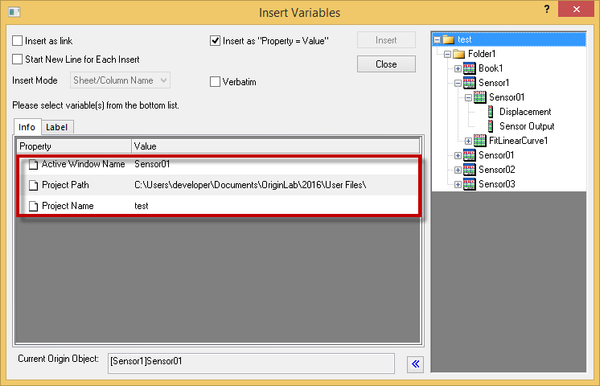
Easier Way to Annotate Graph with Data or Label in Worksheet and Project&Window Information | Support inserting variables from worksheet cell into text (only for graph) Add a button in Insert Variable dialog, which can hunt worksheet cell and then insert it:
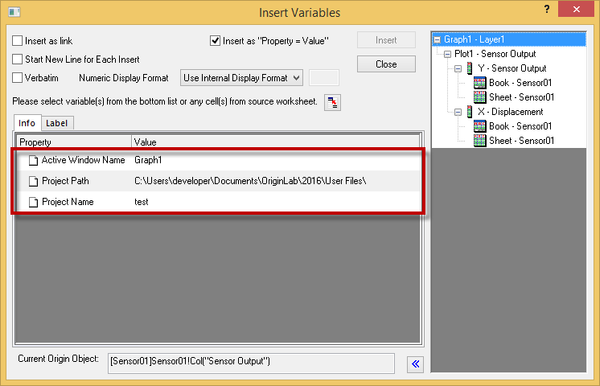
Additional Info (%G, %X, %H) in Plot level for Insert Variable Dialog In the Insert Variable Dialog, if the root folder(root node) of the worksheet(graph) on the right panel is selected, we are able to insert: 1. Active Window Name //%H into the graph or worksheet. Worksheet insert variable dialog:
Graph insert variable dialog:
| |
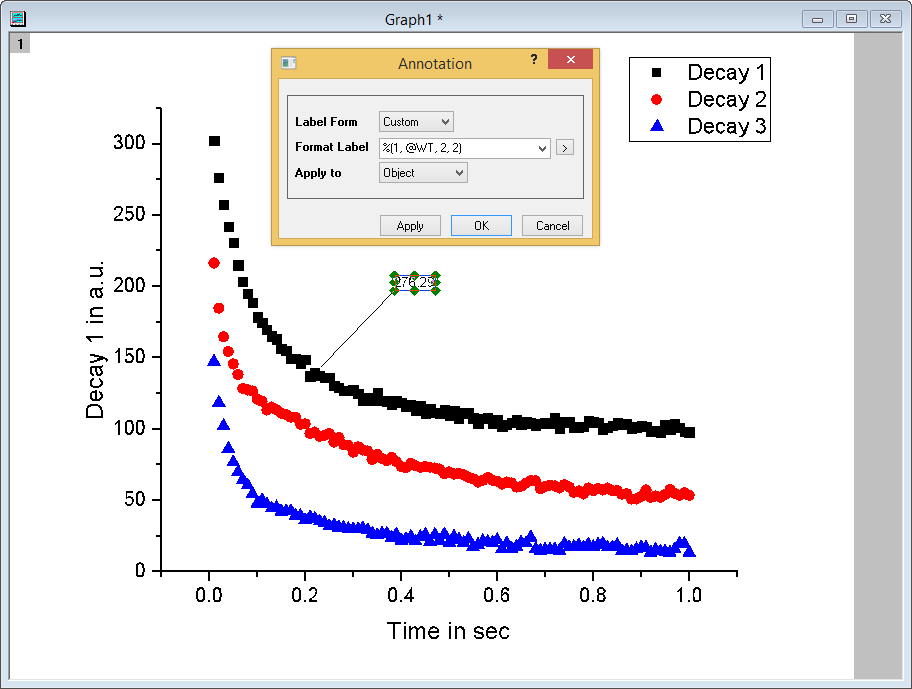
| ORG-6449 | Annotation Tool: Customize Display Label, including metadata support, etc. | Allow to customize the format of the annotation added to the plot. It is available for 2D XY plot and polar, and contour from both XYZ data and matrix. How to...
|
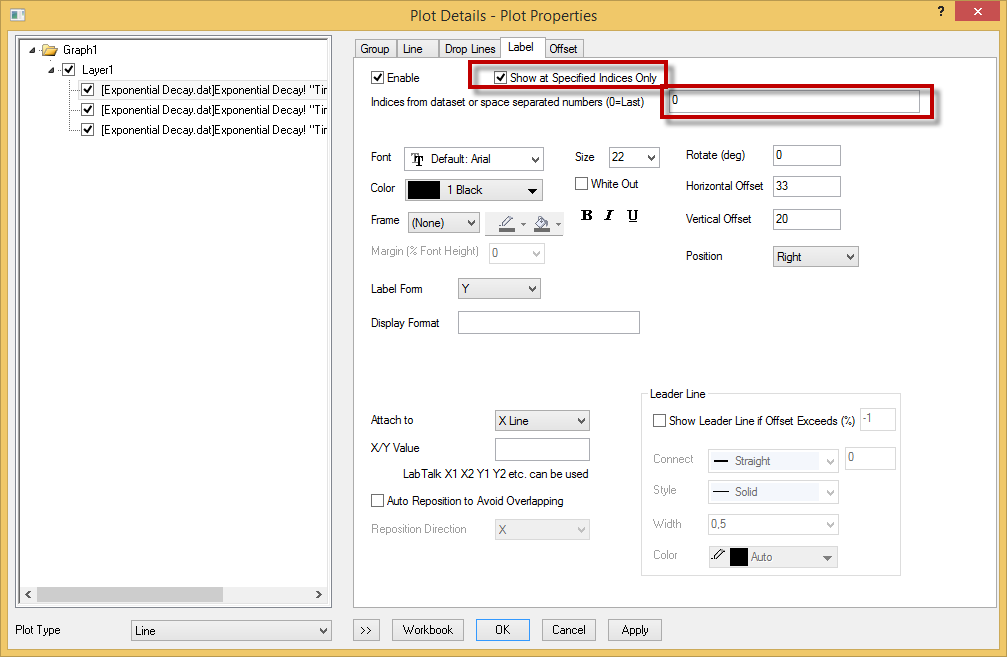
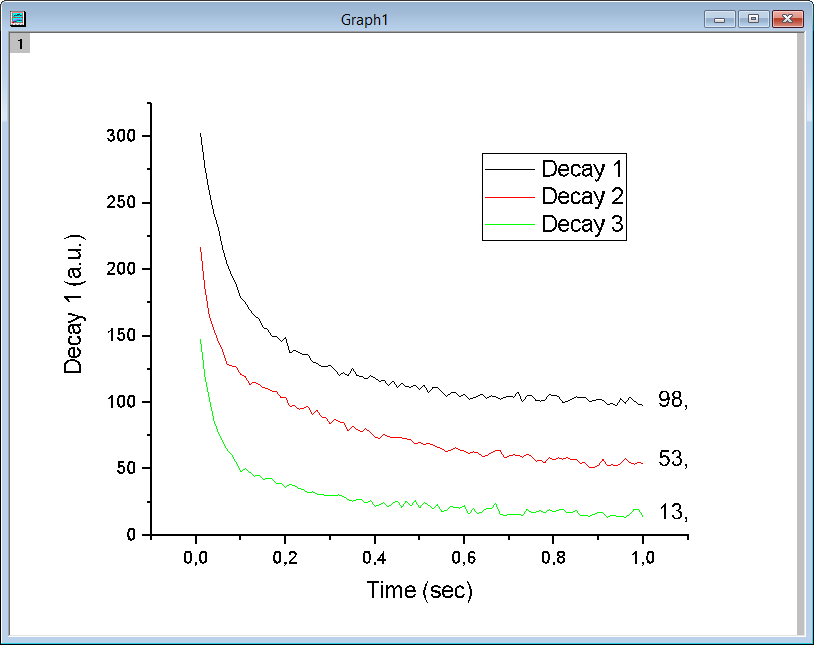
| ORG-10446 | Data Labeling on Indiced Points Only and More Label Format Controls | Show Legend along Plot by Attaching Data Label on a Single Point or several points
|
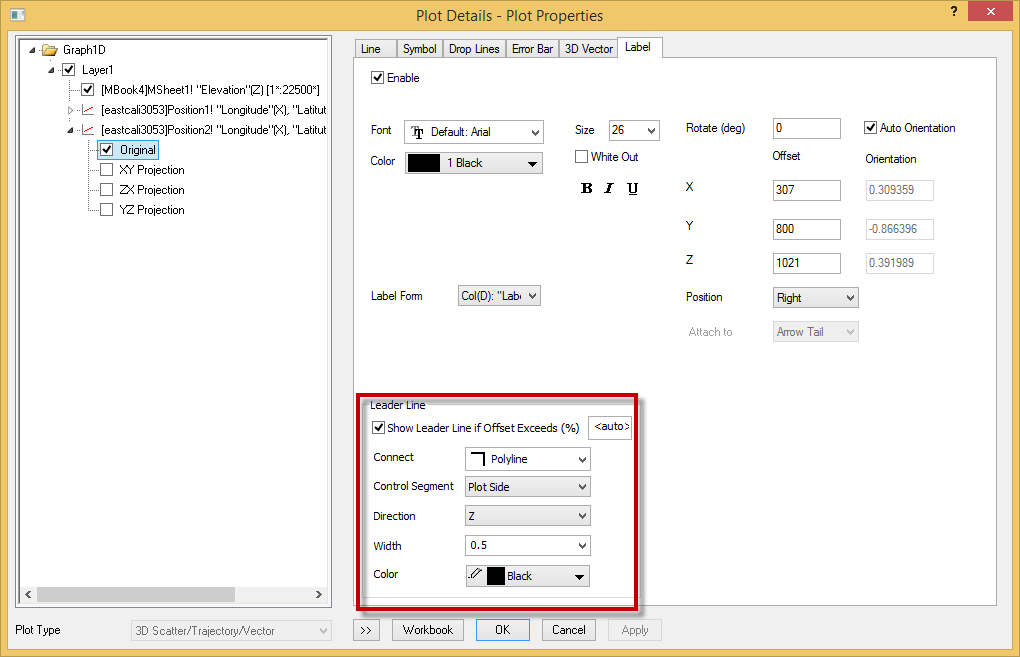
| ORG-12227 | GUI for leader line in 3D plot label | Add GUI to allow the access to the leader line setting Color, width, direction, shape of the leader line in 3D plot can be changed.
|
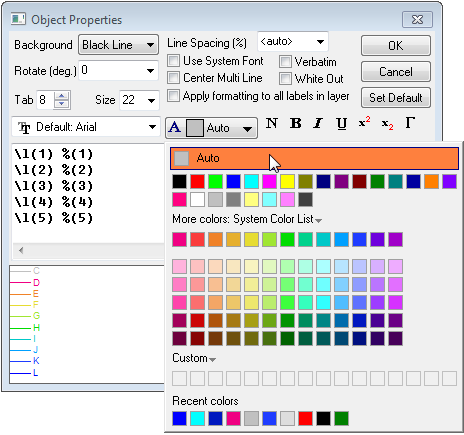
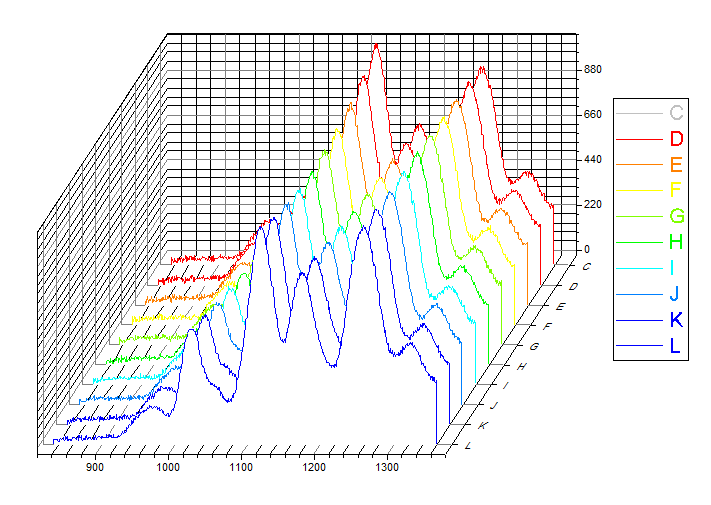
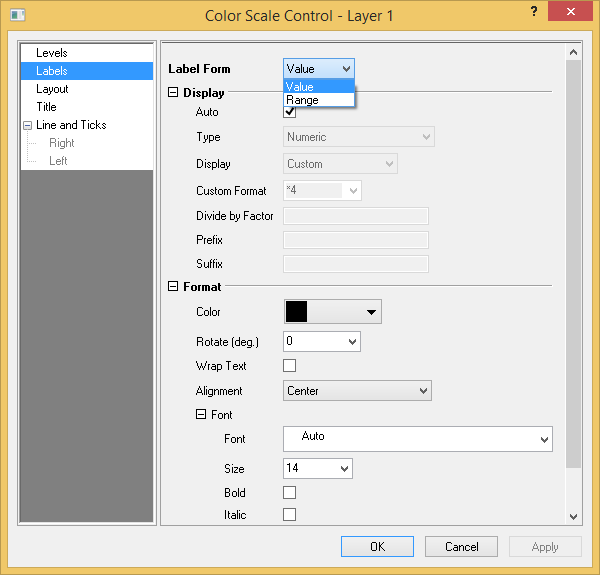
| Legend and Color Scale improvements | Legend text follow legend symbol color. Also works for color scale. right click legend to enable object property. Setting color to Auto will have the color of the label follow the color of the symbol. This is also support for regular text label. If there is %(n) substitution notation(s) and color is set to Auto, it will use the 1st substitution notation's corresponding plot's color for the whole text
Also works for color scale label
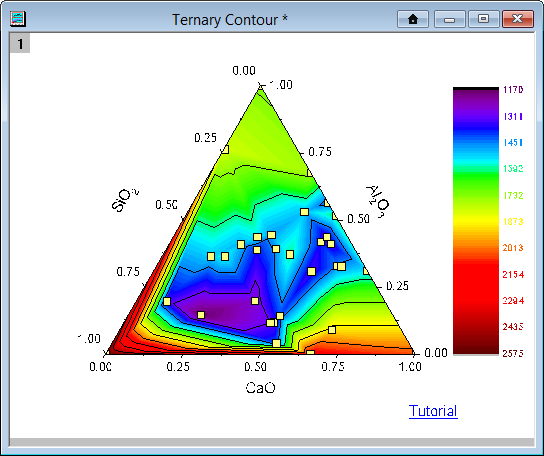
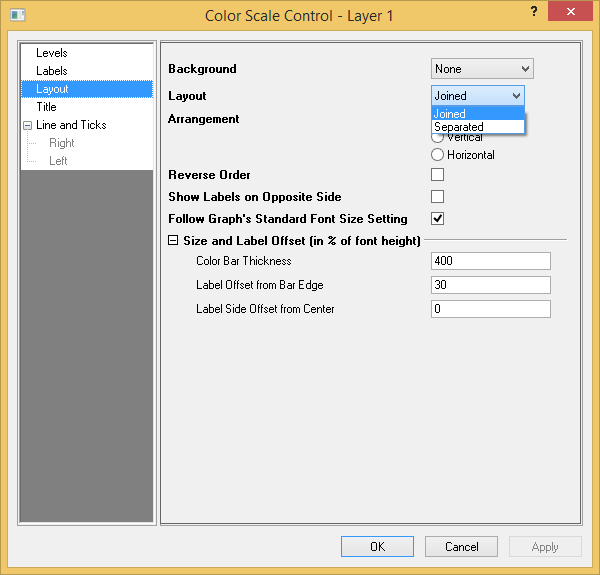
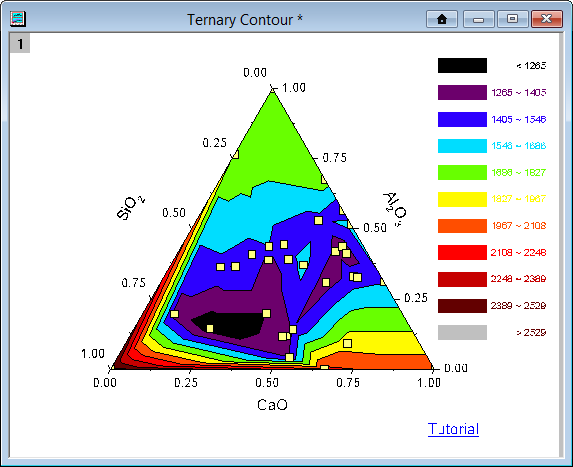
Show color scale as blocks of colors and their corresponding range
2. Allow color bar to be separated.
3. the result:
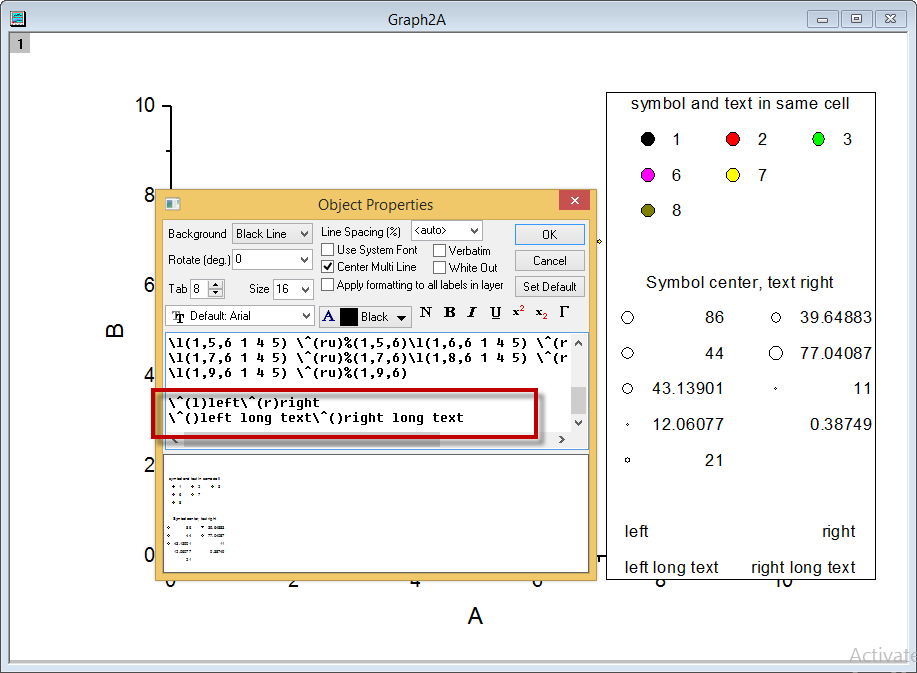
Notation to Alignment different portions of text in multiple line add "\^()" as cell anchor, use alignment from the whole text object "\^(l)", "\^(c)", "\^(r)" are LEFT, CENTER and RIGHT alignment respectively. "^(lu)" means the text before and after this anchor is a unit, the part before and the part after will not be added extra space by drag and control. But the part before and after "^(lu)" will still consider the alignment separately, like it contain 2nd level.
| |
Plot Manipulation
JIRA | SUMMARY | DETAILS |
|---|---|---|
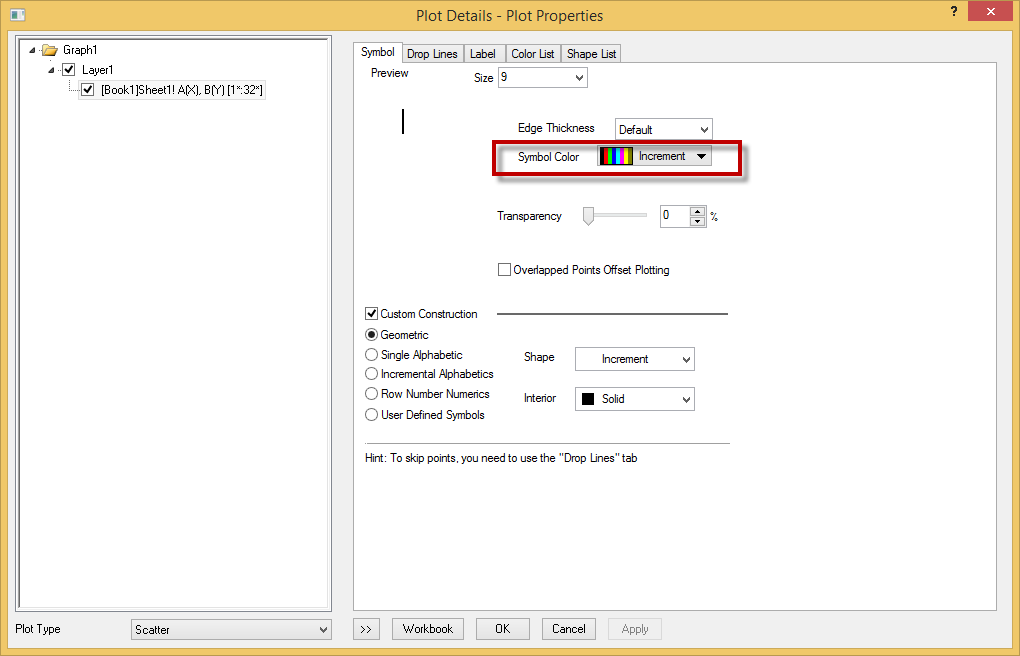
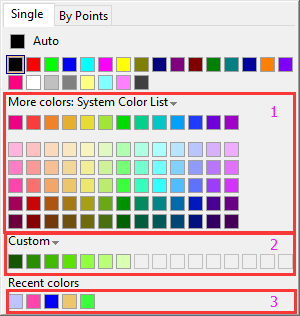
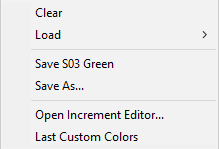
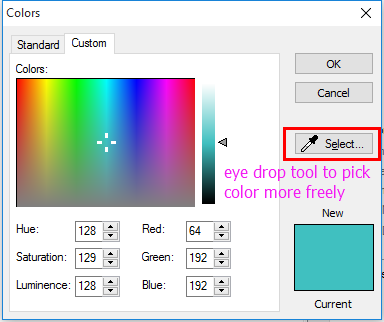
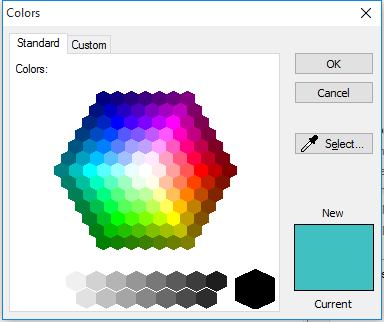
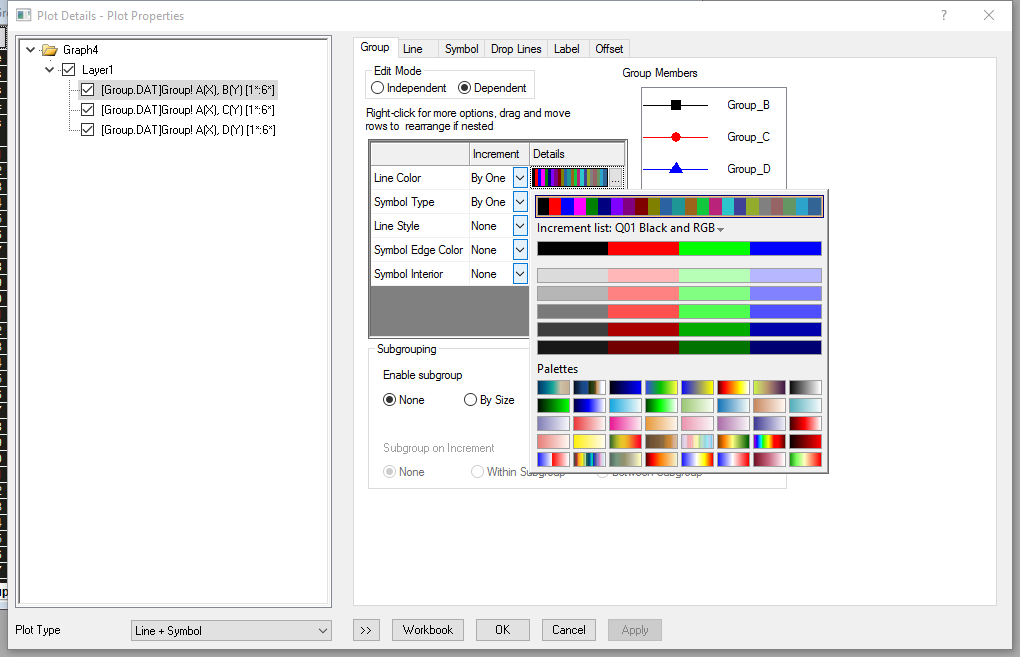
| ORG-373 | New, Powerful Color Chooser: Larger Color Collection, Easier Way to Pick Custom Colors, and Recent Colors | New Color chooser for all elements in Origin that supports color customizatin, such as plots, axis, text labels, graphic object, cells in worksheet, etc.
Color button-menus for various type of single plot is improved:
Custom dropdown list: User can load increment color list, save user's own color list and edit existing color list, etc. Customer color dialog is improved. Add eye drop tool so that user has more freedom to choose color any where on the screen
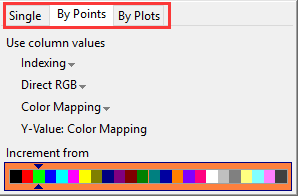
Users can customize the color of the plots through toolbar control icons and the tab style color selection fly-out offers user more options for color control of the plots. By Points tab:
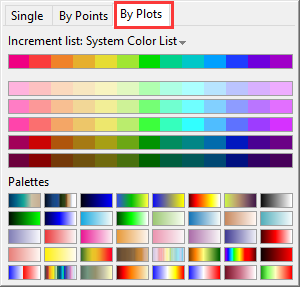
By Plots tab:
3. The increment list or palettes for "by plots" coloring can also be adjusted in the group tab in plot detail dialog.
|
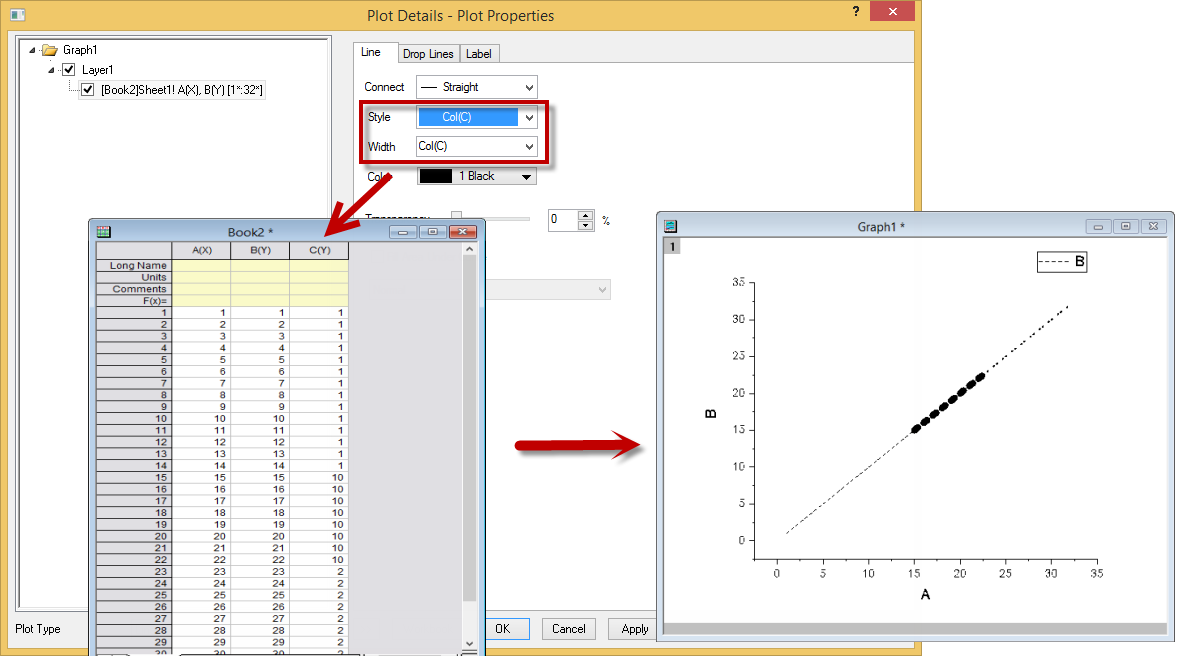
| ORG-12624 | Map line style and line width to another column | In the plot detail dialog, can set the style and width of the line to be mapped to a column.
|
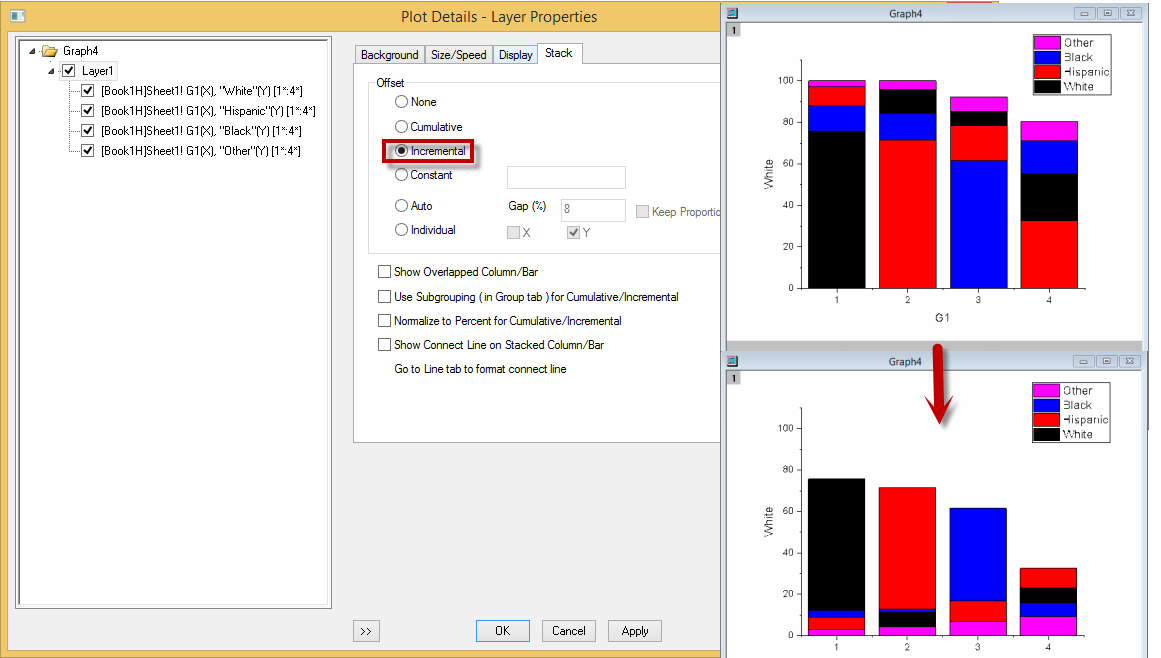
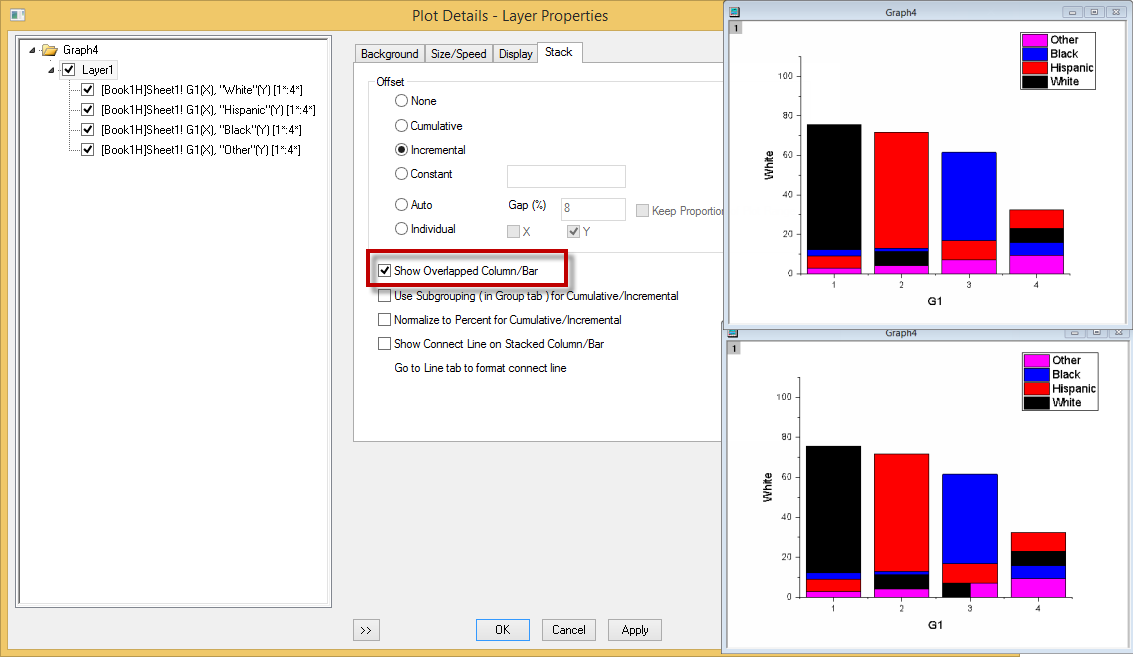
| ORG-7873 | Allow sorting column sets even when cumulative is None | Add Incremental option in Plot Detail dialog under Layer level allowing draw small blocks first.
If two blocks are of equal size, can let them show side by side by check the "Show Overlapped Column/bar" box.
|
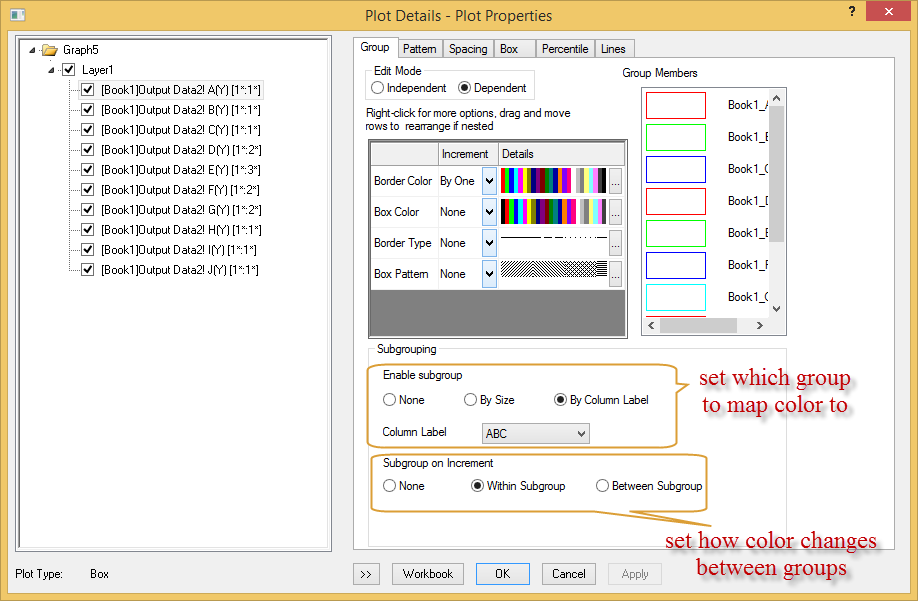
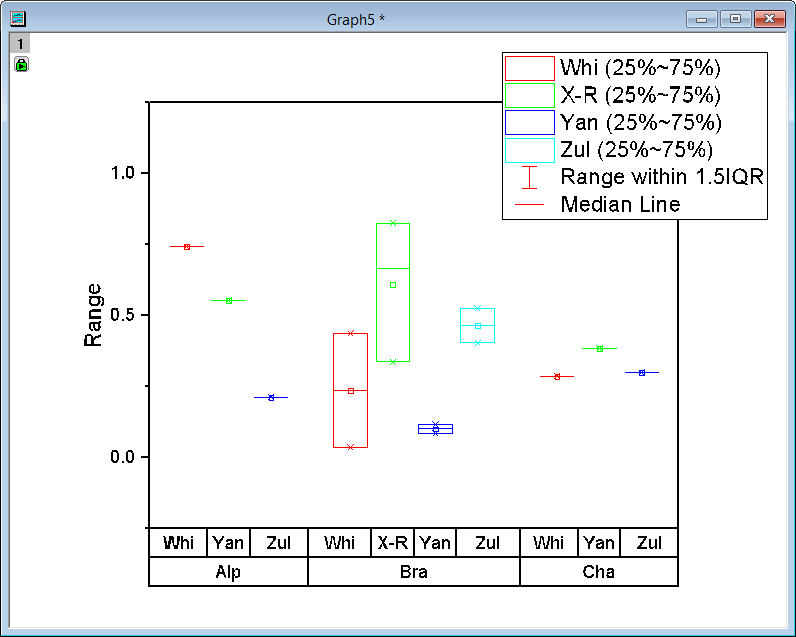
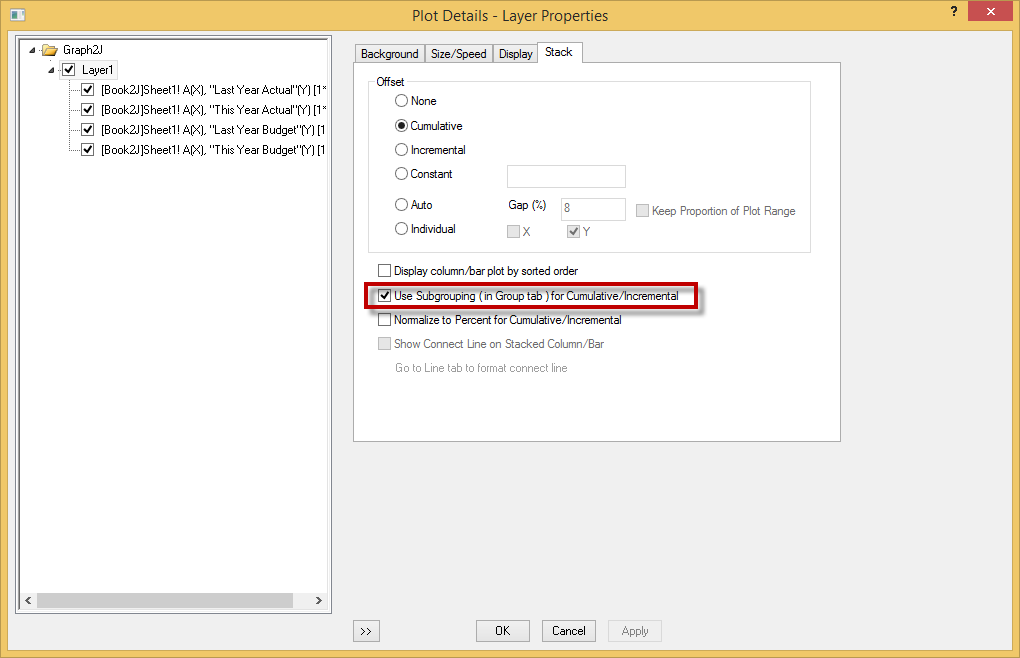
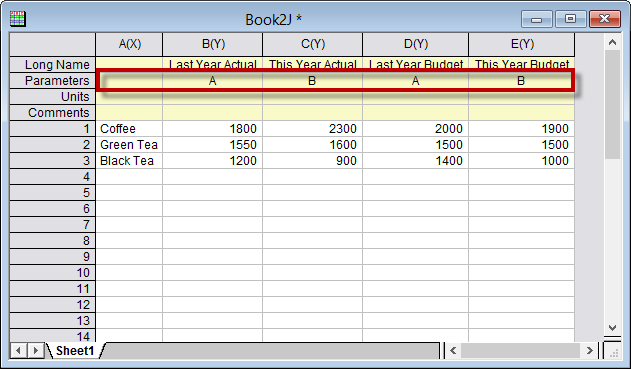
| Box chart\bar\column plot improvements: allow map color to groups defined through column label | Specify subgroup according to its column label In the plot detail of grouped box chart plot, allow the color of the box to map to which level of the group which is very useful for dataset with unbalanced group size.
2. If color is set to vary within subgroups:
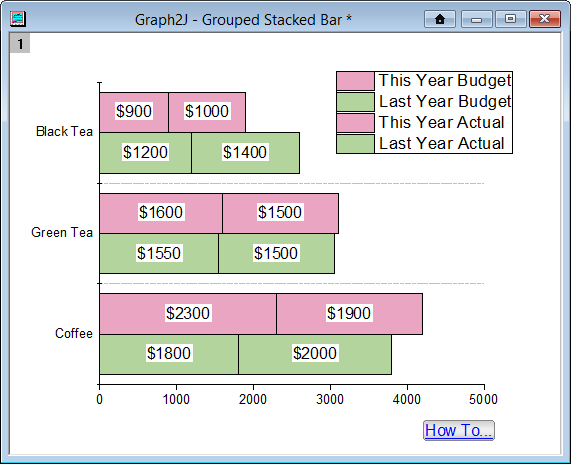
Stack plot support groups defined by column label In stack column/bar plot, if subgroup is set based on column label, then we can have the column/bar to stack based on that subgroup. In this case, subgroup are set based on "Parameters" .
The resulting bars are colored and stacked based on this subgroup.
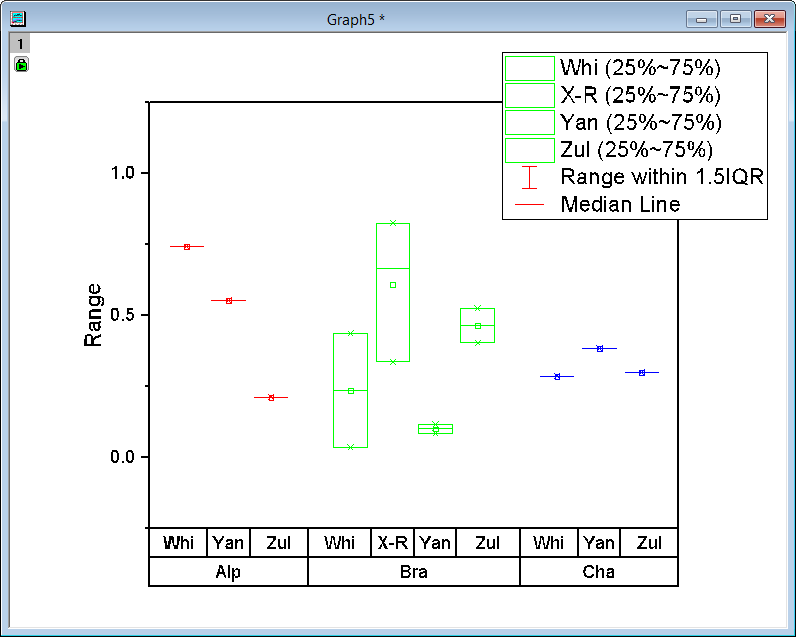
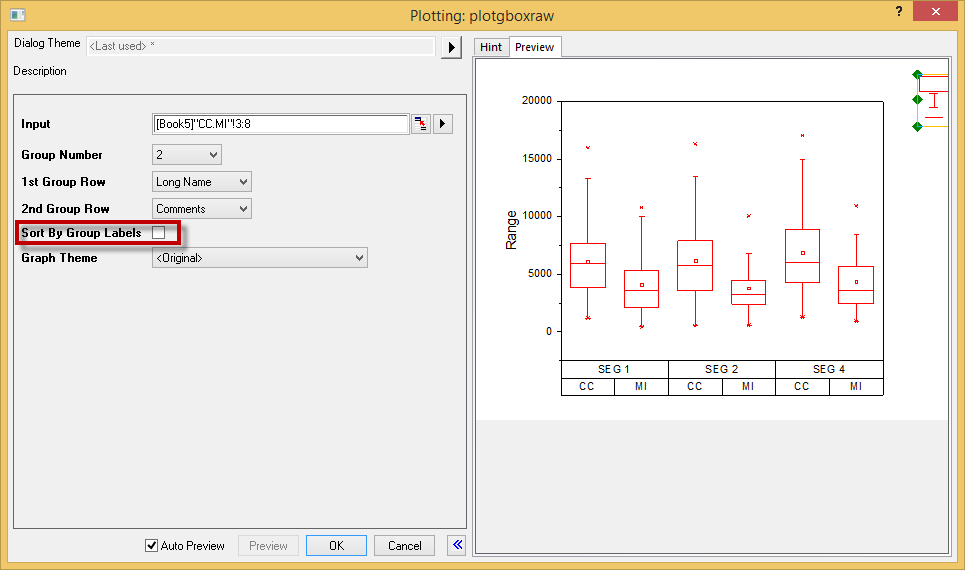
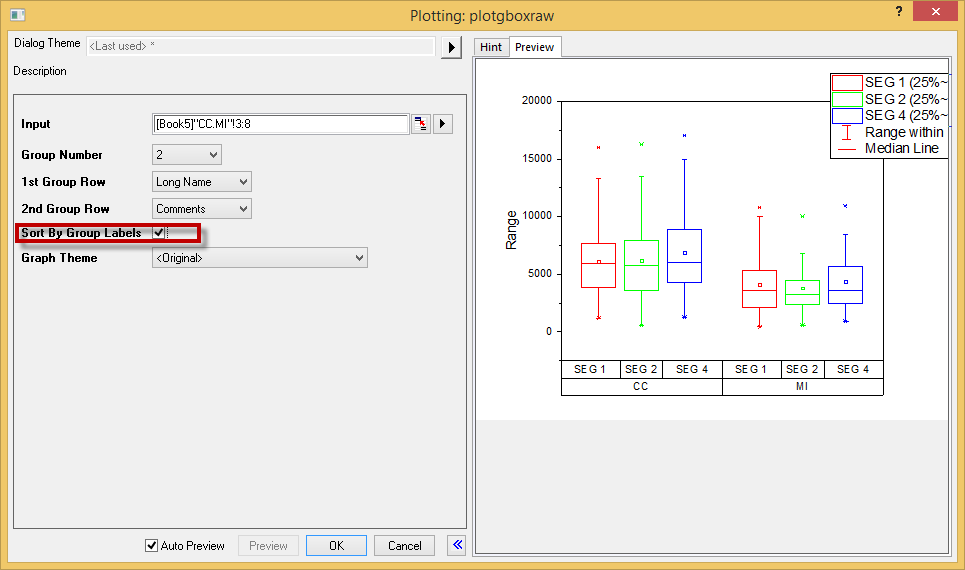
Grouped box chart plot from raw data can sort plot order by group info Add a check box "sort By Group Labels" to allow nested sorting of the box labels: Before sorting, boxes are ordered by appearance order.
After sorting, boxes are ordered alphabetically on each group label.
| |
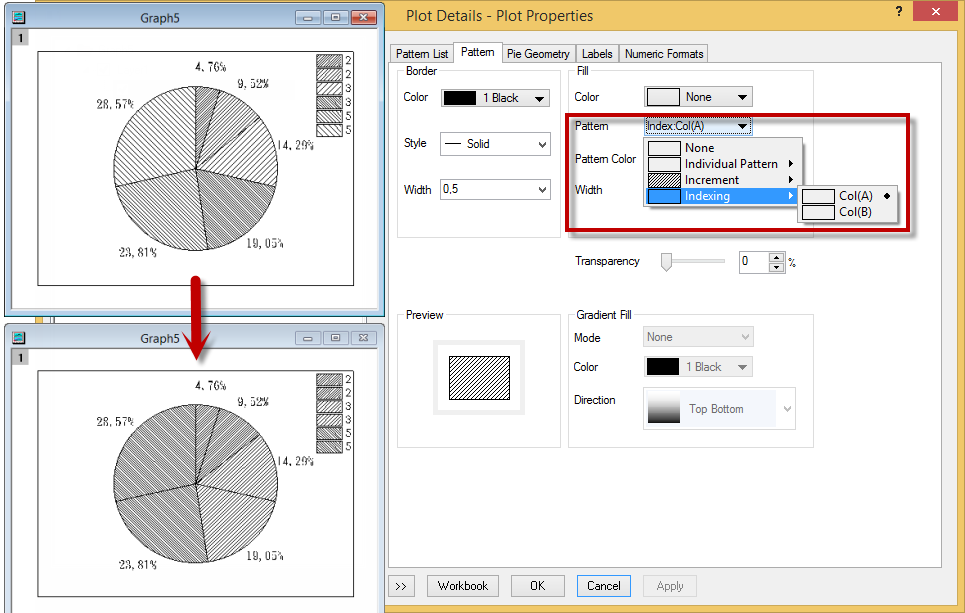
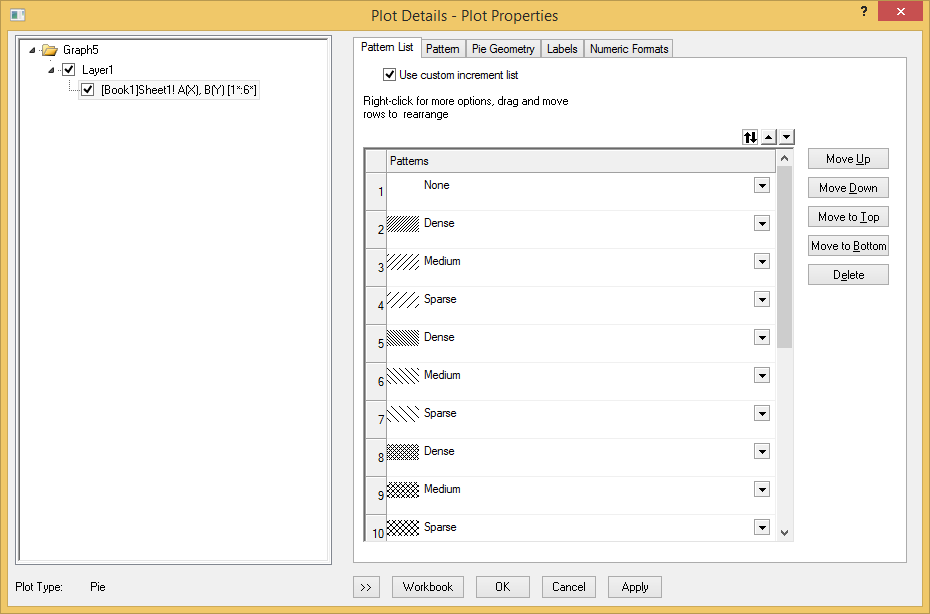
| ORG-9556 | Fill Pattern needs to support custom list | Under the Pattern tab in plot detail dialog, user can set the filled pattern with index referencing to other dataset.
A new tab "Pattern List is" is added when increment or indexing is selected in fill pattern where user can customize the pattern list.
|
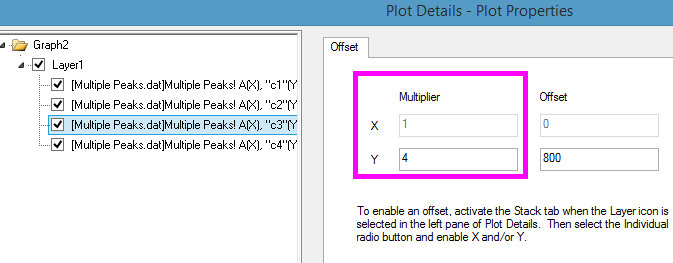
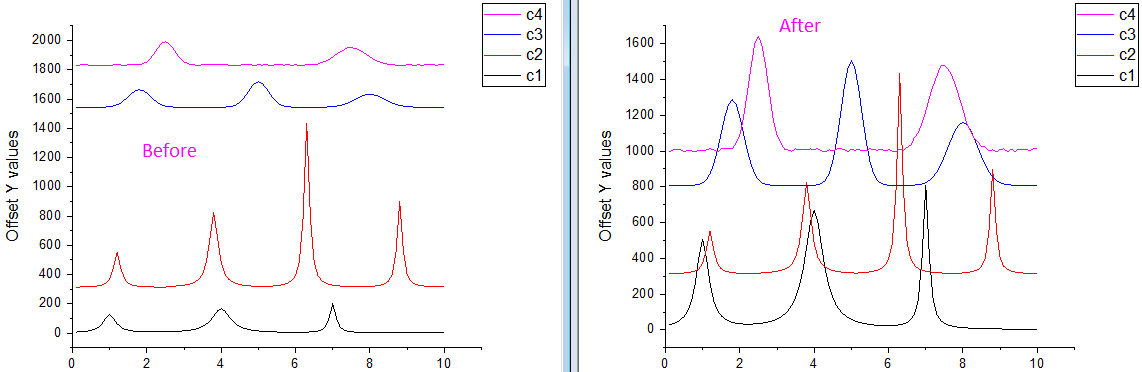
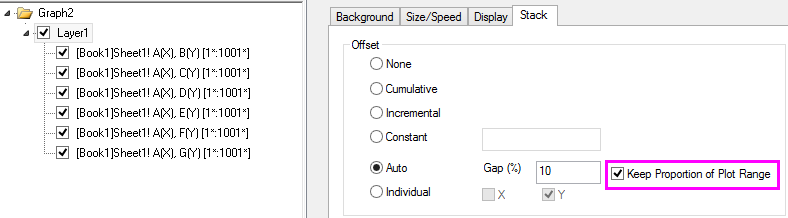
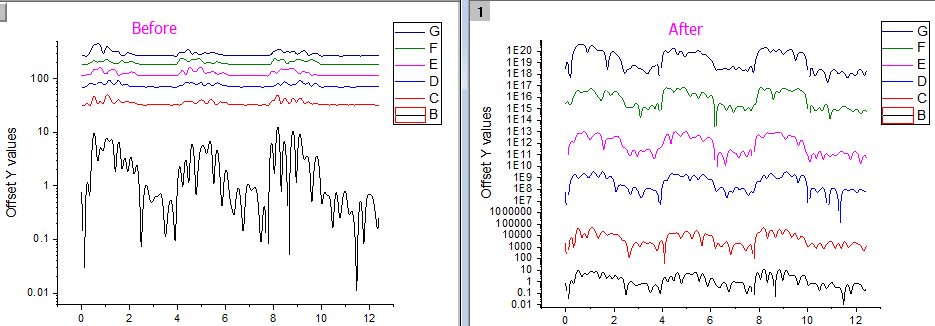
| ORG-4856 | Stack Line by Y Offset with Scaling Factor and Log Scale Support | Add scaling factor for both X and Y directionSet Multiplier for each plots to enlarge some details.
Keep Proportion of Stack Lines by Offset on Log ScaleBy checking Keep Propertion of Plot Range, user can still see details of each stacked plot on nonlinear log scale.
|
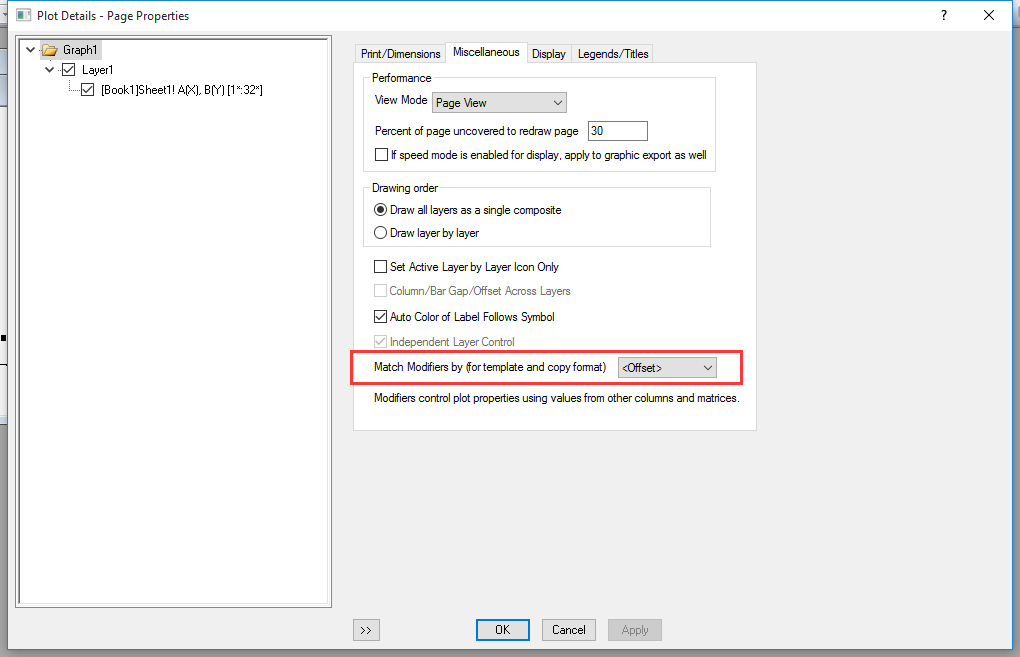
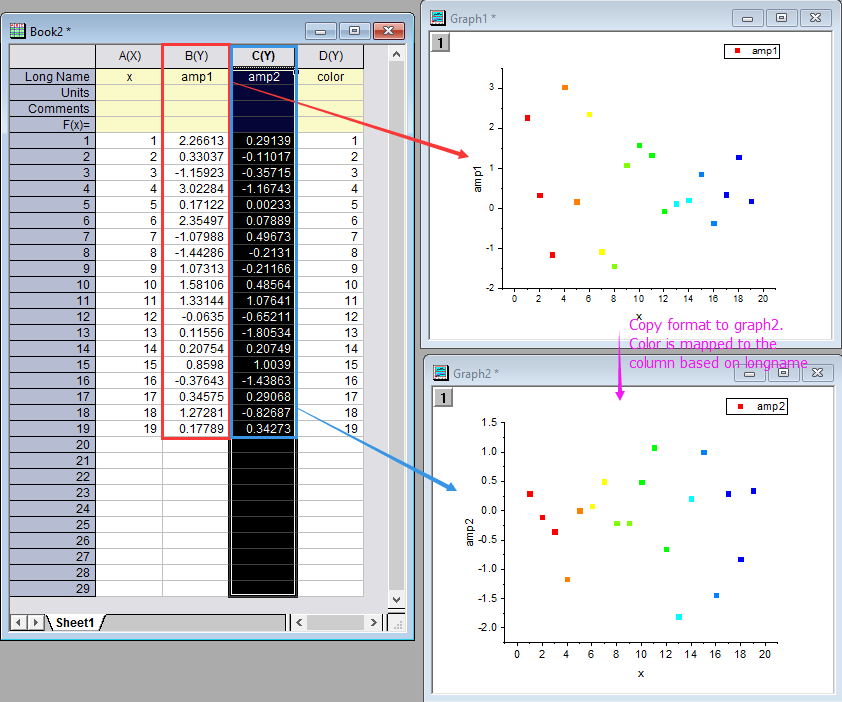
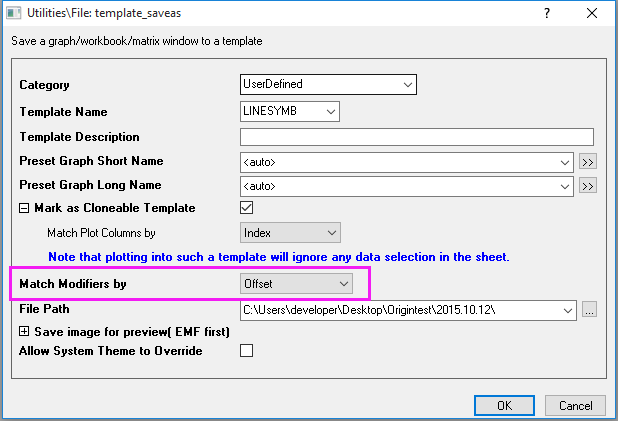
| Template-Support using column name when mapping color to a column | Under the Miscellaneous tab in the page level dialog of the graph, add the option Match modifiers by( for template and copy format) that allow users to customize the modifier mapping method when copy format and plot with template. Users can fetch the modifier column by <offset> ,longname , shortname, etc.
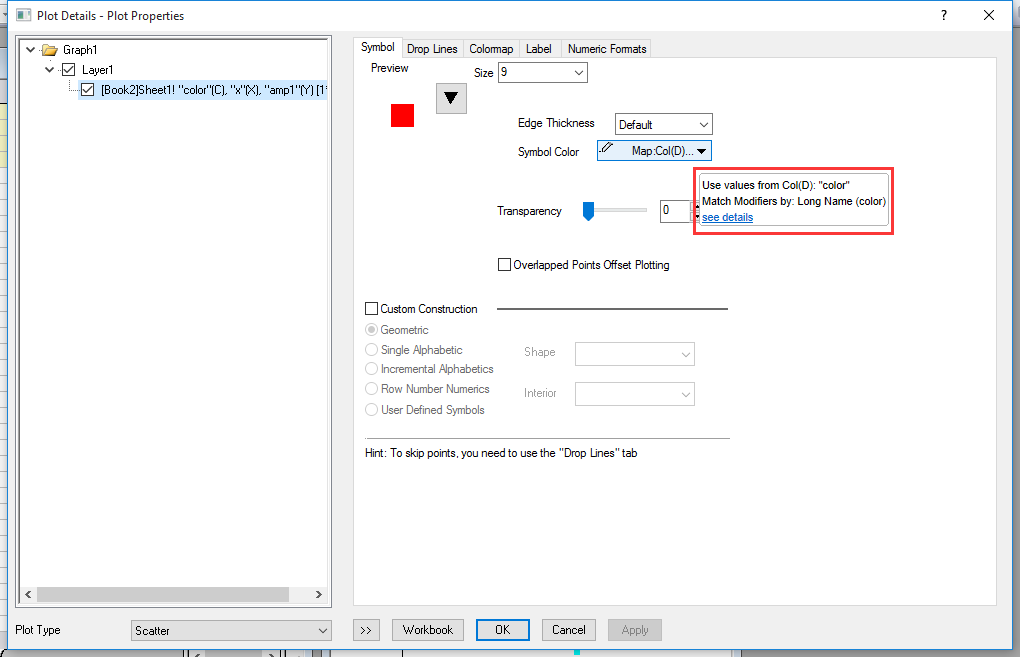
In this case, two plots are made from col(B) and col(C). In Graph1, the color of the points are mapped to col(D) with longname color. Setting Match Modifiers by to longname makes the plot2 colormap to the column with the same column longname, col(D) in this case. If set Match Modifiers by to <offset>, the color mapping column will be specified by the relative position to the plotting column.
The tooltip in the plot detail dialog of the plot shows the modifier match method.
| |
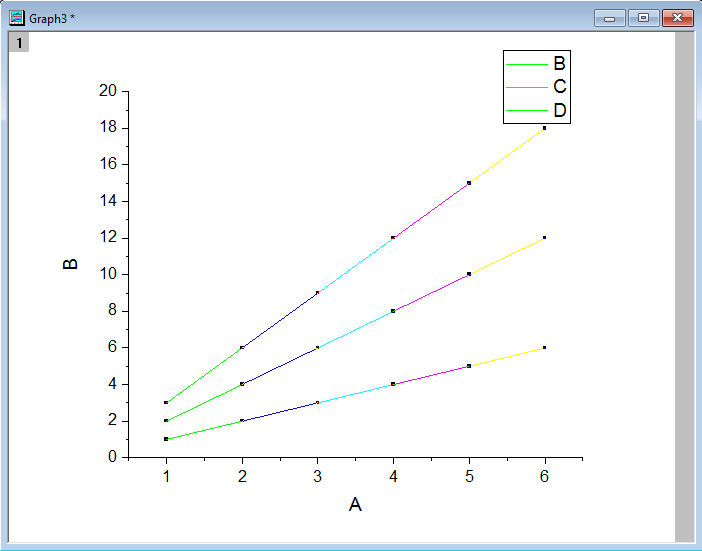
| ORG-13741 | Y-Value Colormapping for Scatter, Column/Bar, Area Plots | Y-Value color mapping was only supported for line plots including waterfall plots. Since Origin 2016, we added it for plot plot types that support colormapping. E.g.
When using Y-Value Color Mapping. Origin find the min and max of all Y plots in the group and build colormap levels. On Plot Details dialog, you will see on Group tab, color's Increment column is set to None, while on Symbol tab, Symbol Color is set to Y-Value: Color Mapping. On Colormap tab, the Levels are from min to max of all Y columns in the group of plots. For column/bar or area plots, the color control is on Pattern tab. |
Graph Page and Layer
| JIRA | SUMMARY | DETAILS |
|---|---|---|
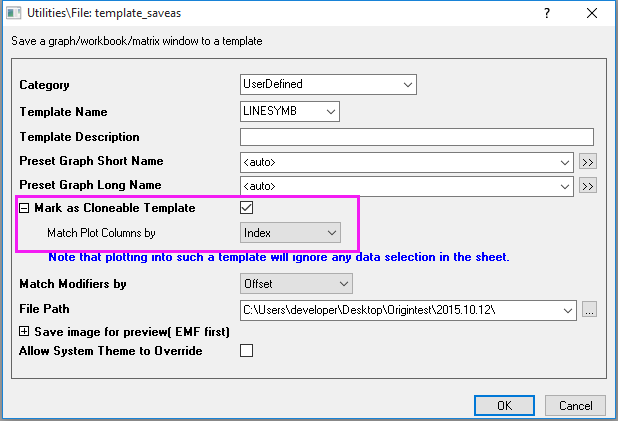
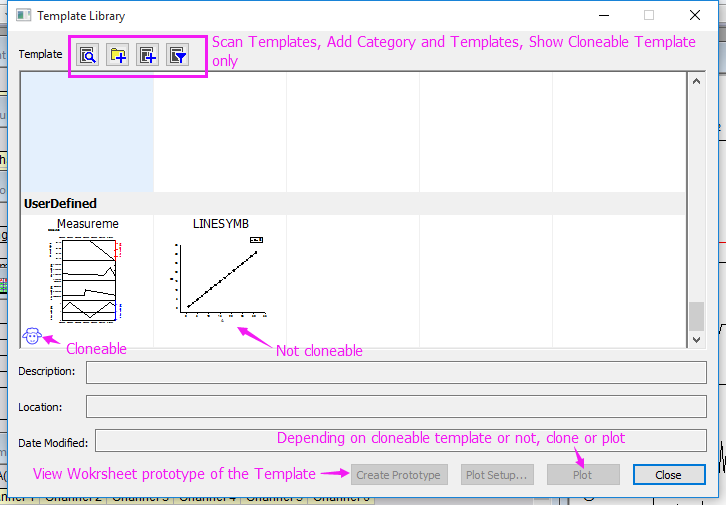
| ORG-12495, ORG-12522, ORG-13209, ORG-13664 | Smart Plotting from Cloneable Template and New Template Library | Save Template As Dialog Changes
|
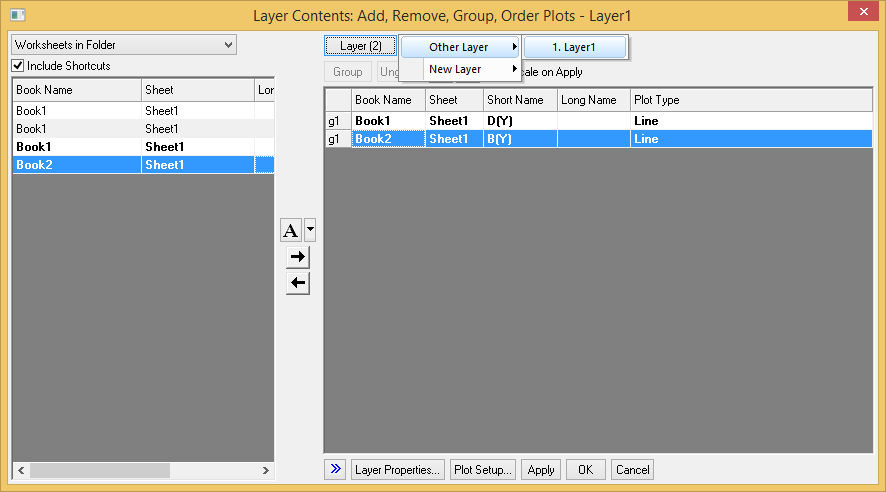
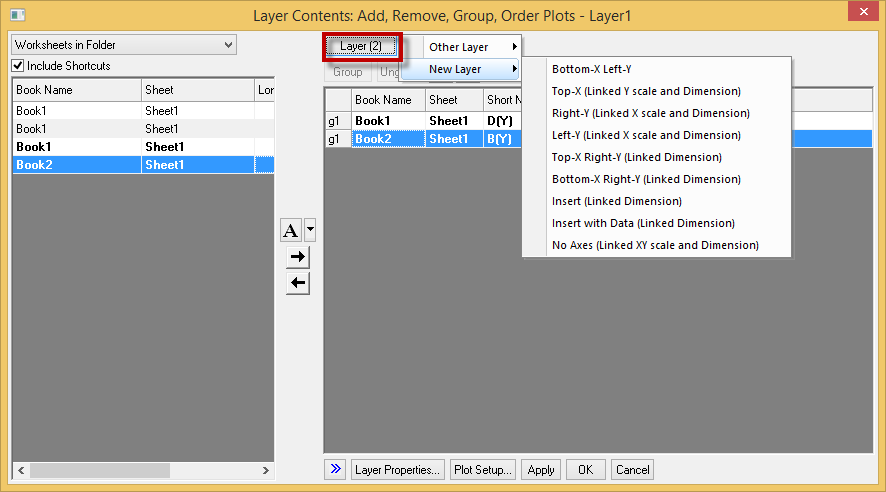
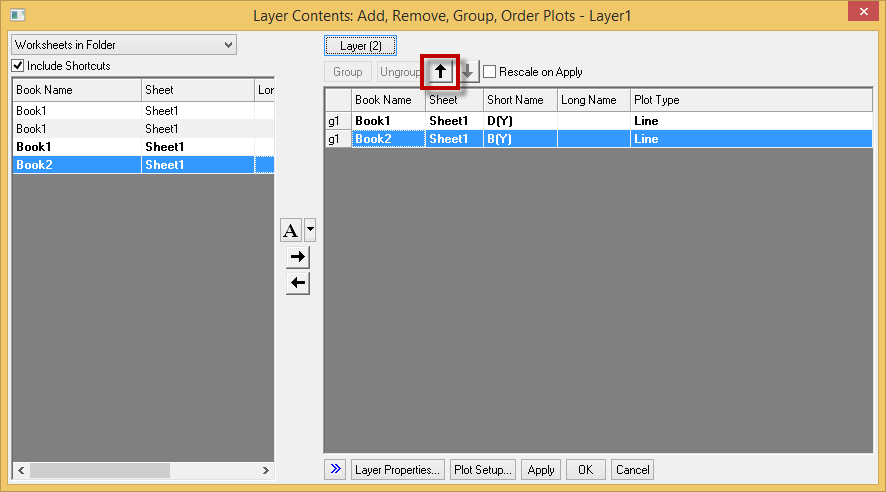
Switch Layer or Create New, and Move Plot Order in a Group in Layer Contents Dialog | Switch Layer or Create New to easily add or remove plots on different layers in graph
Change the order of plots within a group Change plot order within a group with no need to ungroup first
| |
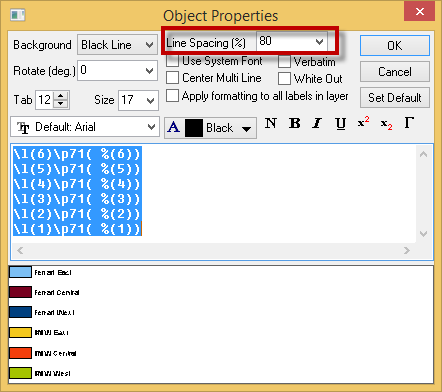
| ORG-11447 | Adjust Line spacing between lines in Text Object | Adjust line space between lines in Text Object including Legend Change the line spaces in the properties of text object:
2. The gap between lines is enlarged.
|
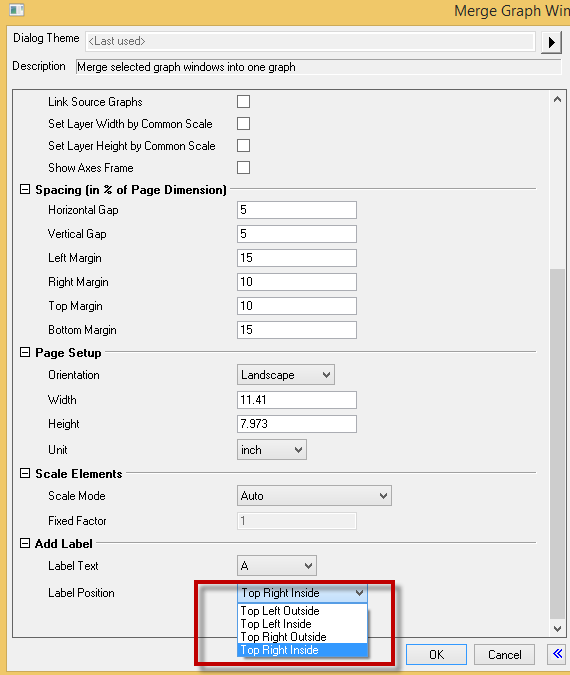
| ORG-12944 | Allow Labels on right side when merge graph | When merging graphs, now allow to put label to different positions of the plot. inside or outside, left or right.
|
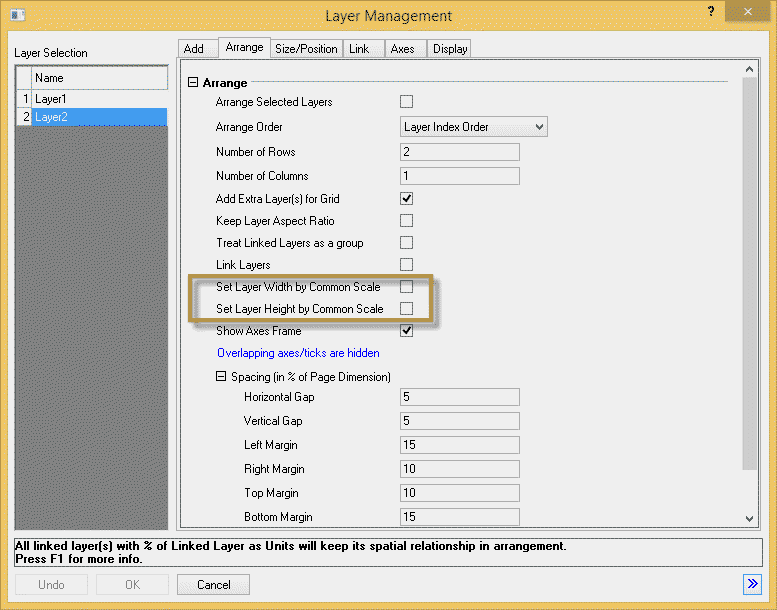
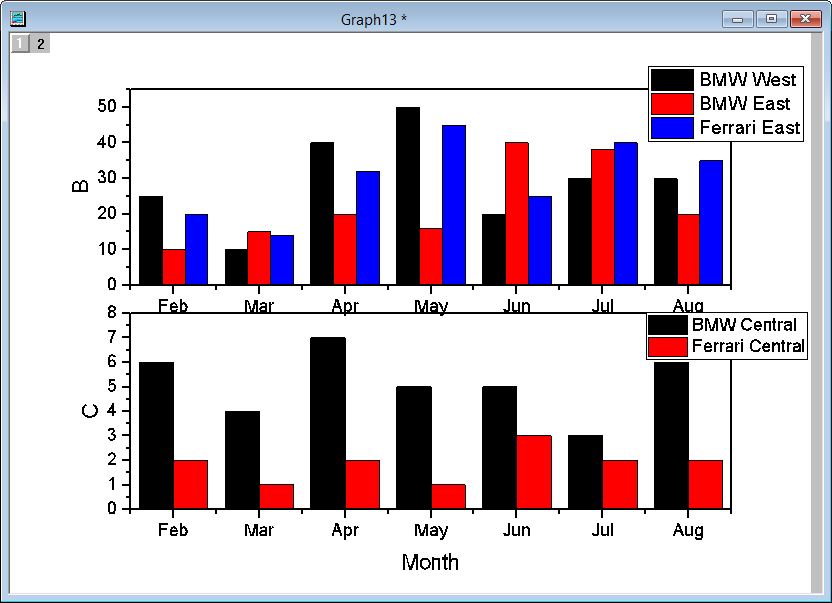
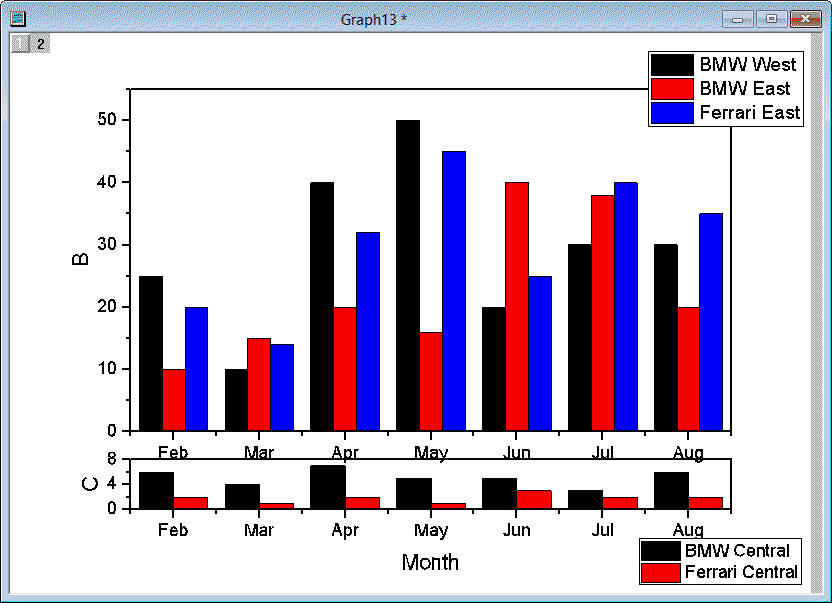
| Multi-layer Graph Improvements: Set Layer Width or Height by Common Scale and Align Layers with Specified Value | Set Layer Width or Height by Common Scale In Layer Management and Merge Graph Windows dialogs, check boxes to set layer width or height by commonb scale are added. Before and after setting layer height to common scale.
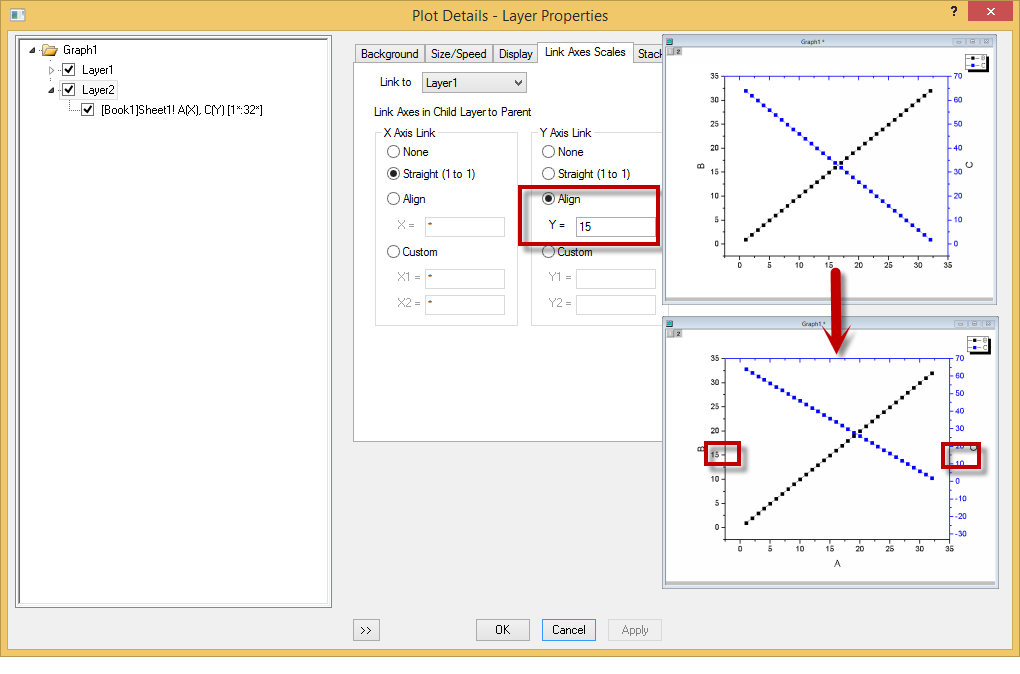
Align linked Layers at Specified Value In Plot Details dialog, when linking Axis, choose Align, Two layers will be aligned at the specified value.
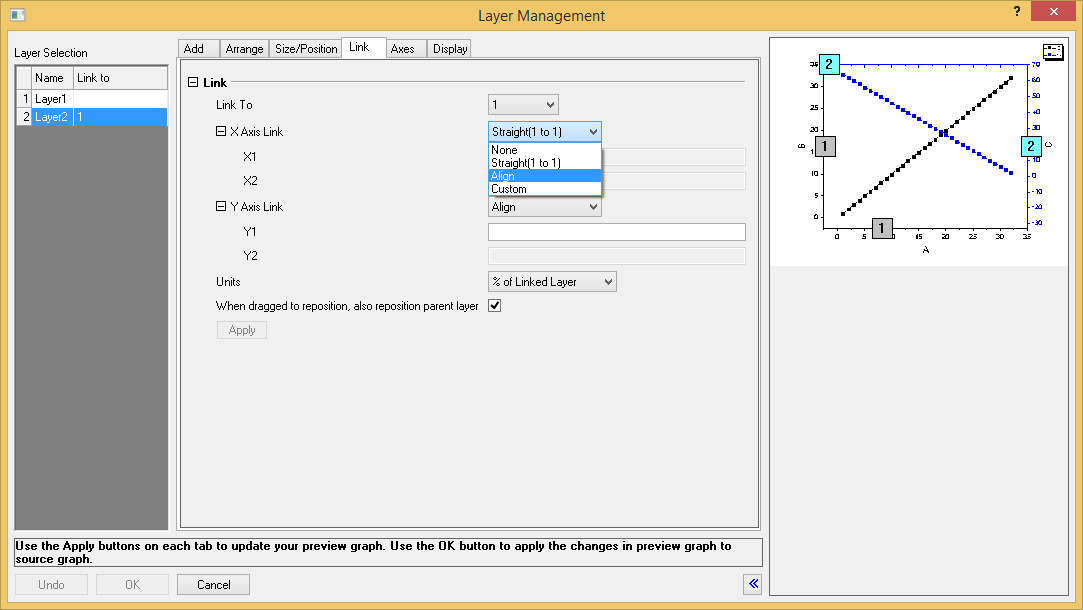
Can also align layers in Layer Management dialog
| |
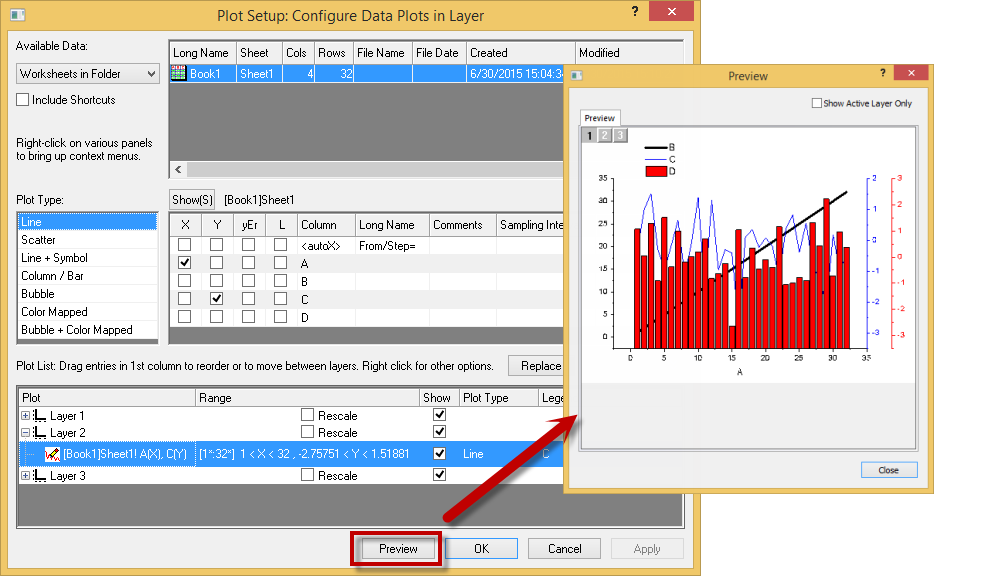
| ORG-12506 | Preview the plot inside Plot Setup | In Plot Setup Dialog, add a Preview button that gives a preview of the plot.
|
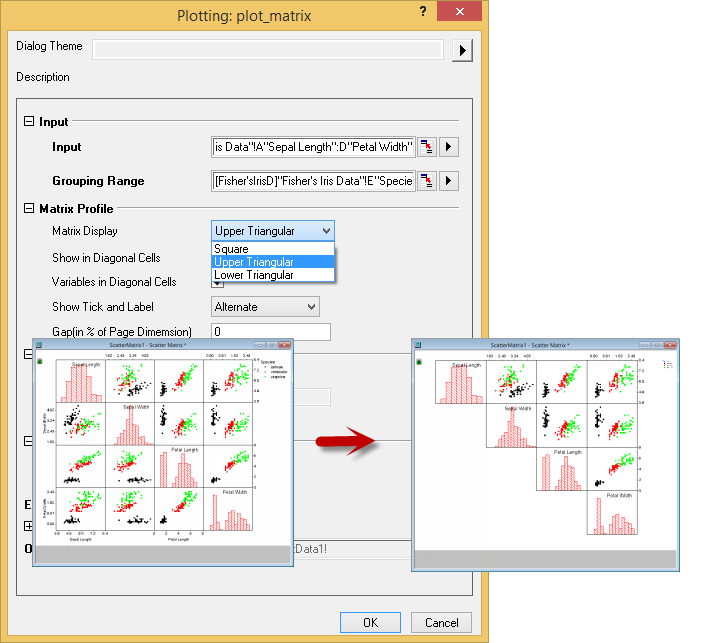
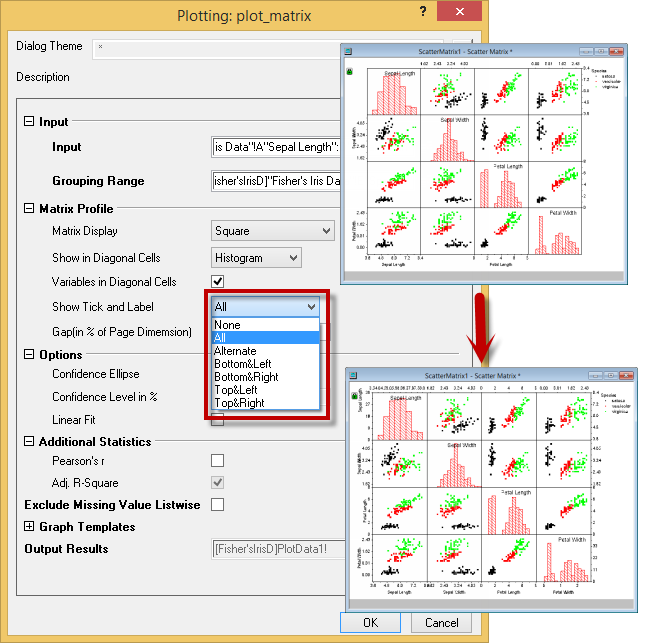
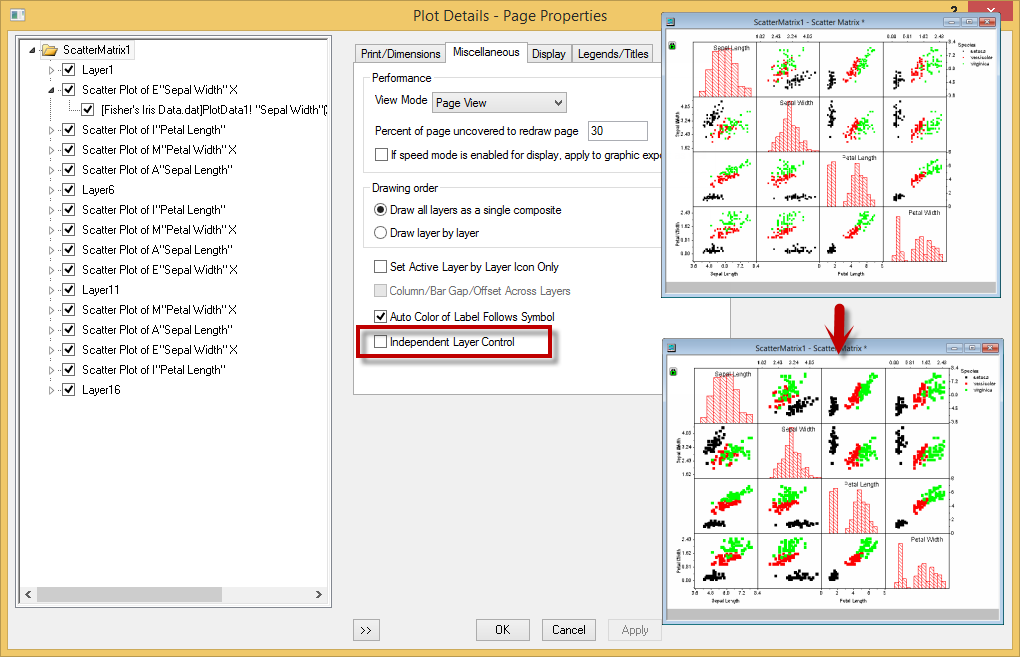
| ORG-12499 | Provide more options for customizing scatter matrix | Support different matrix display method.
More option for tick and label show hide in GUI
Can set whether changing of one layer apply to all the other layers in page level.
|
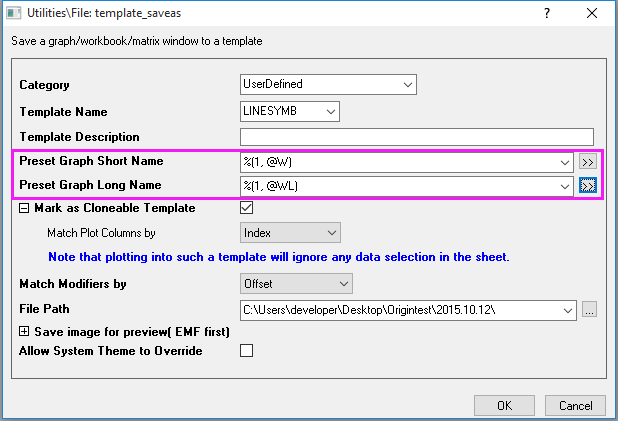
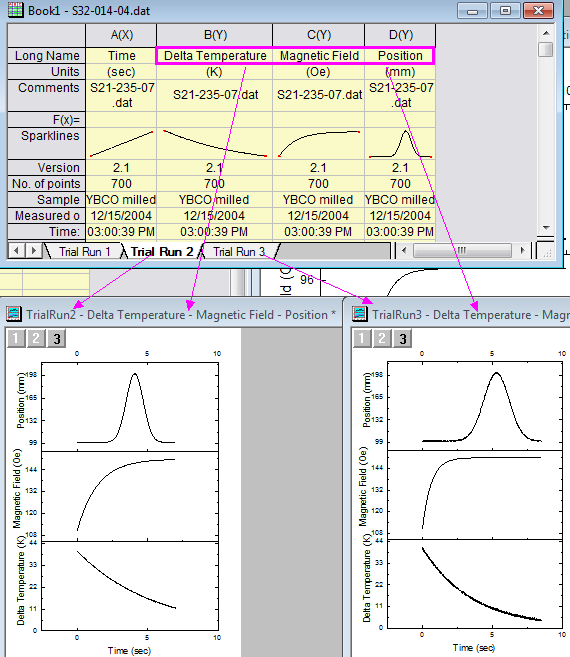
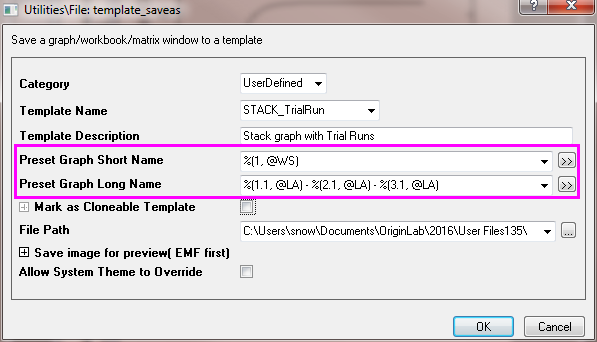
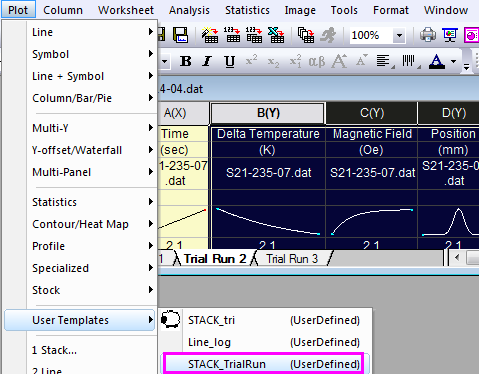
| Set Graph window Short and Long Name during Batch Plot and in Graph Template | Set Graph short name and long name during batch plotting Right click the graph page, select Duplicate(Batch Plotting) to bring up the dialog.
E.g. in image blow, Graph Short Name is set as 1st plot's Worksheet Display Name. Graph Long Name is set as each layer's 1st plot's column long name connected with dash. Corresponding LT syntax shows in the boxes.
2. Select worksheet or columns to batch plot and click OK. Graph names are set accordingly.
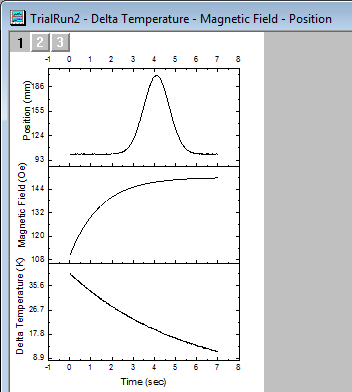
Preset Graph short name and long name in template
When plotting Graph with this template, the graph short name and long name will be set so.
| |
| ORG-12495, ORG-12522, ORG-13209, ORG-13664 | Smart Plotting from Cloneable Template and New Template Library | In Origin 2016, if user mark a graph template as cloneable during saving, user can directly clone a new graph with new data using such template. Save Template As Dialog Changes
|

Axis
| JIRA | SUMMARY | DETAILS |
|---|---|---|
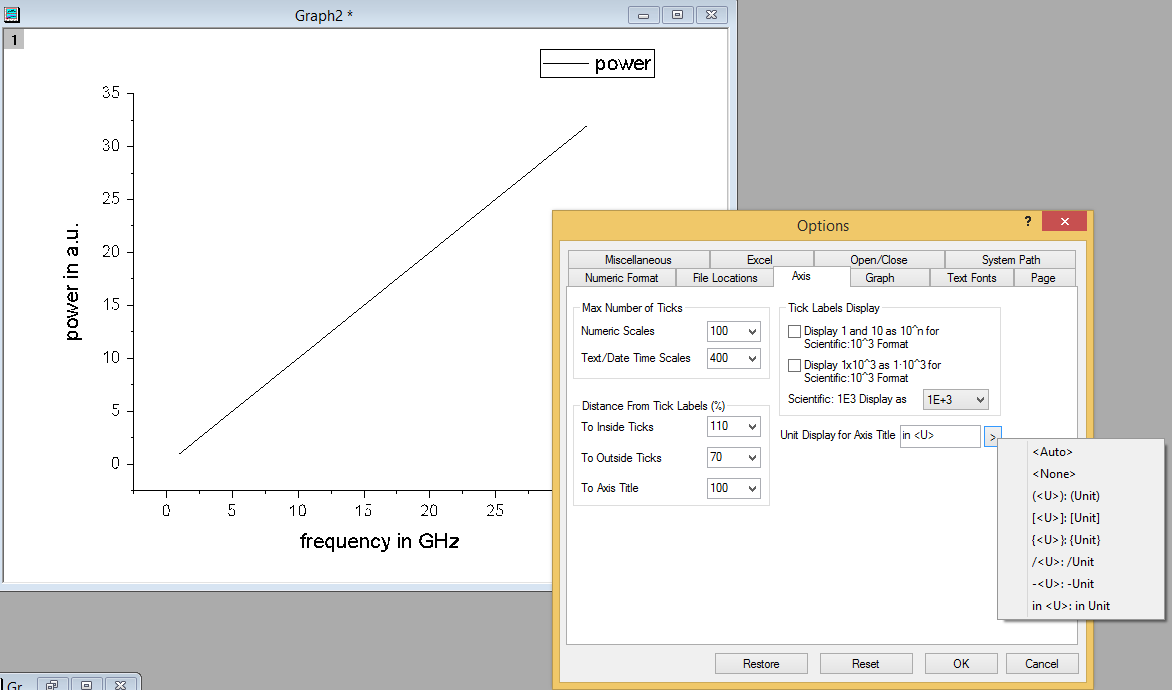
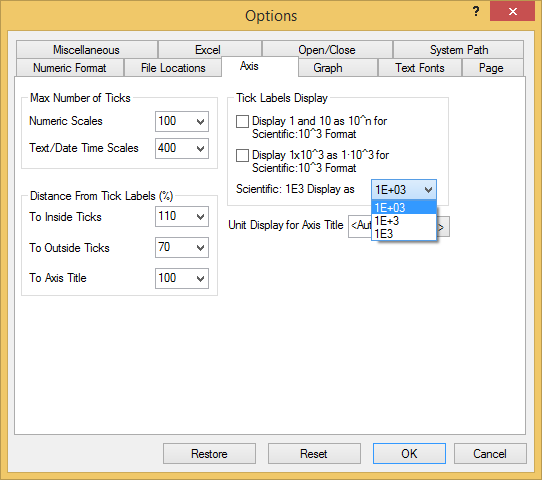
Set Global Axis Units and Scientific tick label Display in Tools: Options Dialog | Various unit formats to choose from in Tools:Options:Axis Different unit format are now supported and can be selected in Options dialog.
More Scientific Format Display Control Different scientific format displays can be selcted in the options dialog.
| |
| ORG-13507 ORG-13703 | Allow Special Tick Labels to be Individually Dragged on Graph to Change Label Offset(s) |
|
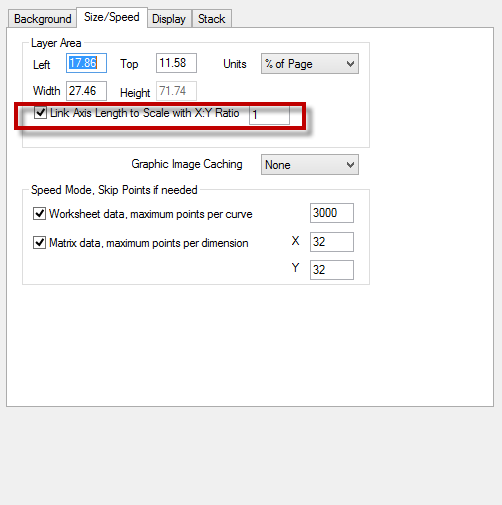
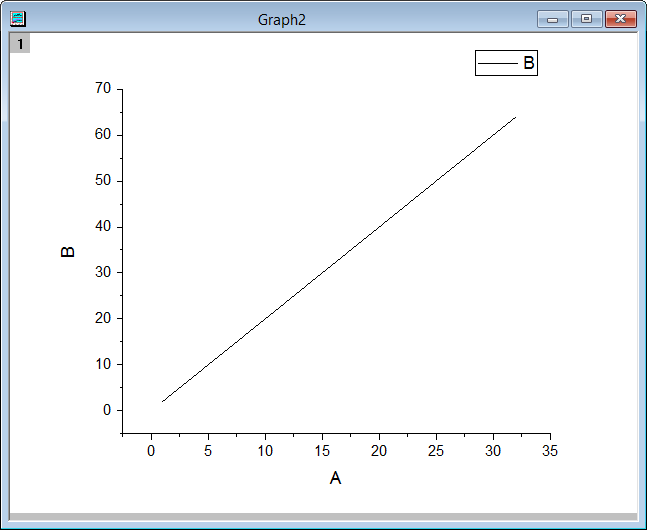
| ORG-12991 | Allow User to set Axis Ratio on Layer level | How to...
2. When the box before Link Axis Length to Scale with X:Y is checked, we can link the graph axis length to the scale by any ratio. Before linking the size to scale.
Set the link ratio to 1, axis length to scale ratio is the same for x and y.  |
| ORG-12898 | Minor tick label improvements | Add Display Format in the Minor Tick labels tab In the past, minor tick label can only use same display format as major tick label. Now it can be set to different format. 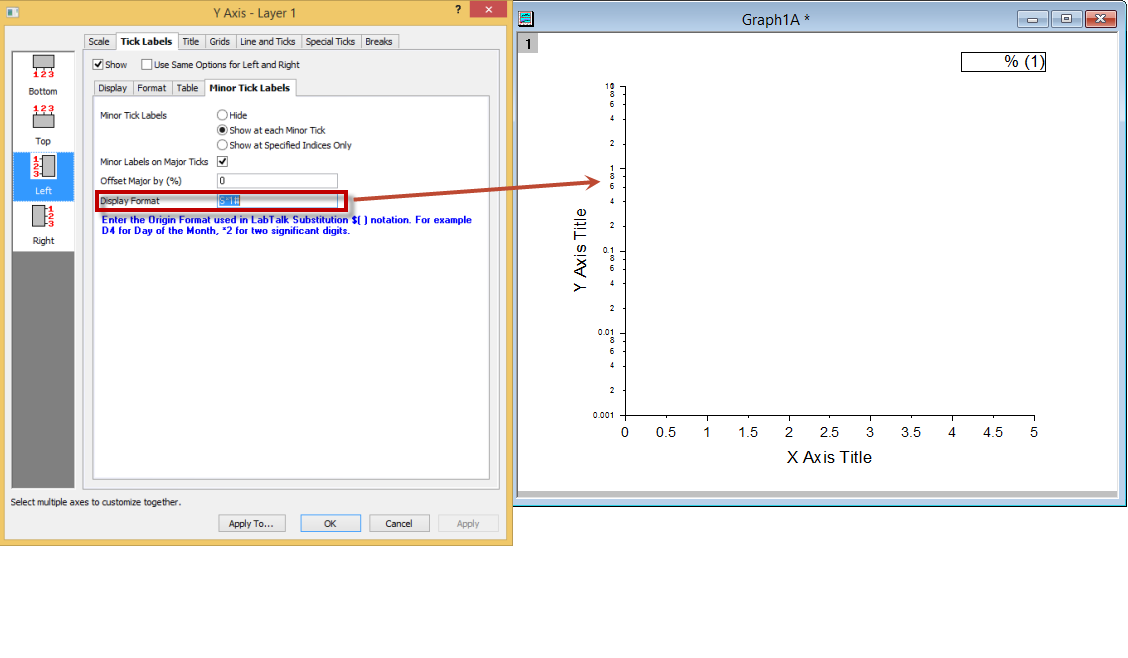 |
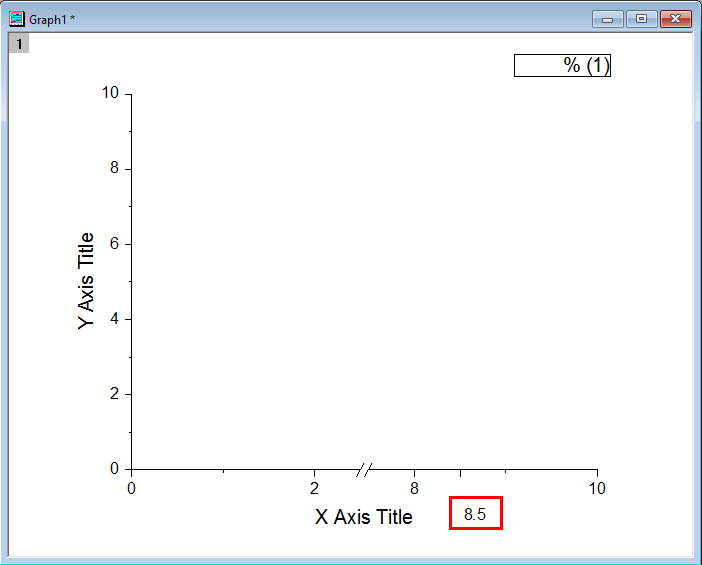
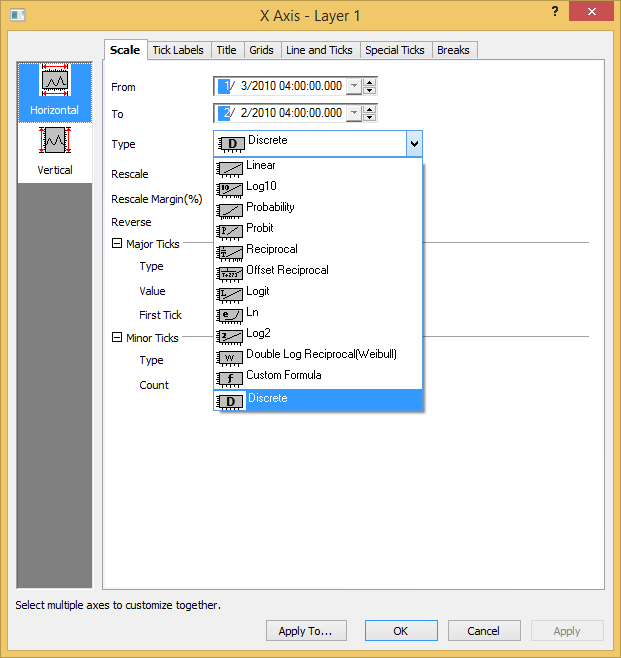
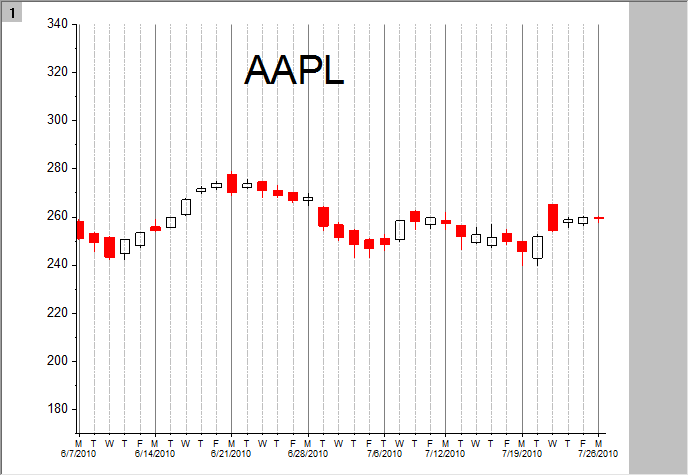
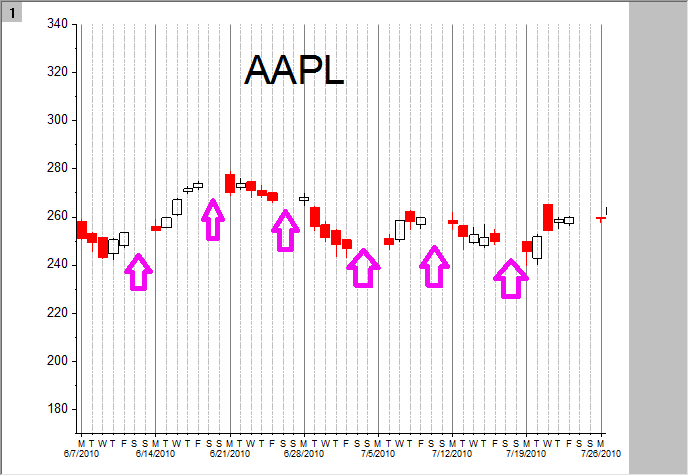
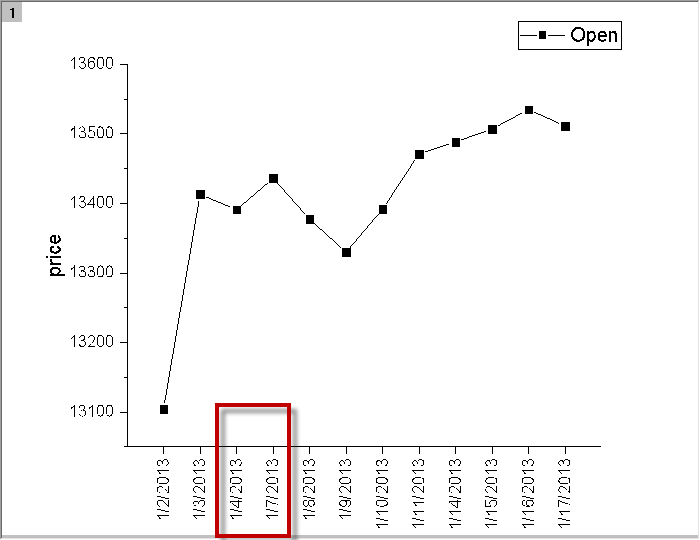
| ORG-12946 | New Axis scale type: Discrete to support skipping weekend and holidays in financial plots | Use discrete as plot scale type to skip weekend when plotting When plotting financial graph where there is no trading on weekends and holidays, there used to be a gap in axis. But now in Origin 2016, by using Discrete scale type, there will be no such gaps and the data will look more cotinuous. This is the default setting for all plot types under Plot: Stock: menu.
If Discrete is set as scale type, no gap between candle sticks.
Old way: Axis Scale is Linear, there are gaps on weekend and holidays.
Basically if Discrete is set as scale type, missing data is not plotted and continuity preserves.
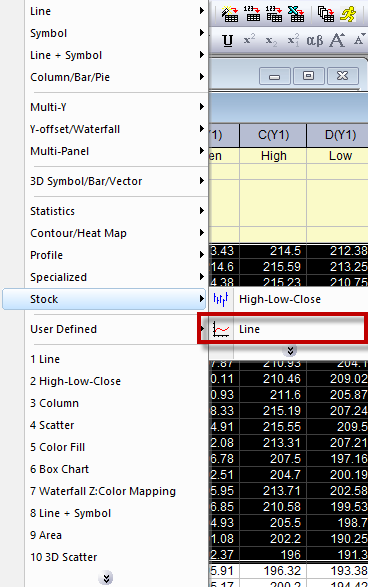
Add a Line option under Plot: Stock menu and the toolbar If make line plot with Plot:Stock:Plot, x axis scale type is set to discrete by default.
|
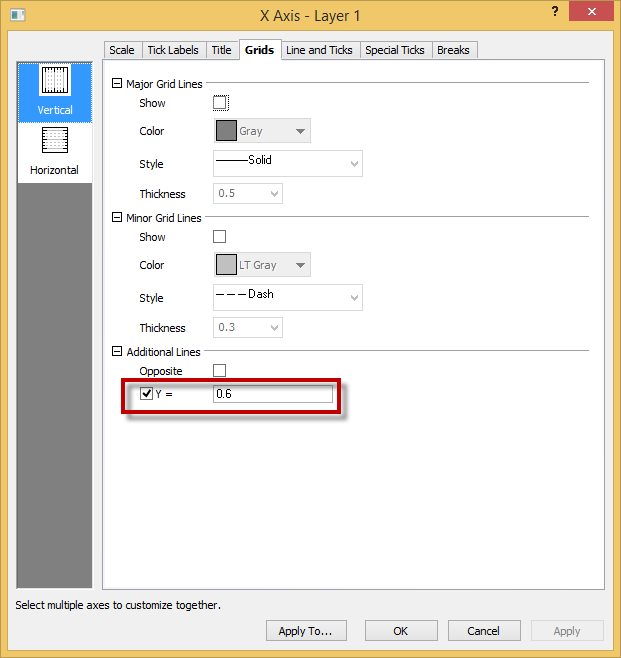
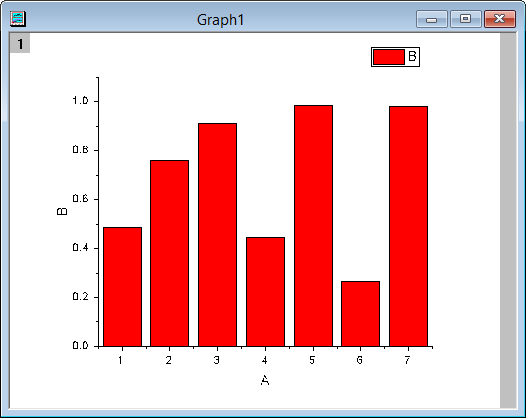
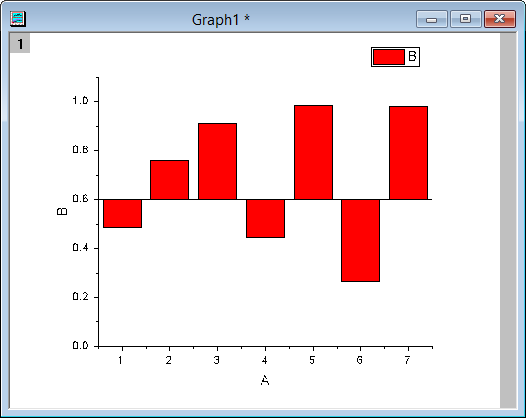
| ORG-9226 | Non-Zero Baseline in Axis dialog for Column/Bar, Drop lines and Area Plot | Allow base line position to be customized Now baseline position can be set to any value while keep the axis unmoved.
before specifying the baseline.
After setting the baseline to y = 0.6. The x axis is unchanged.
|
3D and Contour
| JIRA | SUMMARY | DETAILS |
|---|---|---|
| ORG-13425 | 3D waterfall plot supports both line and symbol | In the Plot Detail dialog of 3D waterfall plot, add Symbol tab to allow plotting symbols. Both 2D and 3D symbols are supported.
Display of the 3D waterfall plot with symbols.
|
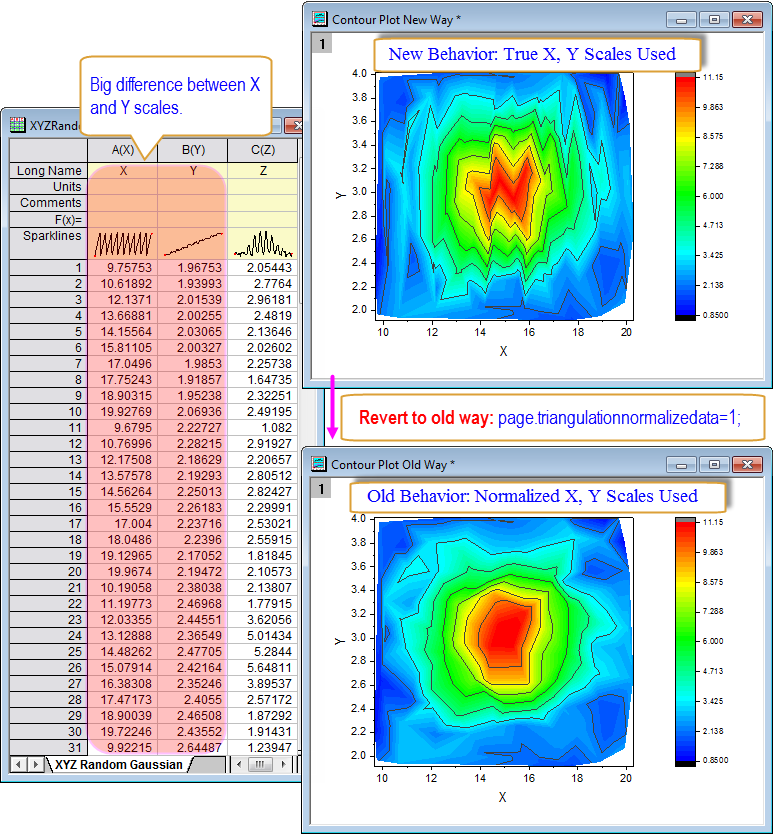
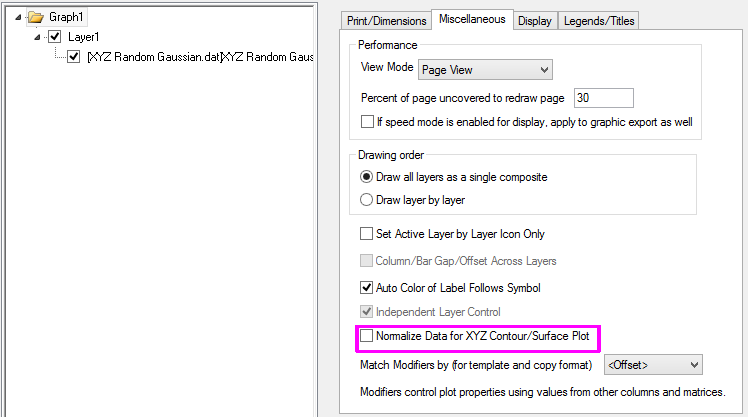
| ORG-12492 | Allow using true scales of X and Y data in contour triangulation | In Origin 2016 SR0, Origin has implemented the contour triangulation algorithm to be based on raw X and Y data instead of normalized X and Y data as used in old treatment. To revert to old behavior, you can run the command below in Script Window or Command Window and refresh to see: page.triangulationnormalizedata=1;
In Origin 2016 SR3, there is GUI access to revert.
|
Analysis
| JIRA | SUMMARY | DETAILS |
|---|---|---|
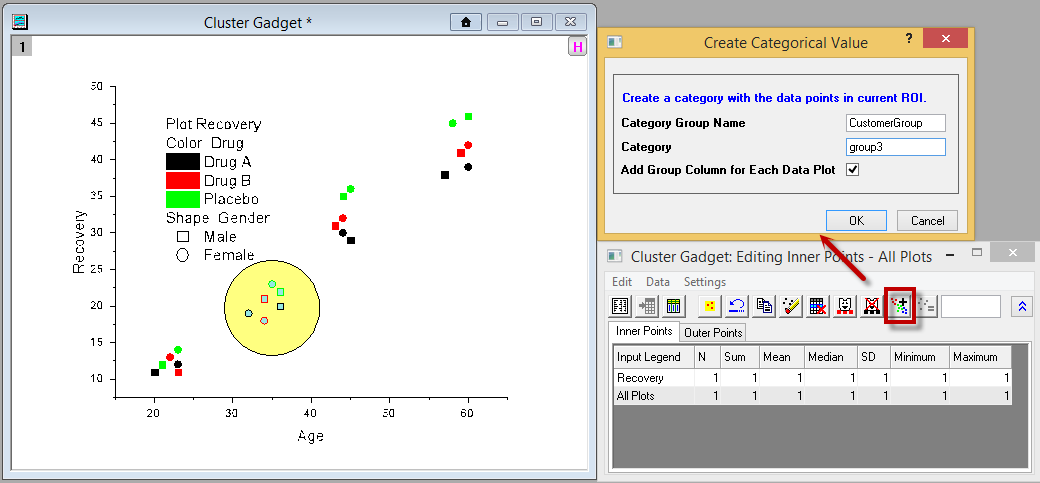
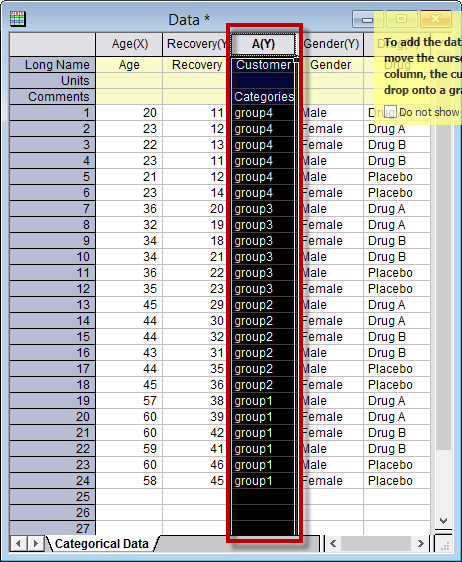
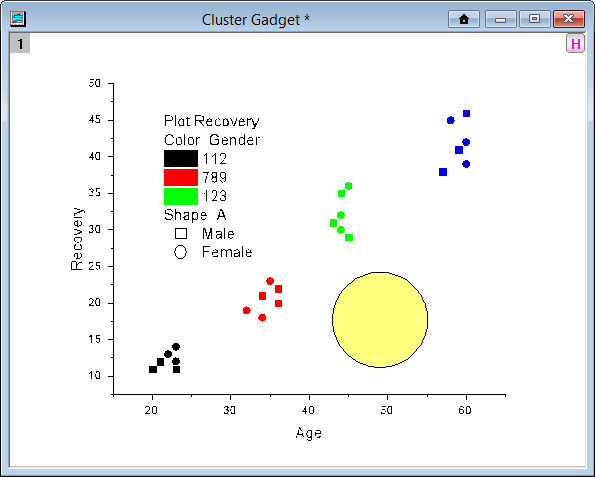
| ORG-11102 | Gadget: Add new column for category info in Cluster gadget | How to...
4. This will generate a new column in the source data which denotes the category info of each points.
5. Data points can be recolored referring to the new category info.
|
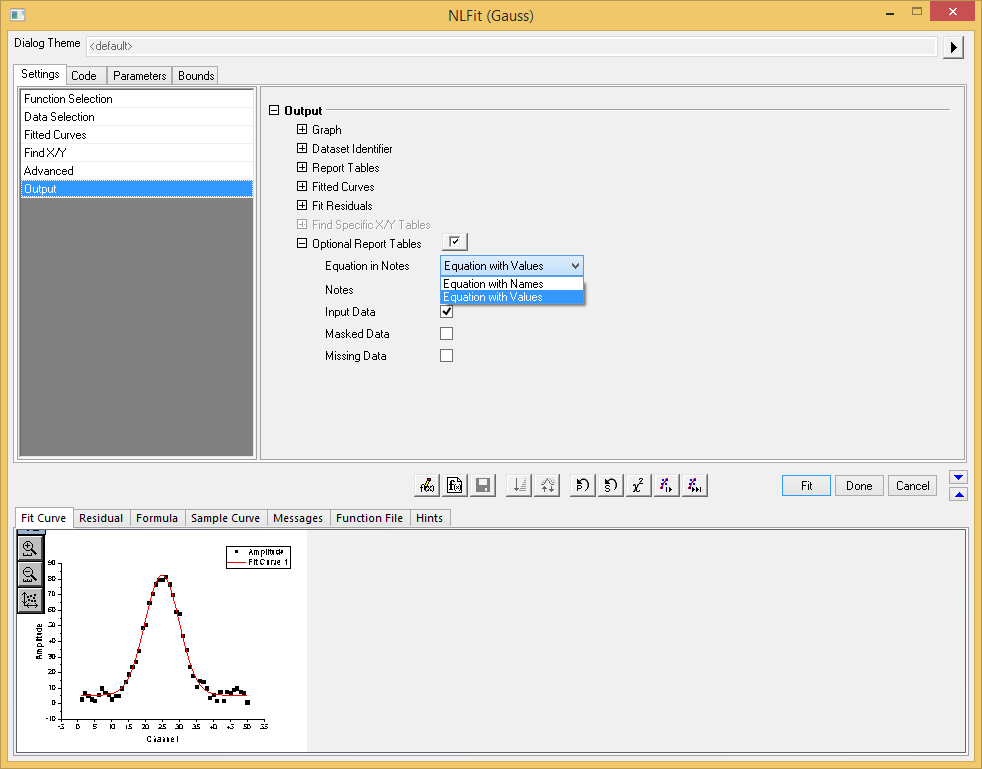
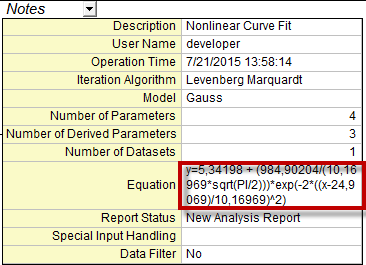
| ORG-13318 | Fitting: Display Nonlinear Equation with Values in Fitting Report Table in Graph | In Nonlinear fitting dialog, add "Equation in Notes" in the Output section that user can choose to display the equation with fitted parameter values.
|
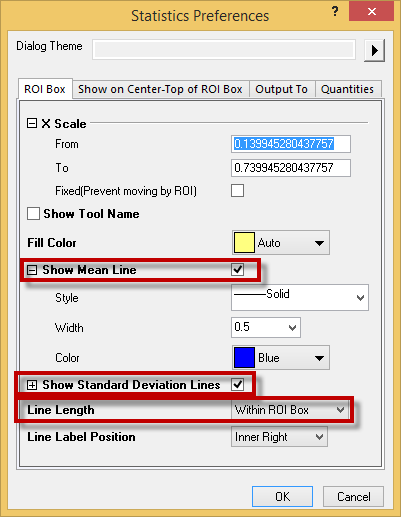
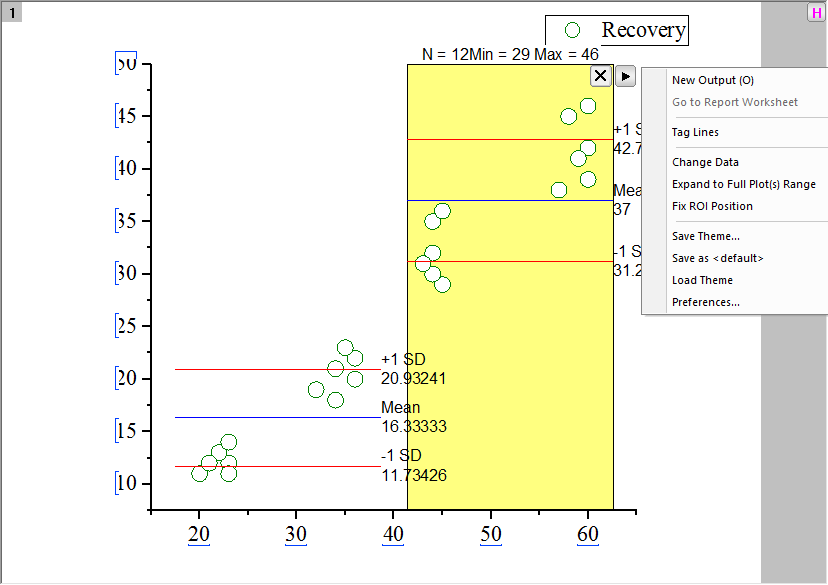
| Gadget: Statistics Gadgets Improvements | Improvements on statistics gadget On ROI Box tab,
Tag Line(s) option is added in the fly-out menu. User can click it to add Mean&SD lines and labels in graph. Move or delete the gadget will not remove the tags.
Add curve translate gadget When click the > button. Now the customer can:
| |
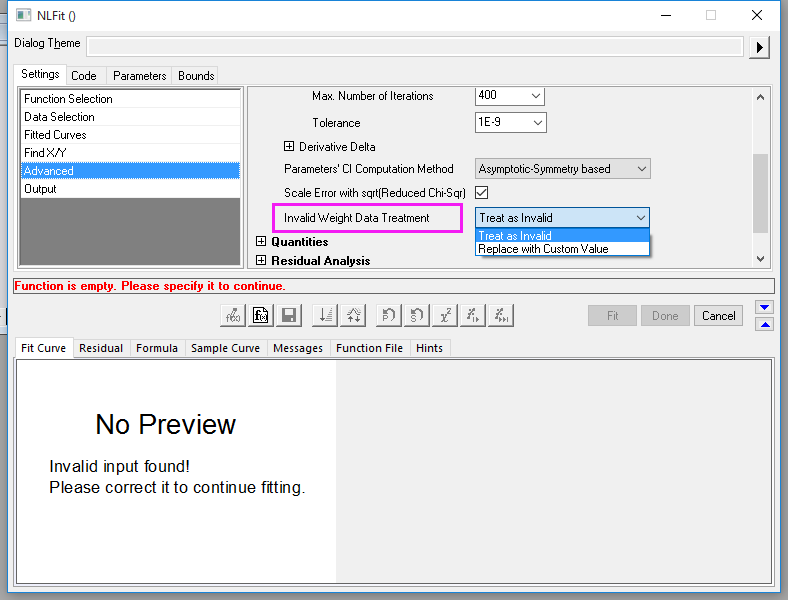
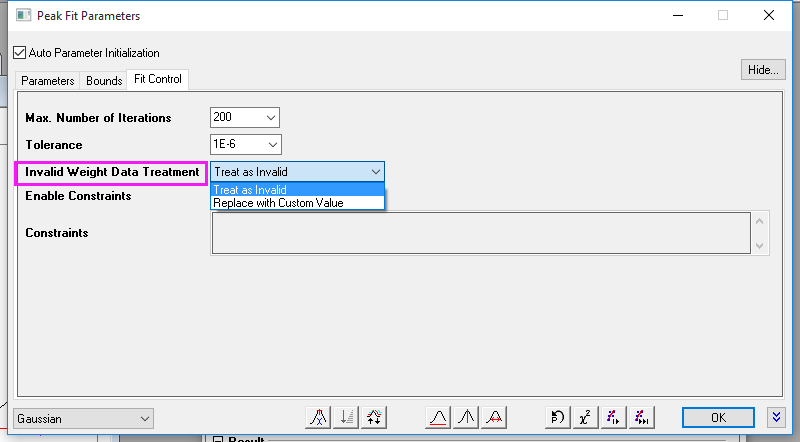
| ORG-7940 | Fitting: Add a combo option Invalid Weight Data Treatment for users to replace the invalid weight data. | In NLFit and PA fit control dialog, add Invalid Weight Data Treatment enabling customer to replace the invalid weight data.
|
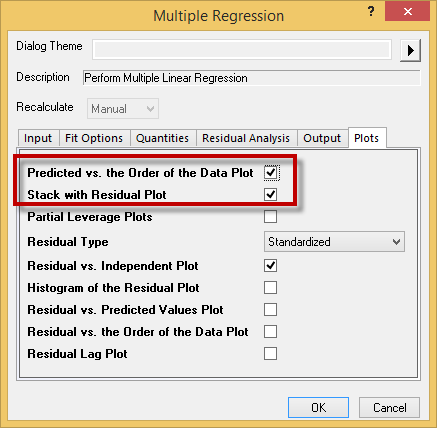
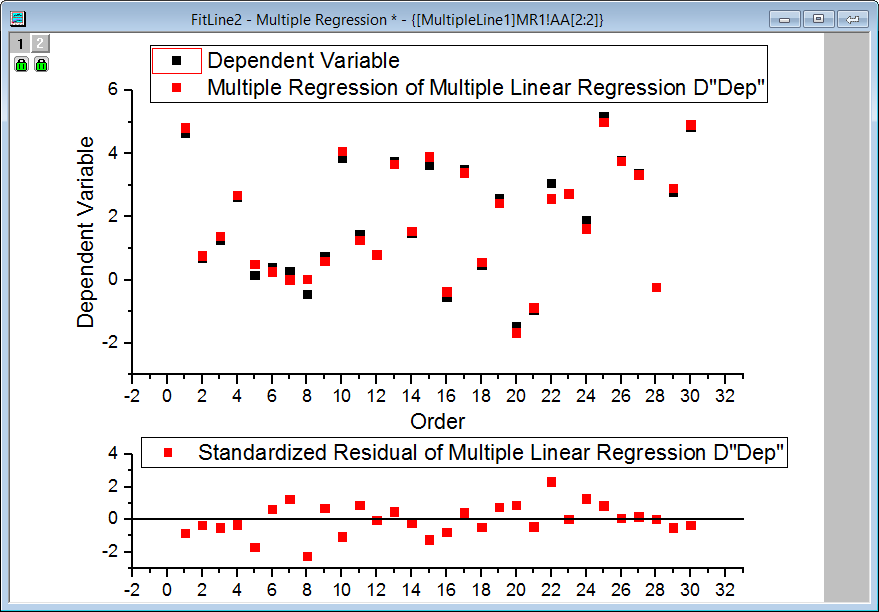
| ORG-12843 | Fitting: Improvement of the output plots for multiple linear regression | Add two checkboxes Predicted vs. the Order of the Data Plot and Stack with Residual Plot (both default unchecked) in the Plots tab in Multiple Regression dialog. This will generate extra two plots in the result that shows the dependent variable/predicted variable vs row number and residual vs row number.
|
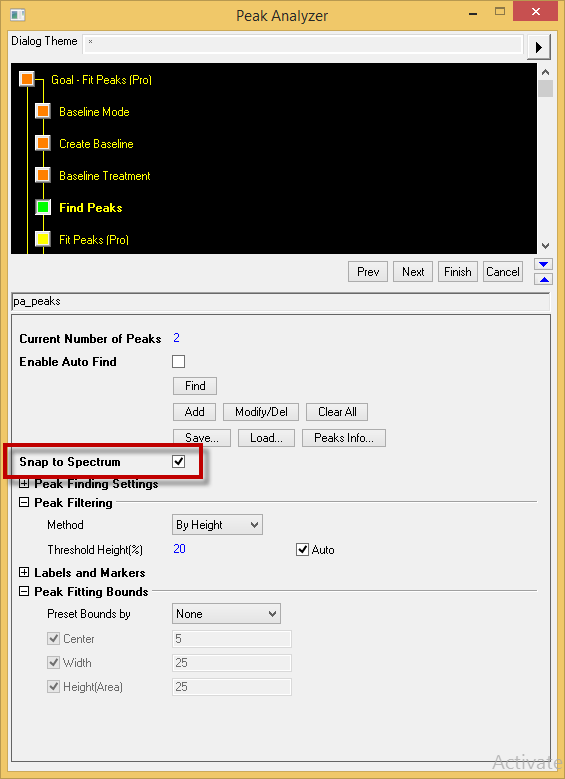
| ORG-12477 | Peak Analysis:Support Snap to Spectrum in peak finding | In PA dialog, add an option Snap to Spectrum in find peaks page so that the spectrum height will be automatically calculated from the curve. This is useful that customer only need to save the peak center in the theme and the height will be calculated.
|
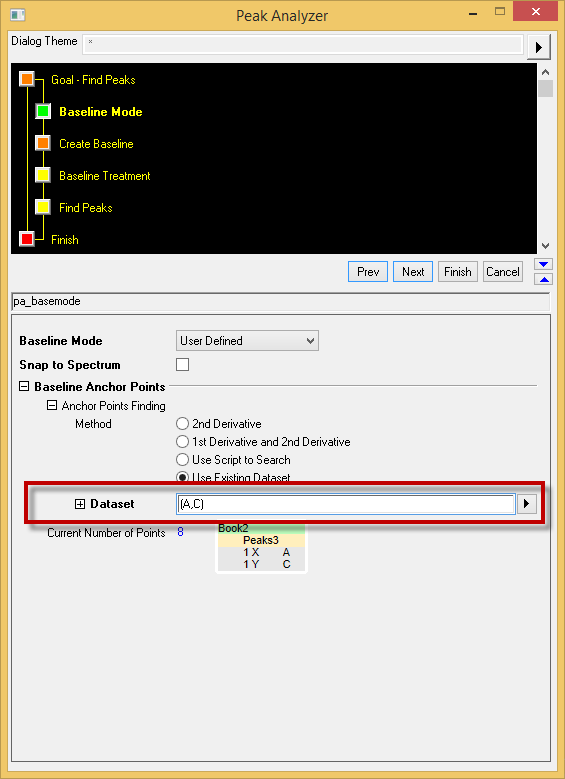
| ORG-11946 | Peak Analysis:Batch Peak Analysis supports relative column on using existing dataset as baseline | In the PA setting baseline step, relative column position is used as baseline input if only column number is set in Dataset. This is useful in Batch processing that user wants the same column in each worksheet as baseline.
|
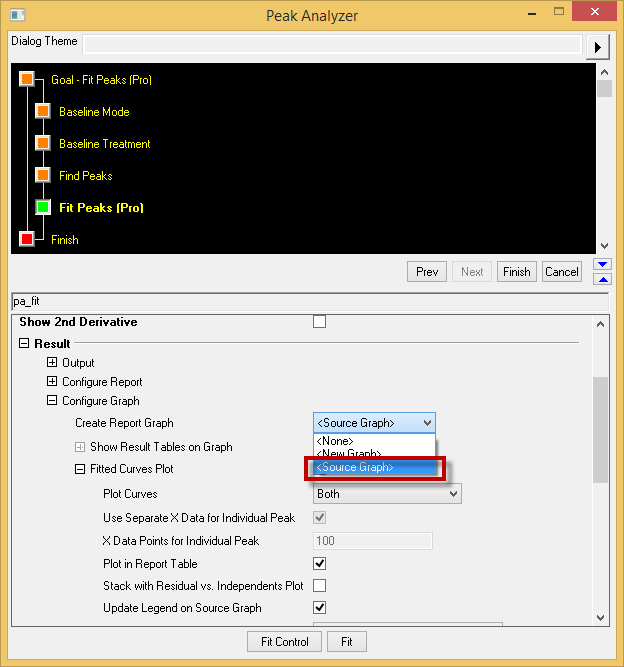
| ORG-13430 | Peak Analysis:Output the Peak field table to source graph, when start PA with a graph | Under Result:Create Report Graph, can add result table to the source graph.
|
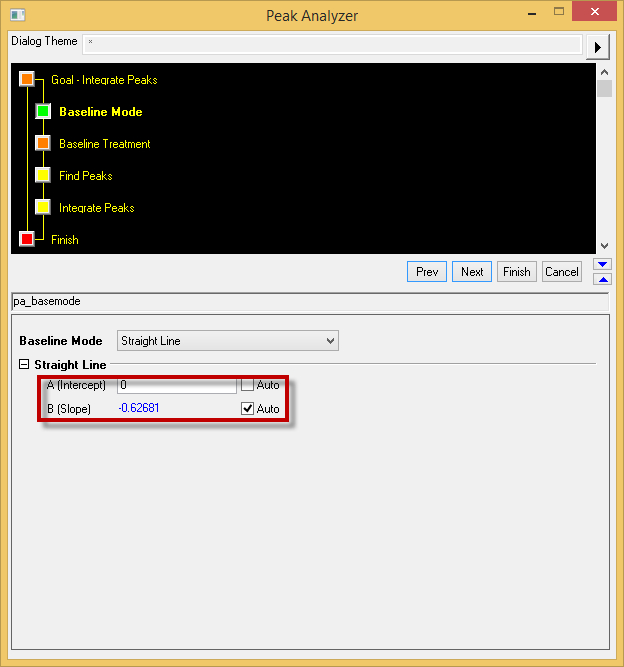
| ORG-12990 | Peak Analysis:Allow User to set Slope and Y intercept for Straight Line Option on Baseline mode Page | Customer is now able to set the intercept and slope of the straight line as the base line.
|
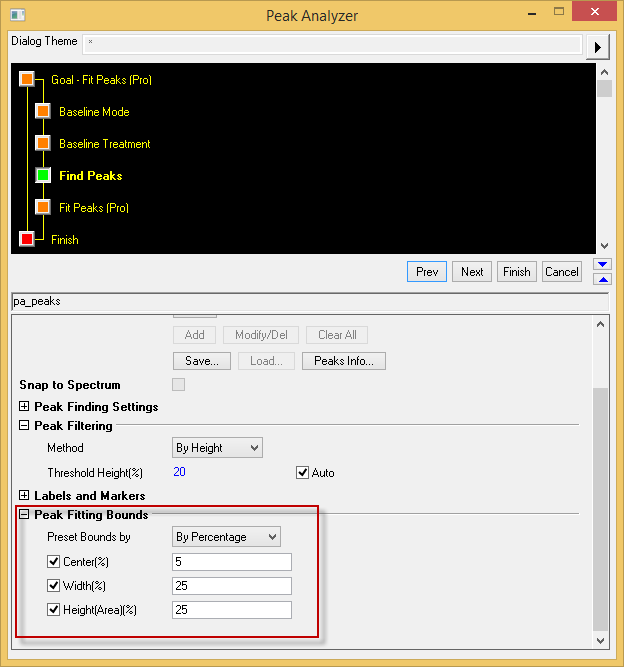
| ORG-12875 | Peak Analysis:Set upper and lower bound of peaks in Peaks Find Page | When peak analysis goal is Fit Peaks, we added a Treenode type branch Peak Fitting Bounds that customer can preset the bounds of fitting parameters.
|
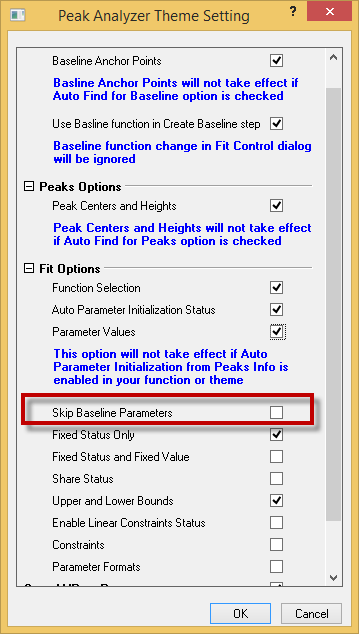
| ORG-12784 | Peak Analysis:Support to only save initial peak parameters instead of baseline | User has the option now to exclude the baseline info from the saved theme that user can manually set the baseline with other parameters are predefined in a theme.
|
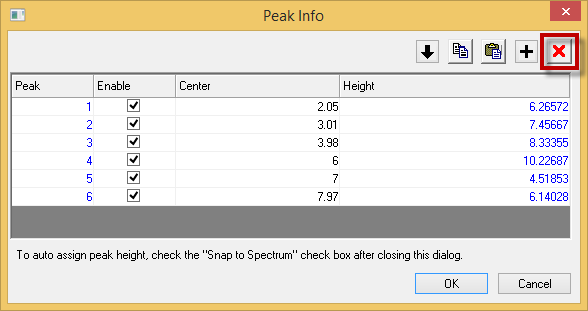
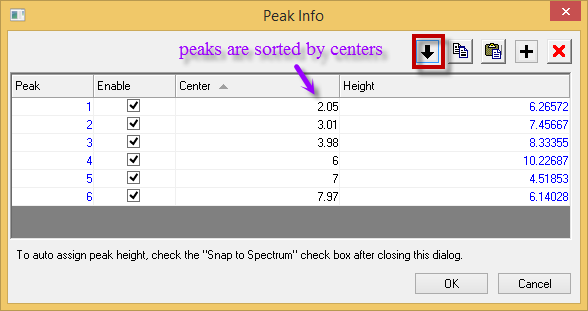
| ORG-13116 | Peak Analysis:Make it easy to delete peaks / anchors in Peak Info dialog | In the Peak Find page, inside Peak info dialog, peaks can be selected/deselected through the enable check box.
Peaks can also be sorted using the sort center ascending button.
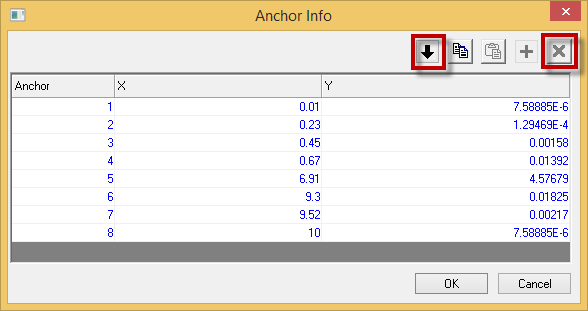
It also works for anchor info dialog.
|
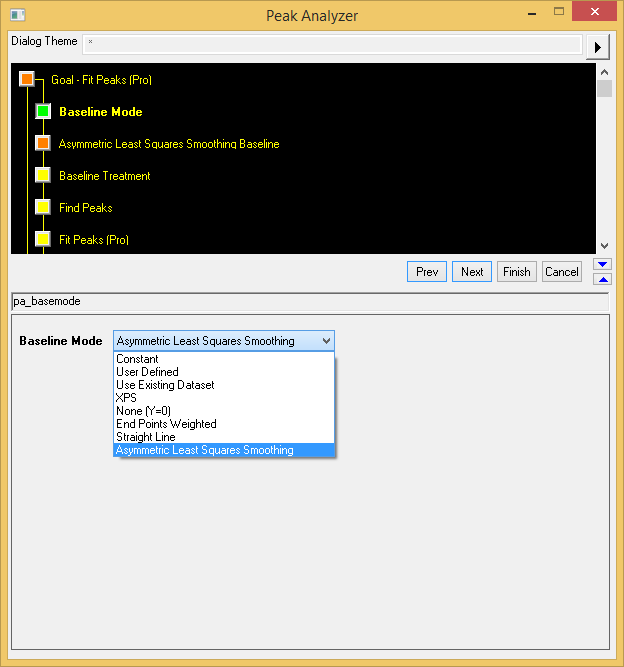
| ORG-12844 | Peak Analysis:Add ALS baseline method (Pro-only) to PA and Quick Peaks | Add Asymmetric Least Squares Smooting option in Baseline Mode drop-down list.
|
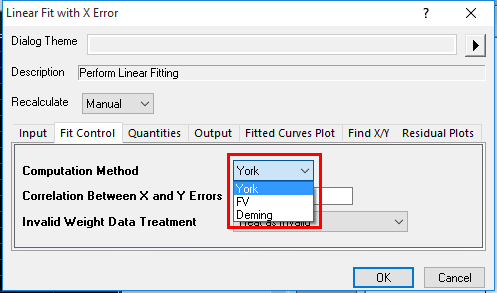
| ORG-5405 | Fitting: Provide Deming method in Fit Linear with X Error | Deming method is added to Linear fit with X error dialog.
|
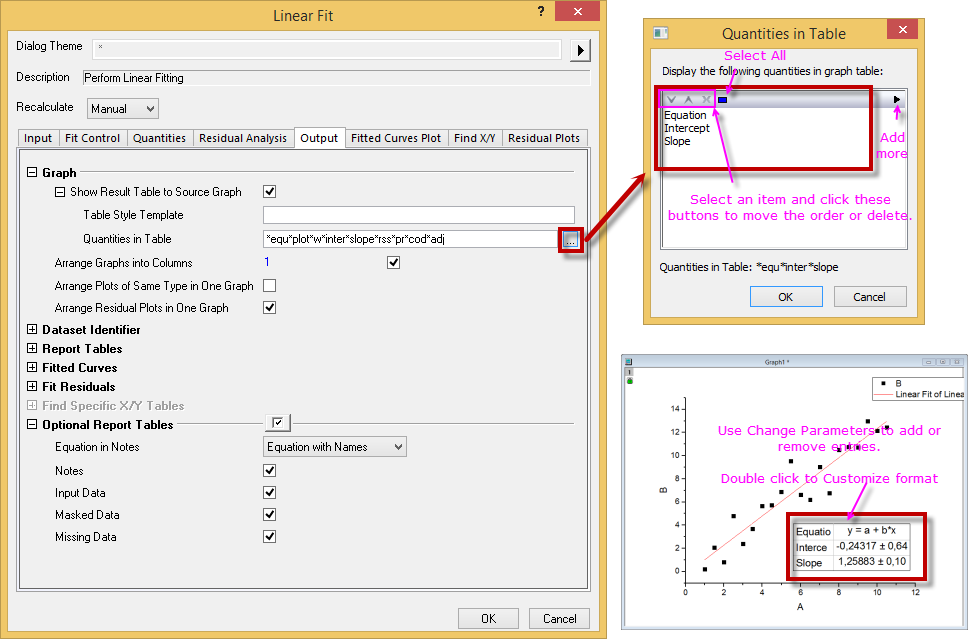
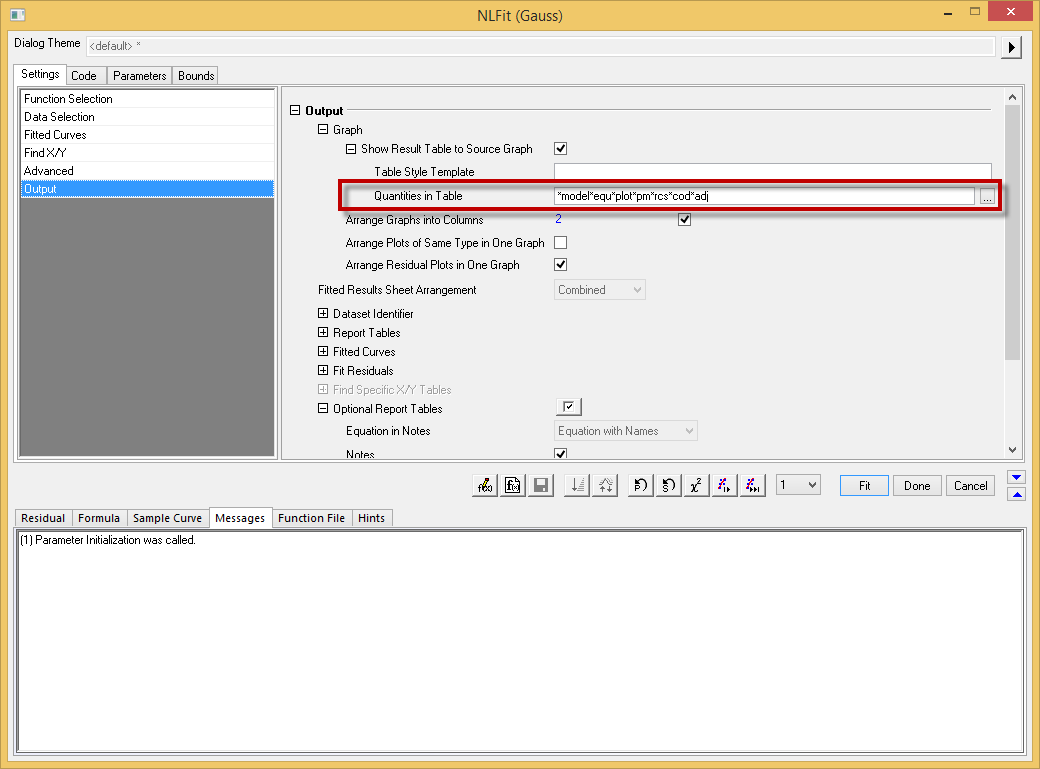
| Fitting: Provide GUI for customization of LR report table on graph | In doing Linear Fit, NLfit, Fit Linear with X Error, Polynomial Fit dialog on graph, add a "..." button after the edit box of Quantities in Table. It will open a dialog to add or delete the quantities to put in the graph table. In the following example, when only "Equation","Intercept","Slope" are selected, the table displayed in the graph only shows these three items.
The nonlinear fitting dialog also has this feature.
double click the report table will open the Quantities in Table dialog that can choose the variables displayed in the table. Right click the table and select "Go to Worksheet" context menu leads to the real worksheet of the table. | |
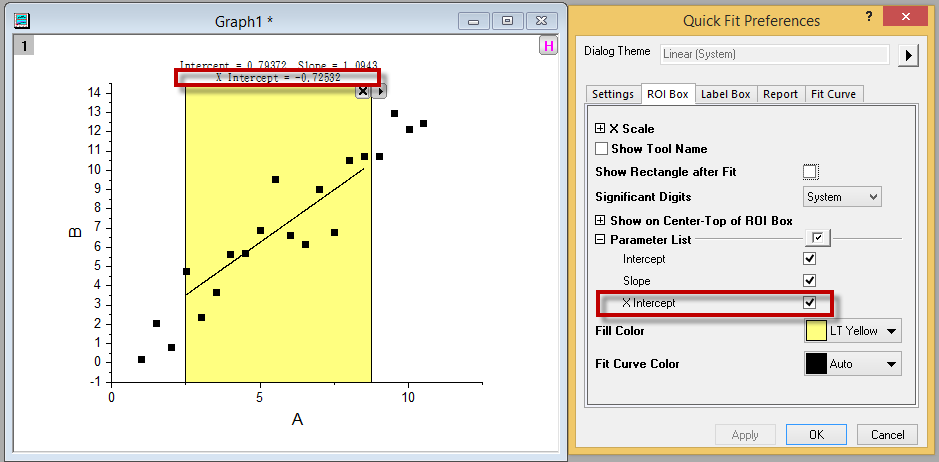
| ORG-10680 | Fitting: Show both X and Y intercept for Linear quick fit gadget | In linear fit gadget, add a checkbox "X-Intercept" under parameter list branch on ROI Box tab when it is linear fit that it shows the x interception.
|
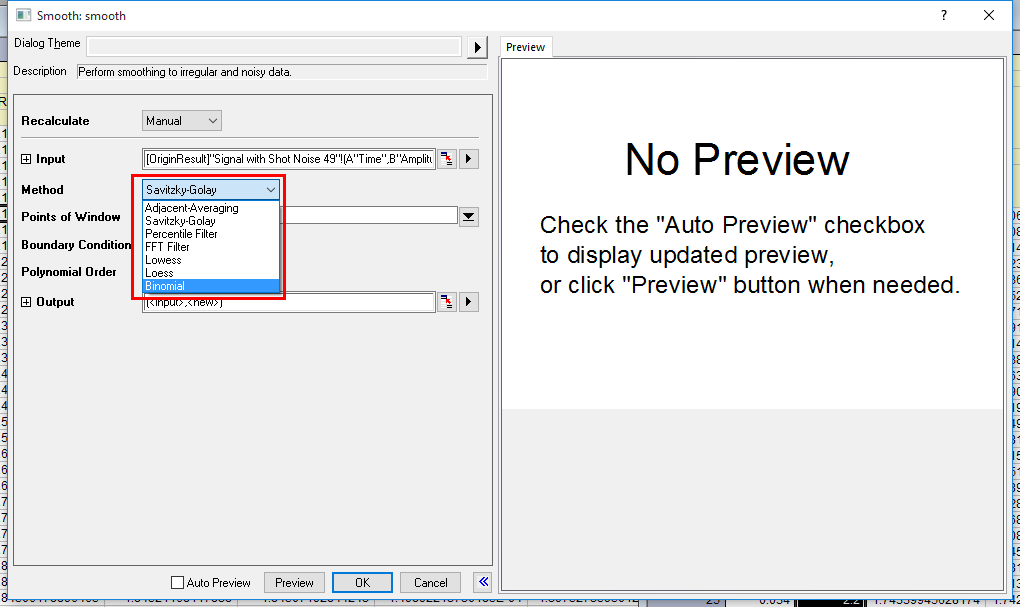
| ORG-4645 | Signal Processing: Support Binomial filter for smoothing | Add Binomial as smoothing method now.
|
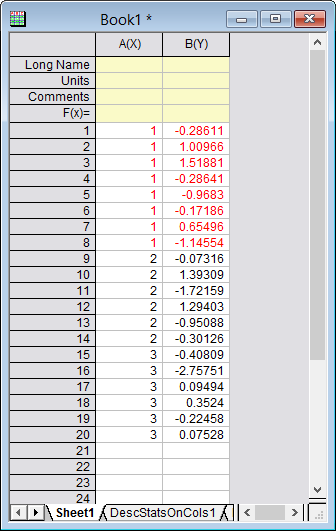
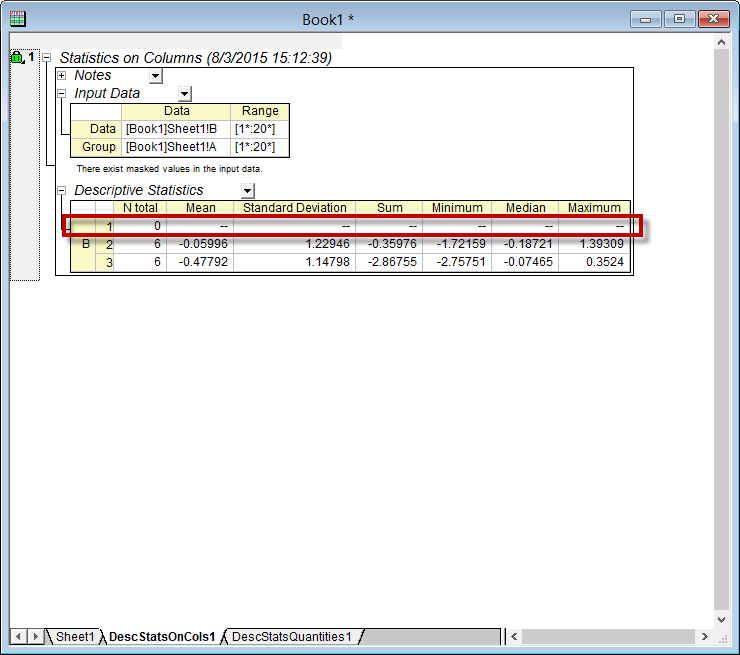
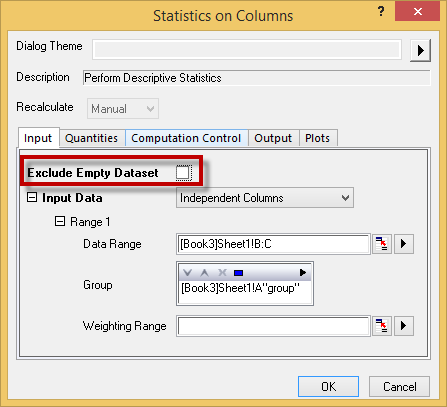
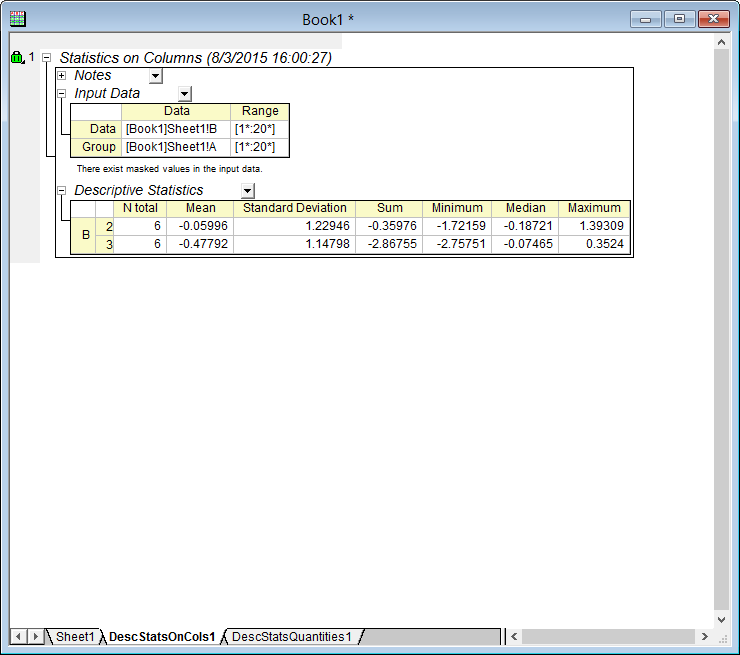
| ORG-12921 | Statistics: Exclude Masked Data in Analysis Output | When running column statistics on masked data, the resulting statistics still includes the lines with masked data, even though it's empty.
Add a check box to exclude the empty dataset so that the redundant statistics line in the output is excluded.
|
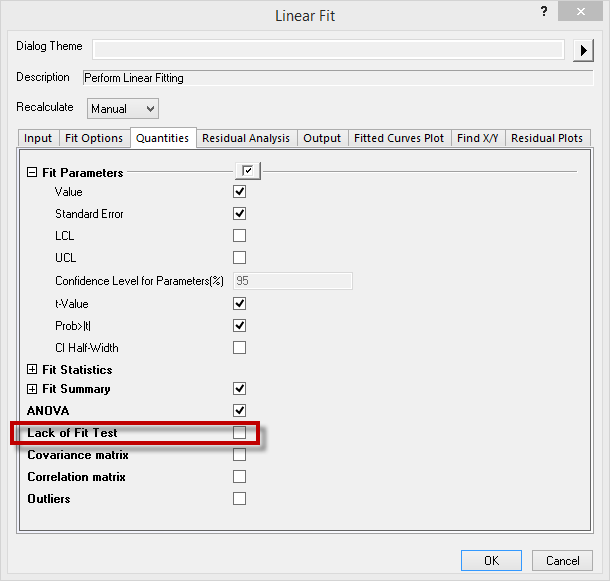
| ORG-2873 | Fitting: Improvement in linear regression | Support Test for Lack of Fit test It is available in Linear Fit, Polynomial Fit, and Multiple Linear regression.
|
| ORG-1528 | Statistics: Means Comparison on Interaction Combinations in Two-Way ANOVA | Support means comparison on interaction combinations in two-way ANOVA. |
Data Processing
| JIRA | SUMMARY | DETAILS |
|---|---|---|
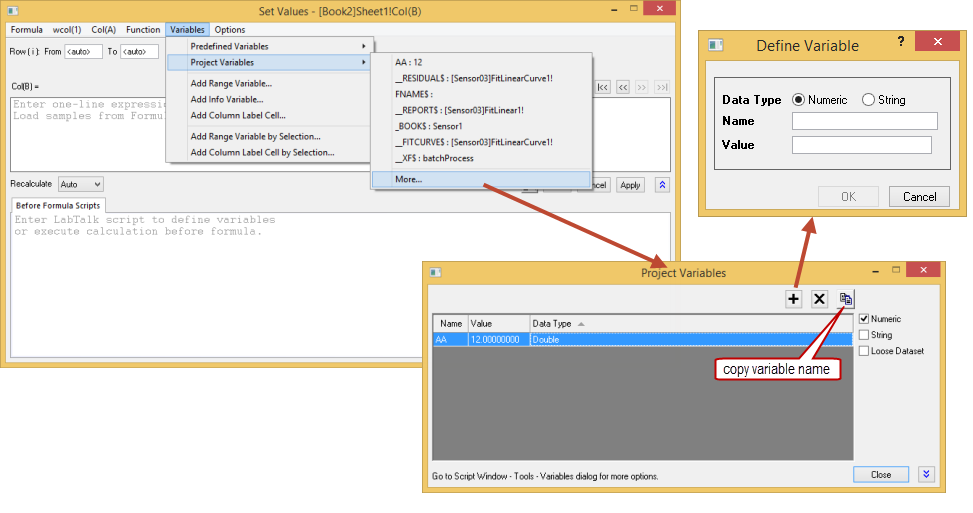
| ORG-12971 | Define and access Project Variables in Set Column Values dialog | Allow inserting project variable in Set Column Value dialog. How to...
|
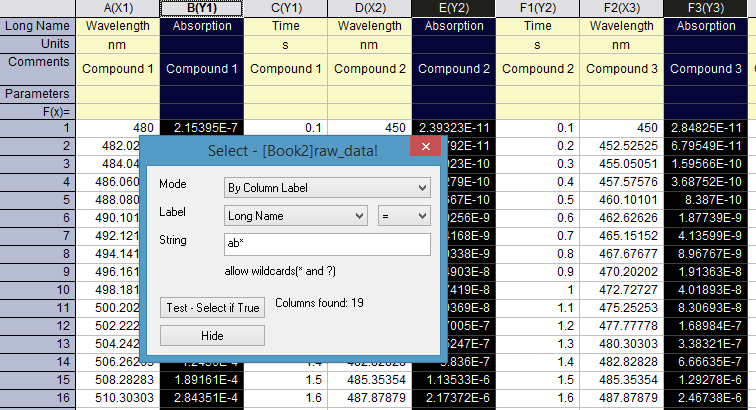
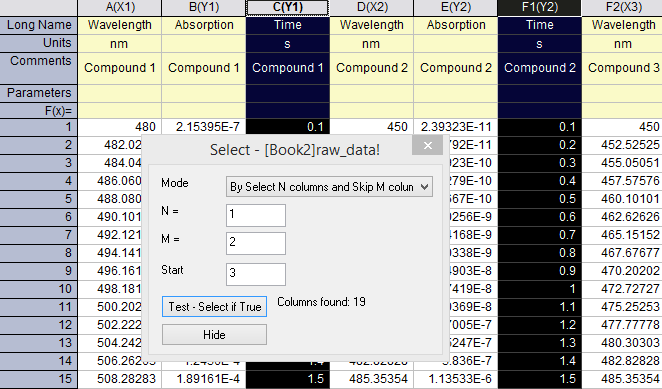
| ORG-13044 | Edit: Select... menu to Select or Hide Columns by Column Label Rows or Skipping | Choose Edit: Select... menu will open Select dialog where user can easily select and hide columns which fit the column label string, or by select N columns and skip M columns. Since it's a modeless dialog, you can keep this dialog open and keep on doing selection and plotting or analysis. Note: if the column label row has numbers, you can even set the >, <, etc. as conditions to select such columns. Select or Hide Columns by Column Label Rows
Select or Hide Columns by Skipping
|
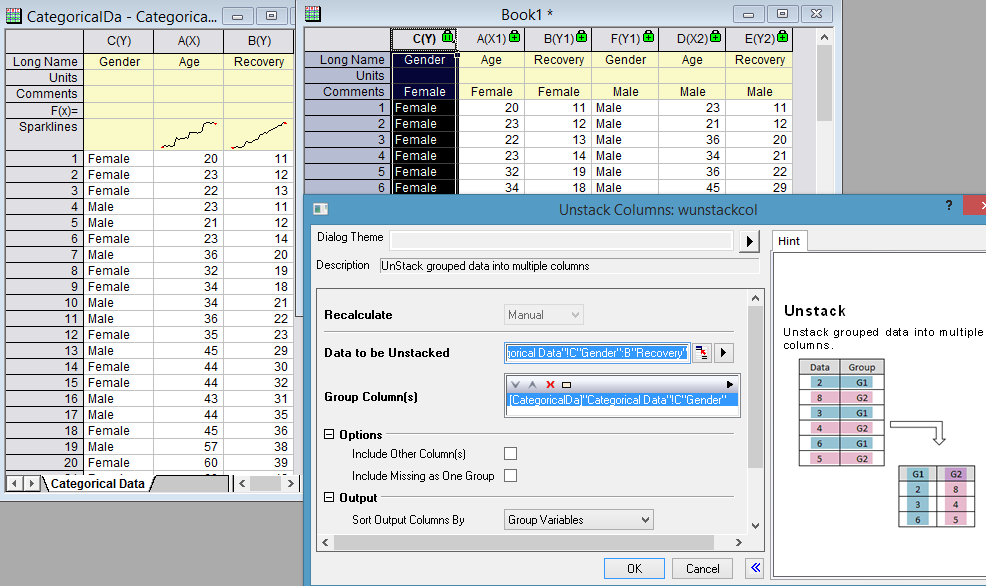
| ORG-7856 | Allow unstacking Group columns | Before 9.3, after unstacking data based on a group column, group info. can only show in column label row. Now it can show in columns next to data.
|
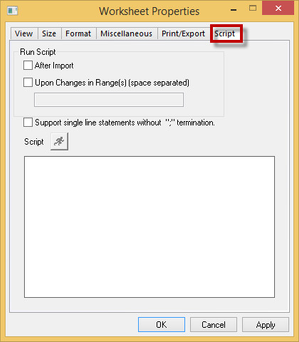
| Add Worksheet Script into Worksheet Properties dialog | Worksheet Script can be managed from Worksheet Properties dialog now.
| |
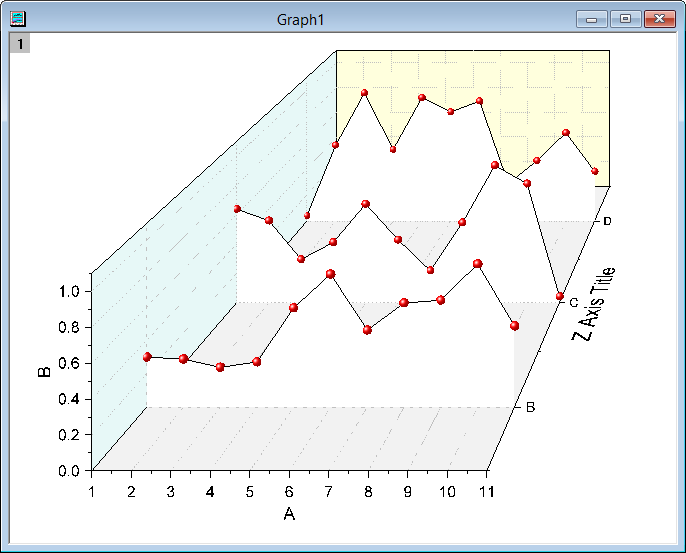
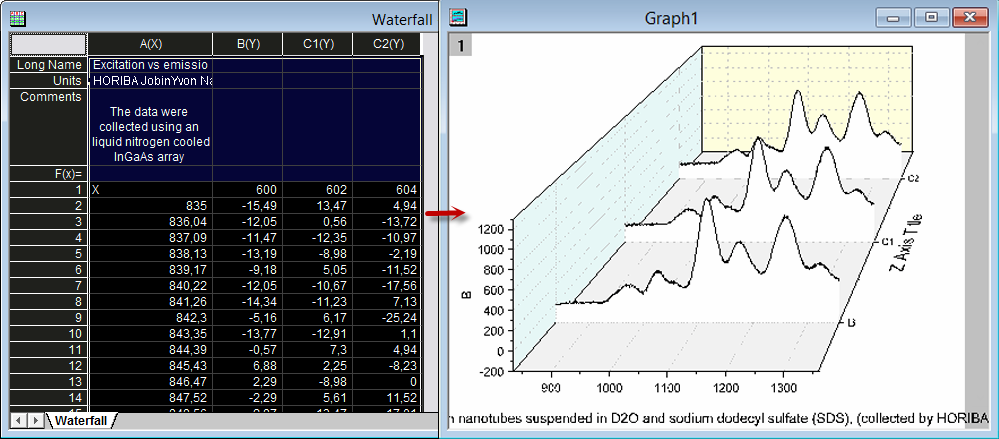
| Ignore the hidden columns in plotting. | In this example, columns with x > 604 are hidden. Select all the columns to make a 3D waterfall plot, the hidden columns are ignored..
| |
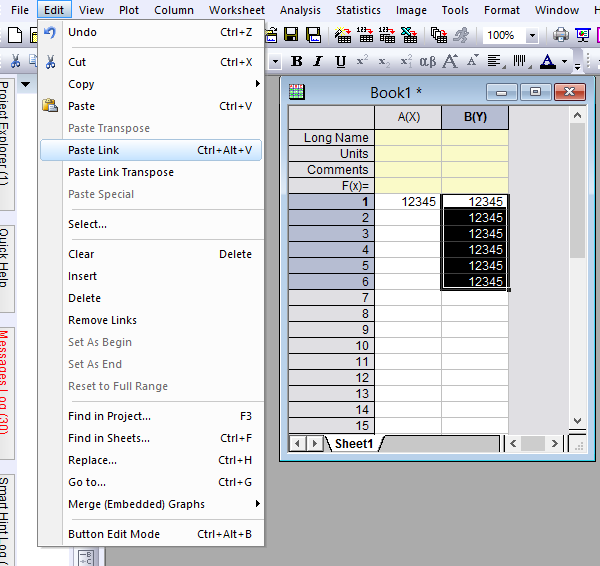
| Copy a cell value and Paste Link to multiple cells | When one cell is copied, select multiple cells and click Edit:Paste Link, the link of the single cell will be pasted to multiple cells.
| |
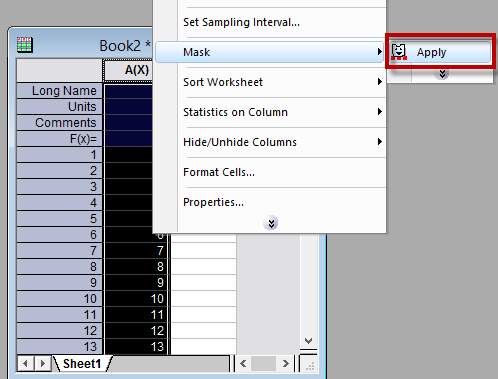
| Mask whole column | Menu contents of Mask when whole column is selected supports apply Mask:
| |
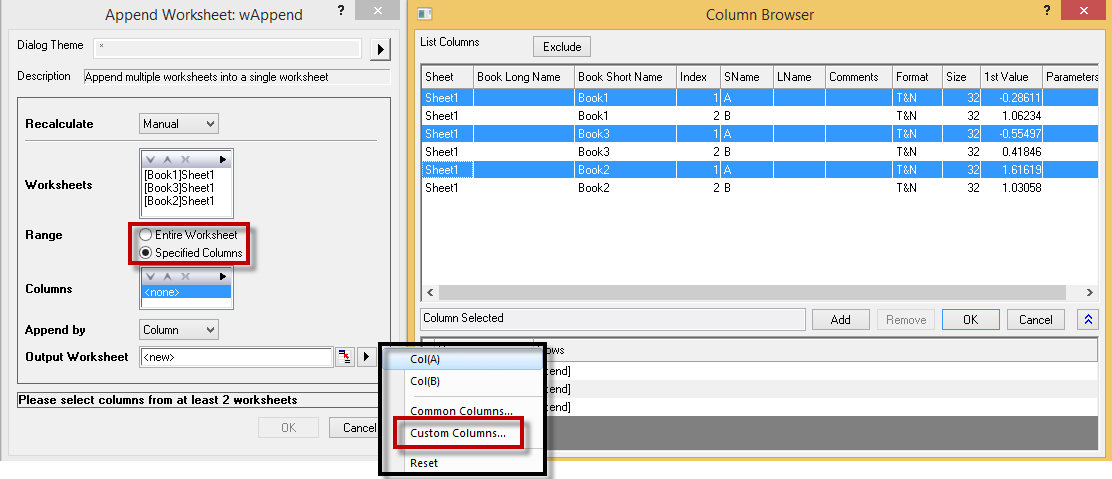
| Append Worksheet with Specified Columns | When append worksheet, can specify the columns to be included for each worksheet.
| |
Importing
| JIRA | SUMMARY | DETAILS |
|---|---|---|
| ORG-3364 | Worksheet Script can be triggered after all kinds of file import | In the past, if After Import is checked in Worksheet Script, the script will only run for ASCII import. Now the script can be triggered by all kinds of import file types. |
Exporting and Presentation
Batch Processing
| JIRA | SUMMARY | DETAILS |
|---|---|---|
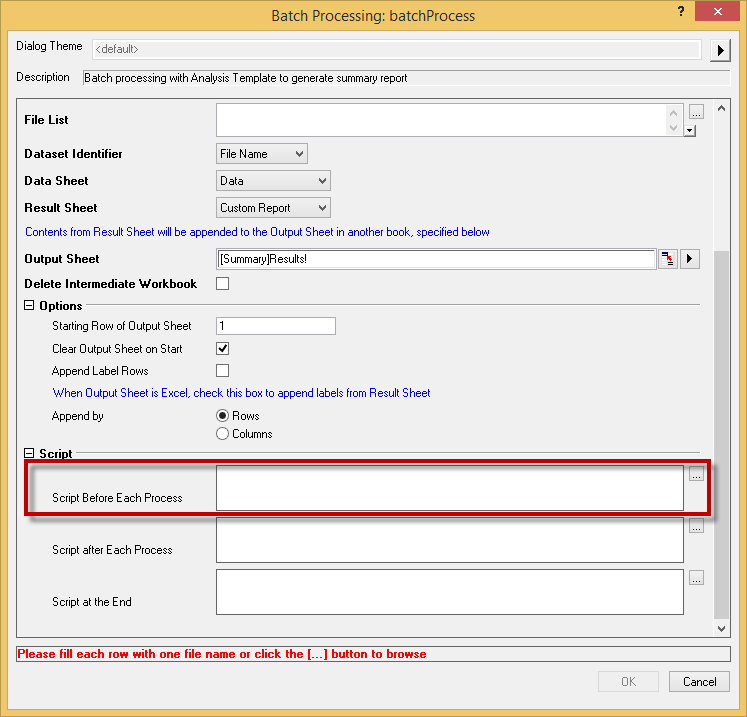
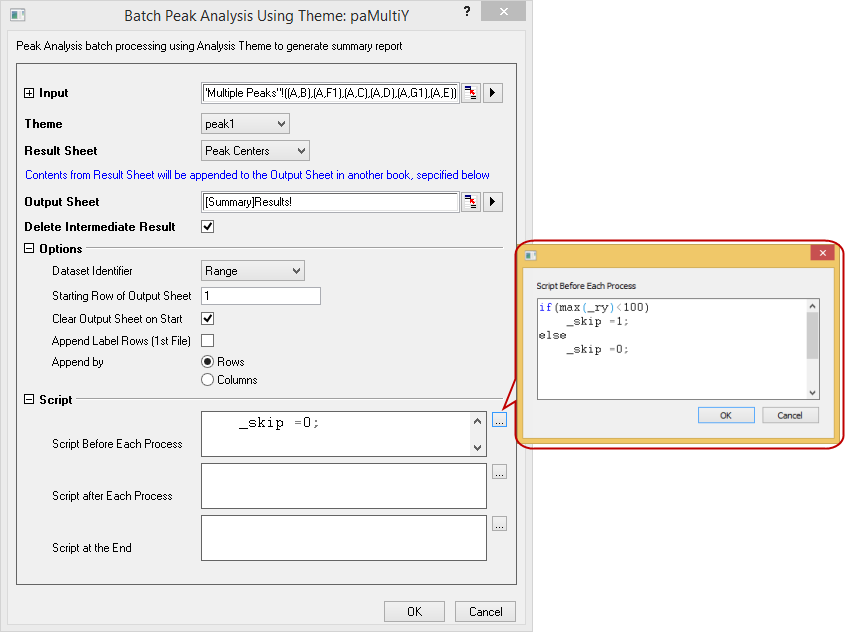
| ORG-8482 | Support Before Script in Batch Processing | In the Batch Processing or Batch Peak Analysis Using Theme dialog, we can run labtalk script before running the analysis.
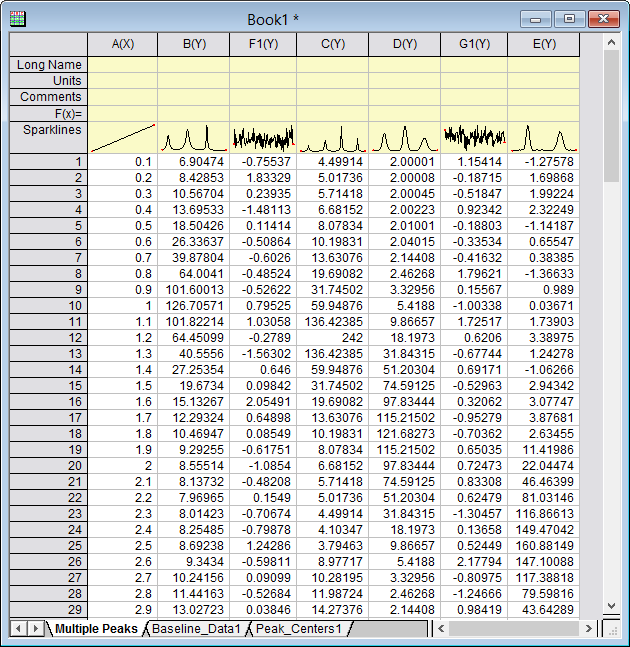
How to...Example 1: Data selection before running batch peak searching.
2. Highlight the whole worksheet and go to Analysis:Peaks And Baseline:Batch Peak Analysis Using Theme dialog. Input Labtalk script to skip the columns with noise (Maximum column value is less than 100 ).
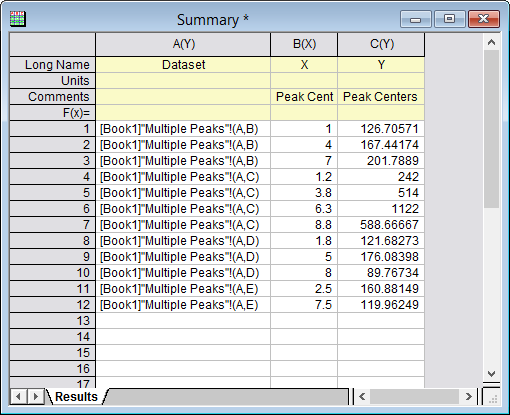
3. In the result sheet, Data of B,C,D,E columns are analyzed.
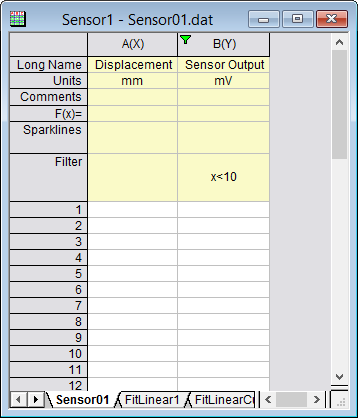
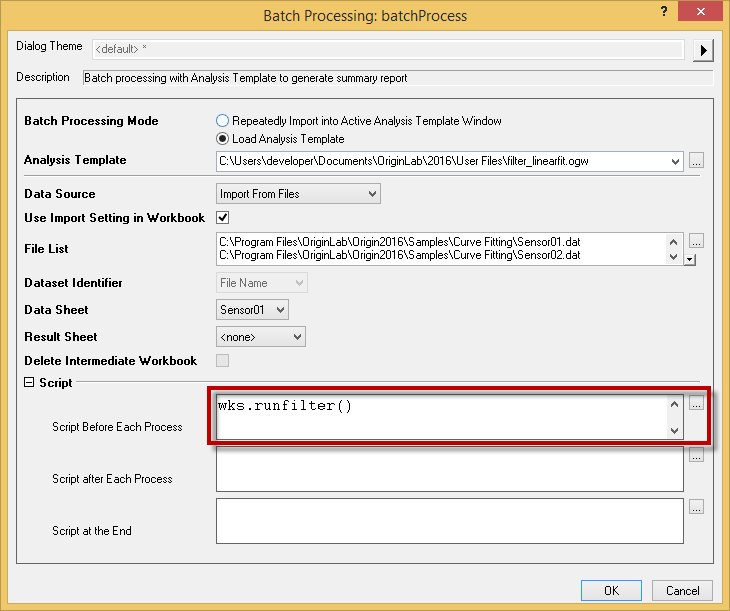
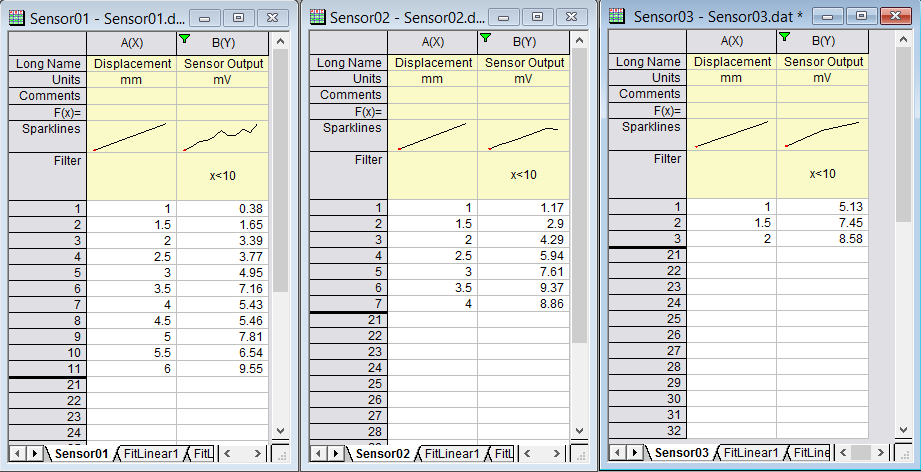
Example 2: Data filtering before batch processing.
2. In the Batch Processing dialog, we input the following script to activate the filter of each imported data.
3. In the result sheets, the filter in each dataset is activated before analysis.
|
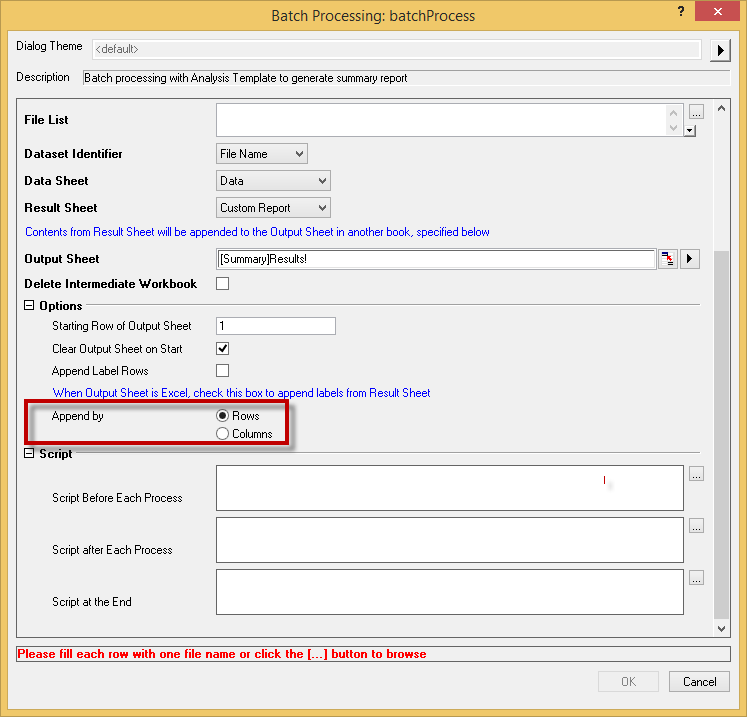
| ORG-6141 | Support append results by columns | Analysis result can be appended vertically in the report sheet.
|
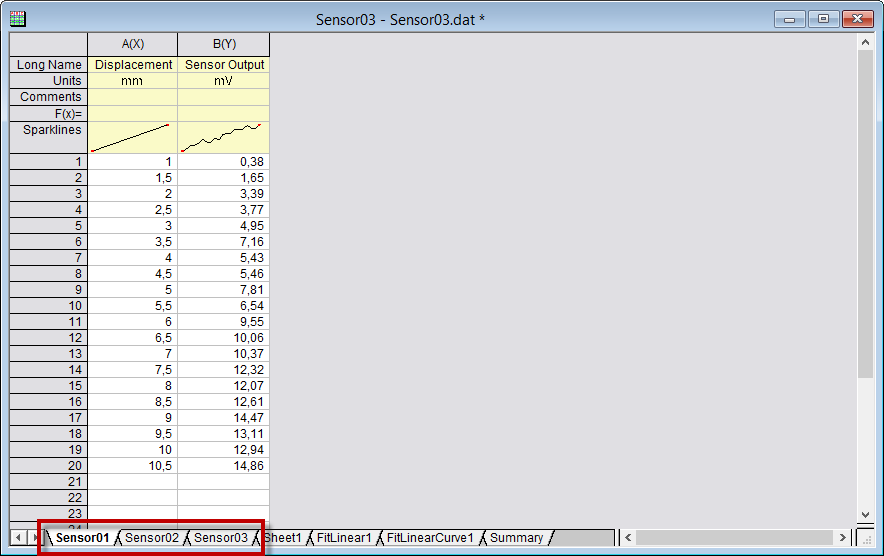
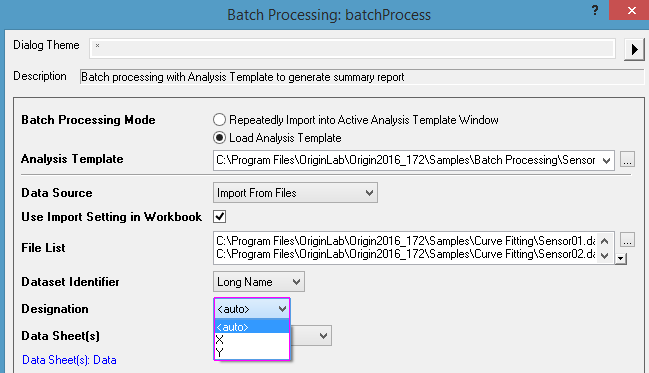
| ORG-12759 | Batch Processing with Analysis Template Support Import Multiple Files into Sequential Worksheets | When the analysis template has multiple sheets as input for analysis, we can now insert multiple data files into individual worksheets in batch processing: How to...
|
| ORG-13400 | Allow using X Data Info. as Dataset Identifier in Batch Processing | Sometimes data information is in X data column instead of Y. In Batch Processing dialog (including Batch Peak Analysis using Theme dialog), user can set Dataset Identifier from X columns.
|
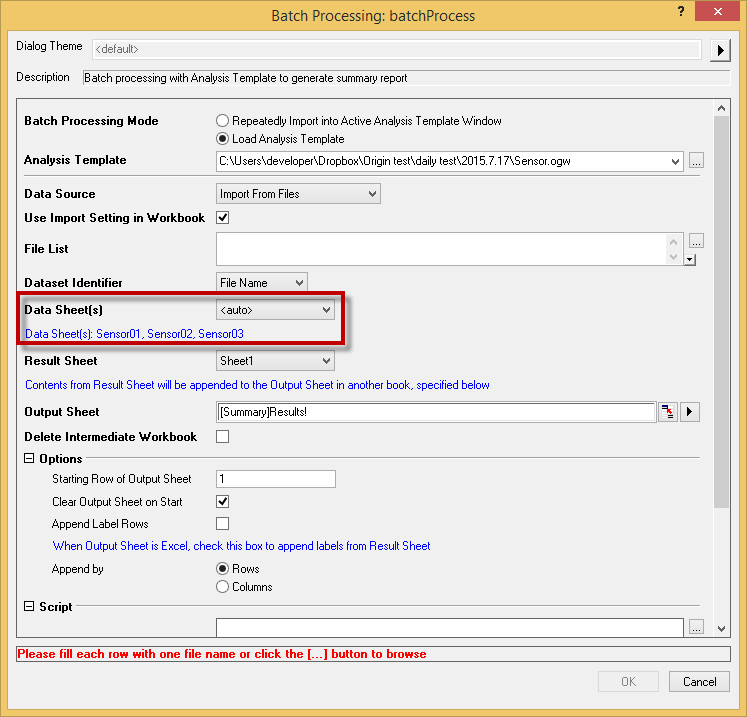
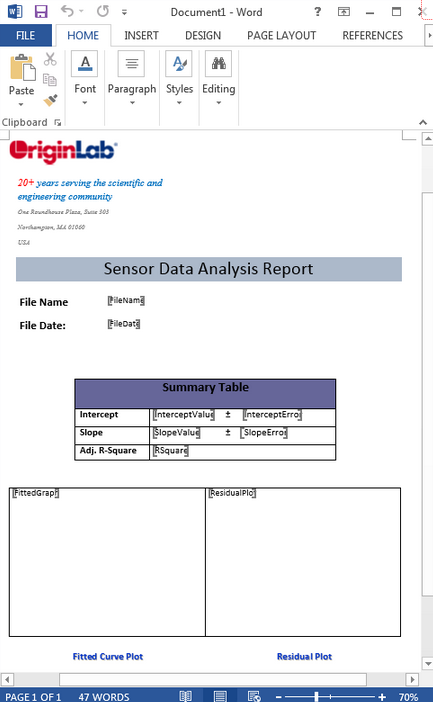
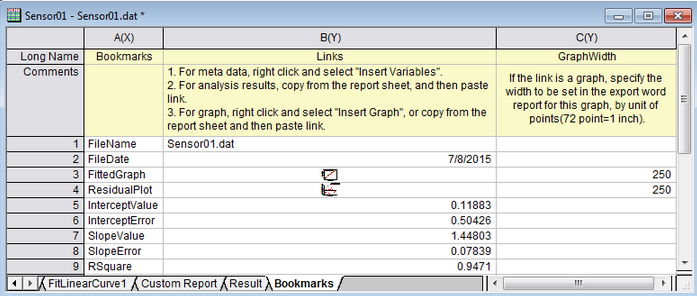
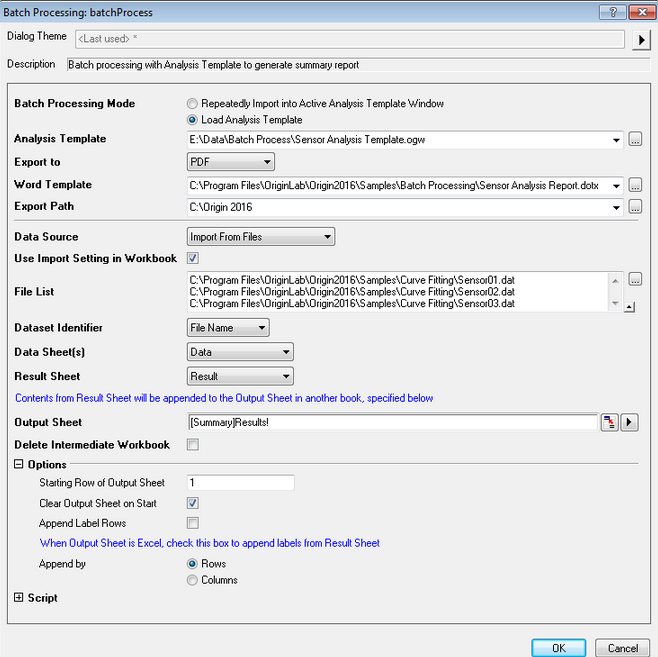
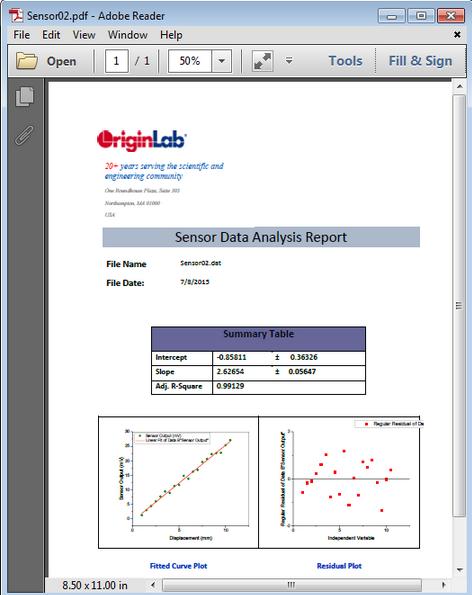
| Word template with Bookmark for Report Creation in Batch Processing | By creating a work template with Bookmarks and adding such bookmarks in Origin's Workbook Analysis template, Origin can perform batch analysis of multiple files and create PDF or Word reports with such Word template for each file. How to...we will use a built-in Word template Sensor Analysis Report.dotx which is located at <Origin EXE folder>\Samples\Batch Processing\ folder. To view the bookmark labels on the Word template, with the file open go to File: Options to open Word Options dialog. Then select Advanced on the left panel and scroll down to section Show document content on the right panel and check Show bookmarks checkbox there.
To add bookmarks to analysis template
To do batch processing to generate report based on Word template
| |
Project and Data Management
Programming and Connectivity
| JIRA | SUMMARY | DETAILS |
|---|---|---|
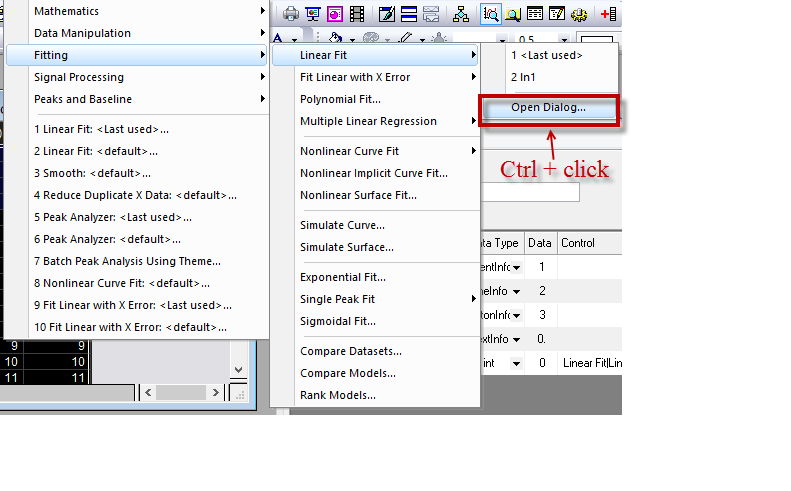
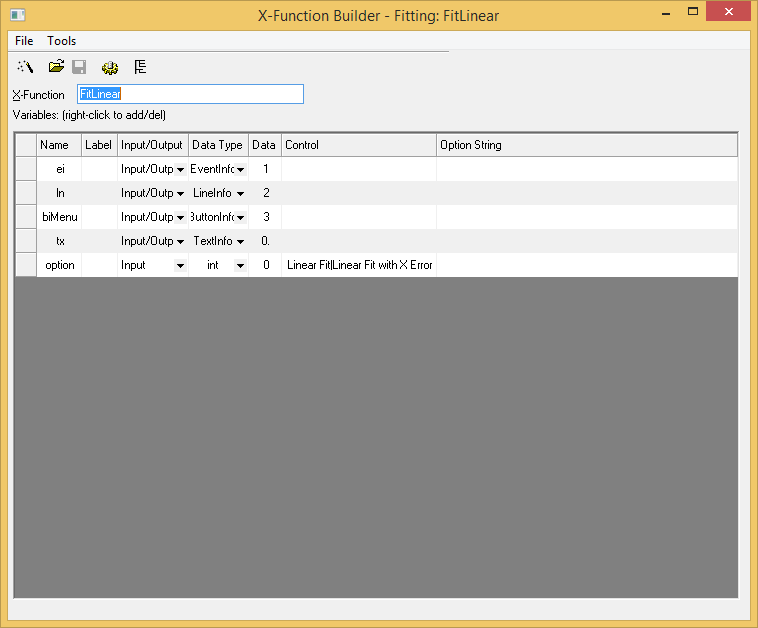
| ORG-12610 | X-Function: For X-Function based tools, Ctrl + Click on menu to view code behind it | Ctrl click the menu item will open up the XF in X-Function Builder
|
Other
| JIRA | SUMMARY | DETAILS |
|---|---|---|
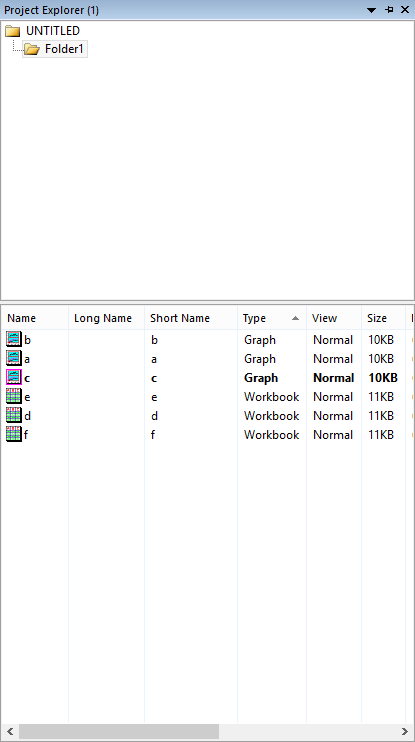
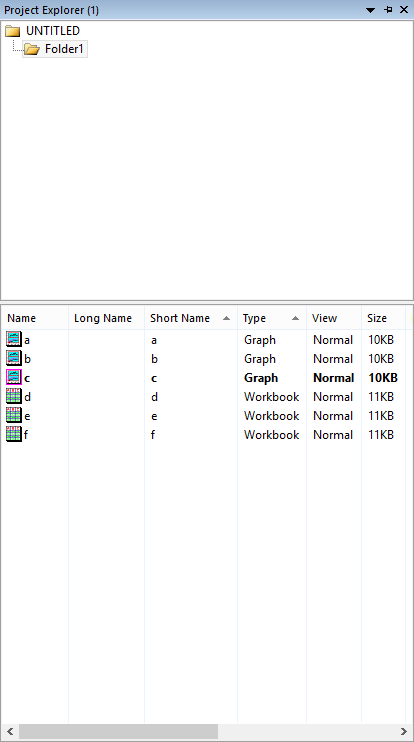
| ORG-11972 | Nested Sorting in Project Explorer, Layer Contents dialog, and Dataset Browsers with Shift key | Nested sorting will be helpful for customers to quickly find Supported in Detailed View of Project Explorer Left Panel of Layer Contents dialog Column/Dataset/Matrix Browsers in different analysis tools that supports multiple Input. PE now support nested sort that allowing files to be sorted within each group
2. Click Type to sort the files by type first, notice that they are still disordered by short name.
3. Want to sort by short name within each type group, Hold shift key and click Short Name. Now within each type, files are sorted by short name.
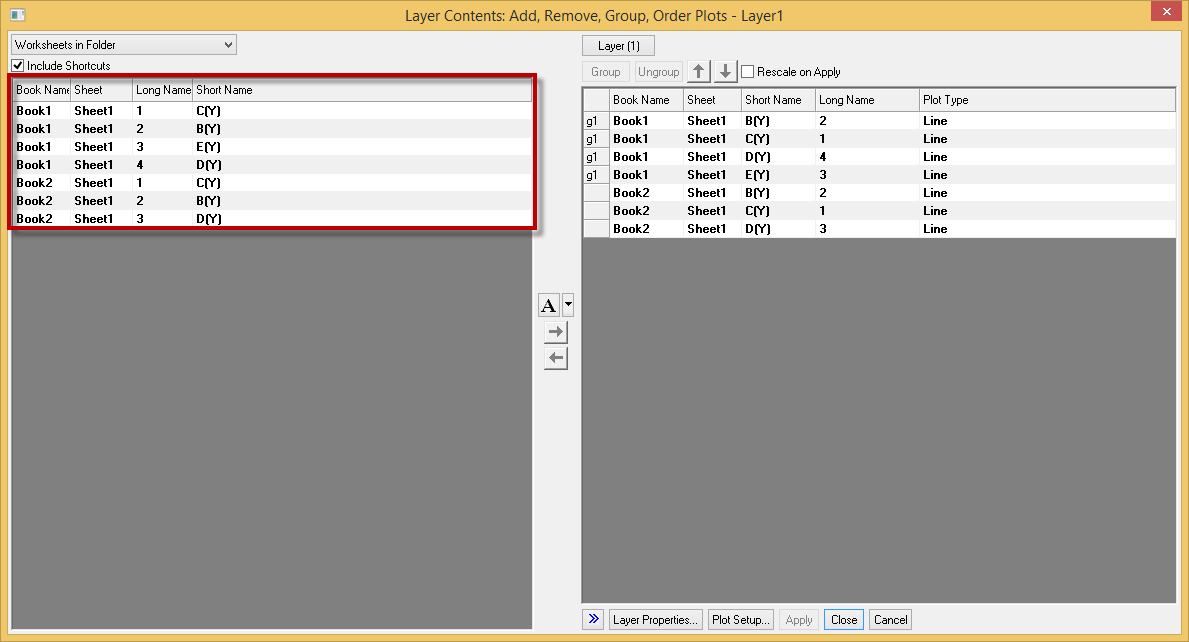
Layer contents dialog now supports nested sort The Long Name is sorted within each Book group:
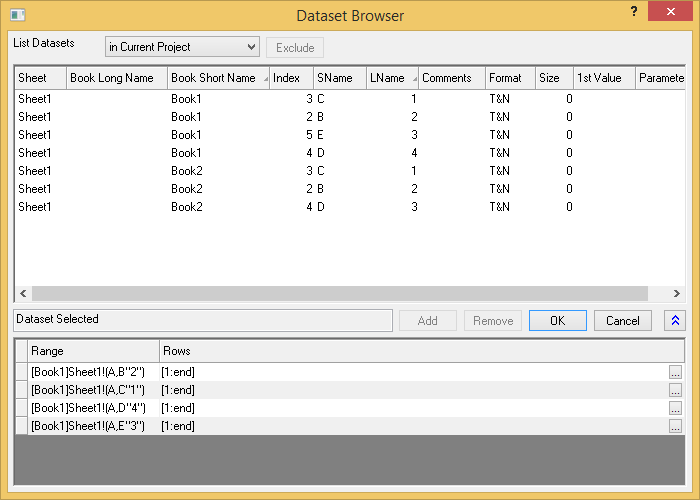
Dataset Browser supports nested sort The Long Name is sorted within each Book group:
|

Origin 2016 Highlights on YouTube
Top Features
Ease of Use
- Improved Color control: More Colors to pick from, Recent Color remembered, and Easier way to pick Custom Colors
- Dockable Object Manager to easily Show or Hide Plots on Graph
- Smart Plotting from Cloneable Template and New Template Library
- Switch Layer or Create New, and Move Plot Order in a Group in Layer Contents Dialog
- Set Units and Scientific tick label display in Tools: Options.
- Easier Way to Annotate Graph with Data or Label in Worksheet and Project&Window Information
- Annotation Tool: Customize Display Label, including metadata support, etc.
- Define and access Project Variables in Set Column Values dialog
- Edit: Select... menu to select or hide columns by column label
- Nested Sorting in Project Explorer, Layer Contents dialog, and Dataset Browsers with Shift key
Graphing
- New Axis scale type: Discrete to support skipping weekend and holidays in financial plots
- Data Labeling on Indiced Points Only and More Label Format Controls
- Line Spacing Control of Multi-line Text Object in Graph
- Legend and Color Scale improvements such as legend text following symbol color, color scale showing as color blocks with corresponding range
- Non-Zero Baseline in Axis dialog for Column/Bar, Drop lines and Area Plot
- Multi-layer Graph Improvements: Set Layer Width or Height by Common Scale and Align Layers with Specified Value
- Set Graph window Short and Long Name during Batch Plot and in Graph Template
Analysis
- Word template with Bookmark for Report Creation in Batch Processing
- Batch Process improvements: set Script Before Process, and append results by columns.
- Peak Analysis Improvements: Snap to Spectrum, Relative Baseline, Set Upper and Lower Bound of Peaks, etc.
- Provide GUI for customization of LR report table on graph
Statistics
- New statistics analysis tools such as Three-way ANOVA, Partial Correlation, Cross Tabulation
- Improvements such as Means Comparison on Interaction Combinations in Two-Way ANOVA and t-Test for Summarized Data
Import and Export
- Send Graphs to PowerPoint improvement: Specify what graphs to send and in what order. Insert new slides for each graph and copy start slide style to easily sending graphs to a pre-defined Powerpoint file or template.
- improvement of import ASCll & Excel: Import Multiple Files into Cloned Book/Sheets, run Script after import after ASCII, CSV, SPC and EXCEL import and set Column Plot Designation in ASCII and Excel Import
- Support more 3rd party data file formats for importing
Programming
Apps
We will continue to make more Add-in tools available for Origin 2016. To find out what is available, choose Tools: Apps on File Exchange: menu and see what's available there. E.g. Insert Map Images, Plot Submatrix and ODESolver for now.
There is a new dockable window called Apps on the right edge of Origin workspace. Click the icon to launch the App.
- Solve Ordinary Differential Equations
- Heat Map with Dendrogram
- Tangent
- Plot Sub matrix
- Send Graphs to Word
- Simple Fit
- Maps Online