box chart\bar\column plot improvements: allow map color to groups defined through column label
| Specify subgroup according to its column label | Stack plot support groups defined by column label |
|---|---|
| ORG-12531 | ORG-13371 |
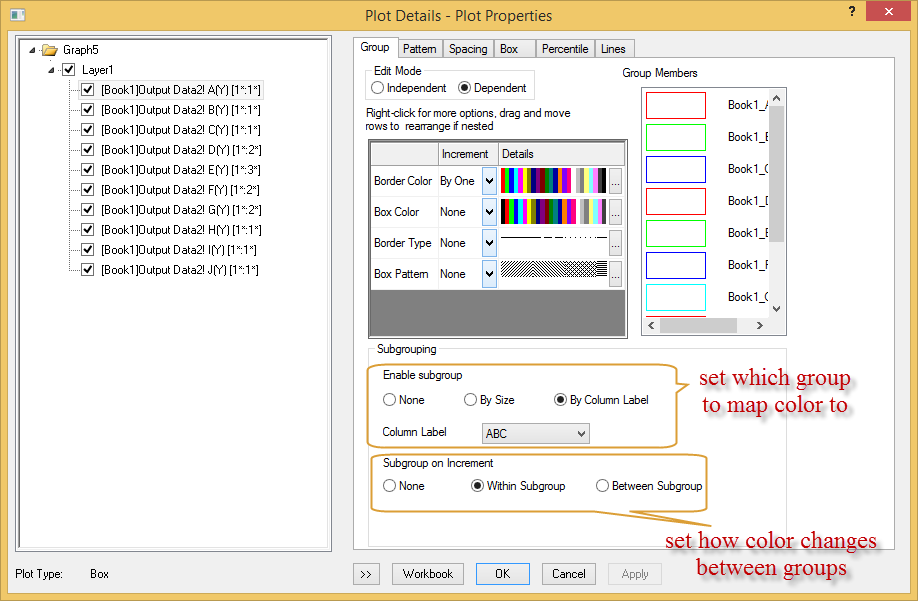
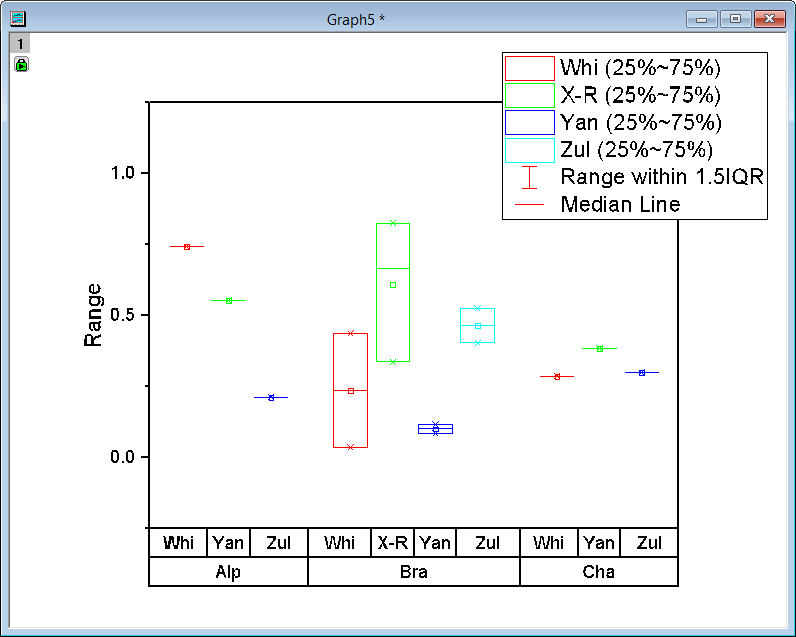
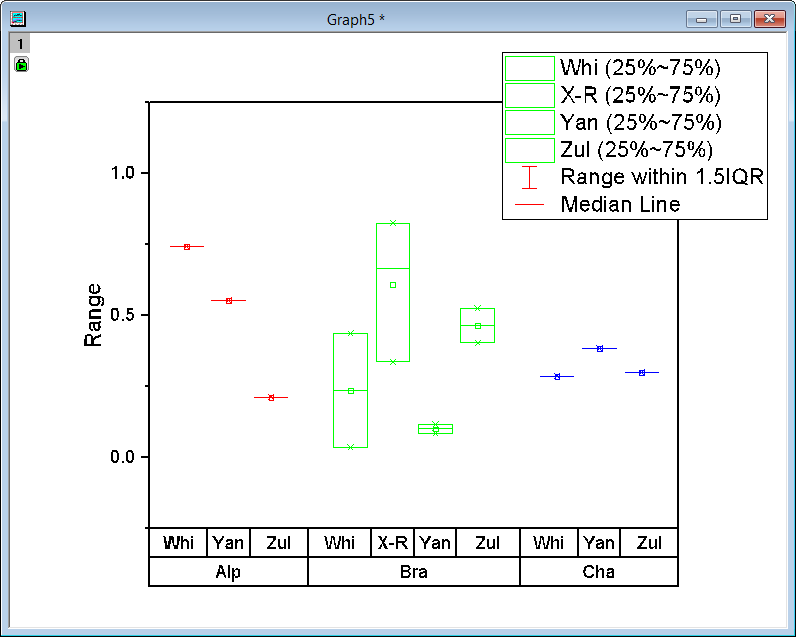
In the plot detail of grouped box chart plot, allow the color of the box to map to which level of the group which is very useful for dataset with unbalanced group size.
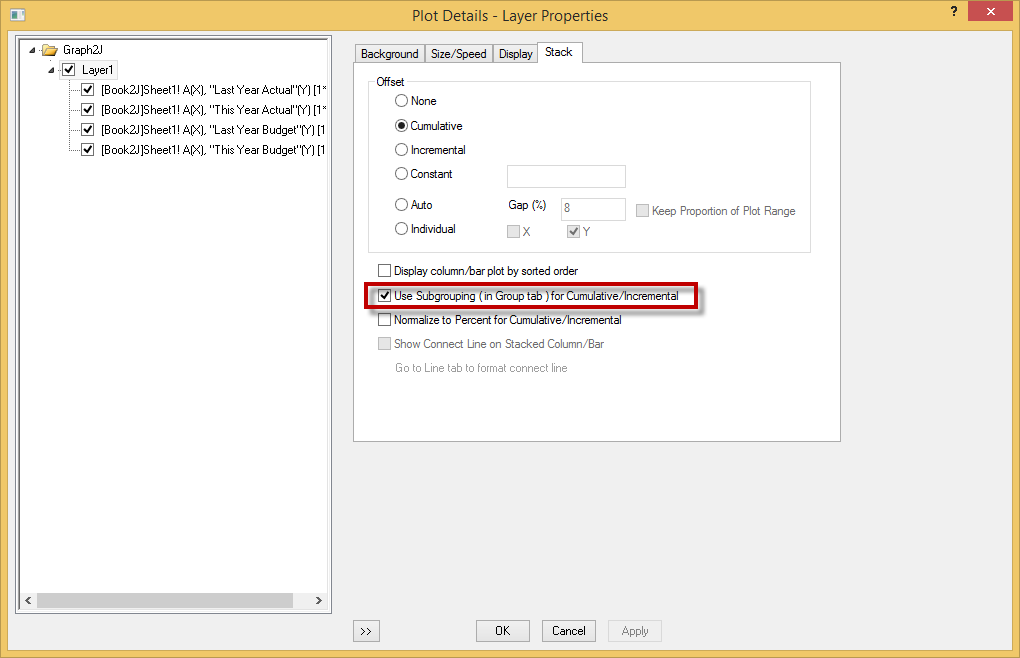
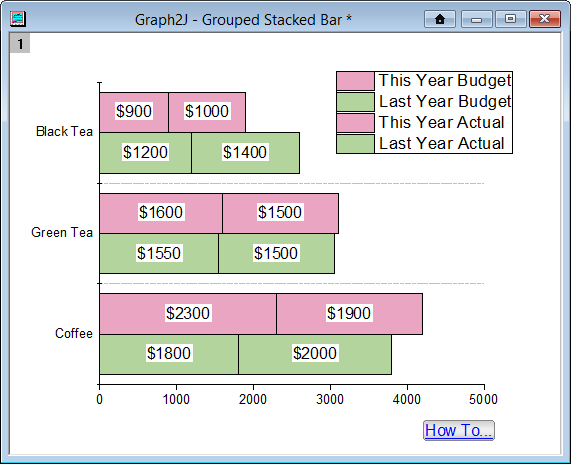
2. If color is set to vary within subgroups: | In stack column/bar plot, if subgroup is set based on column label, then we can have the column/bar to stack based on that subgroup.
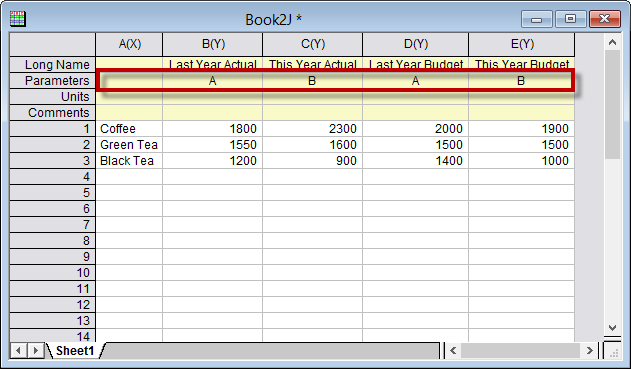
In this case, subgroup are set based on "Parameters" . The resulting bars are colored and stacked based on this subgroup.
|
| Grouped box chart plot from raw data can sort plot order by group info | |
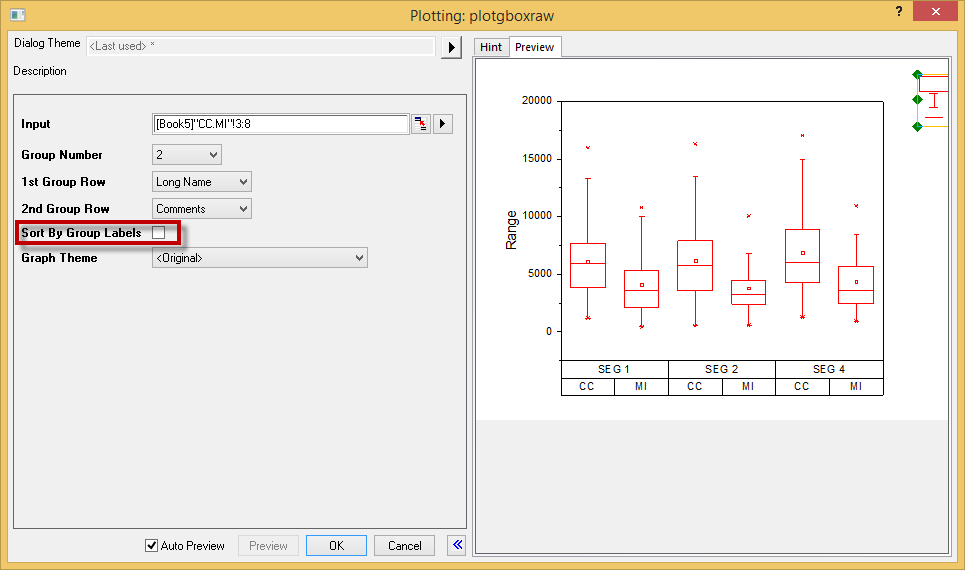
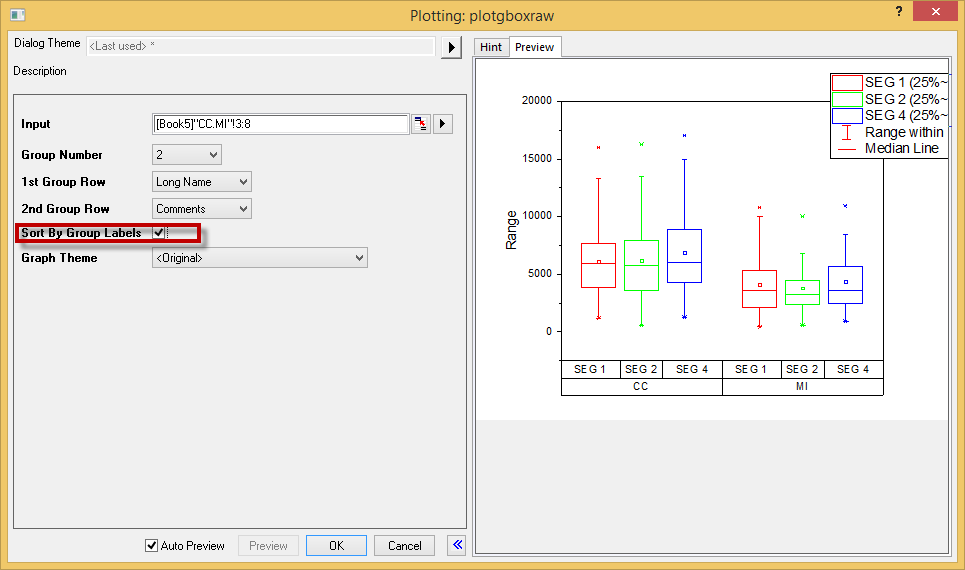
Add a check box "sort By Group Labels" to allow nested sorting of the box labels: Before sorting, boxes are ordered by appearance order. After sorting, boxes are ordered alphabetically on each group label. |
, multiple selections available,
